Cool and Rainy April

The preliminary statewide average April temperature was 49.6 degrees, 2.7 degrees below the 1991–2020 average and tied for the 30th coldest on record going back to 1895. The preliminary statewide average total March precipitation was 3.74 inches, 0.06 inches below the 1991–2020 average and the 73rd driest on record statewide.    

Data are provisional and may change slightly over time

Where is Spring?

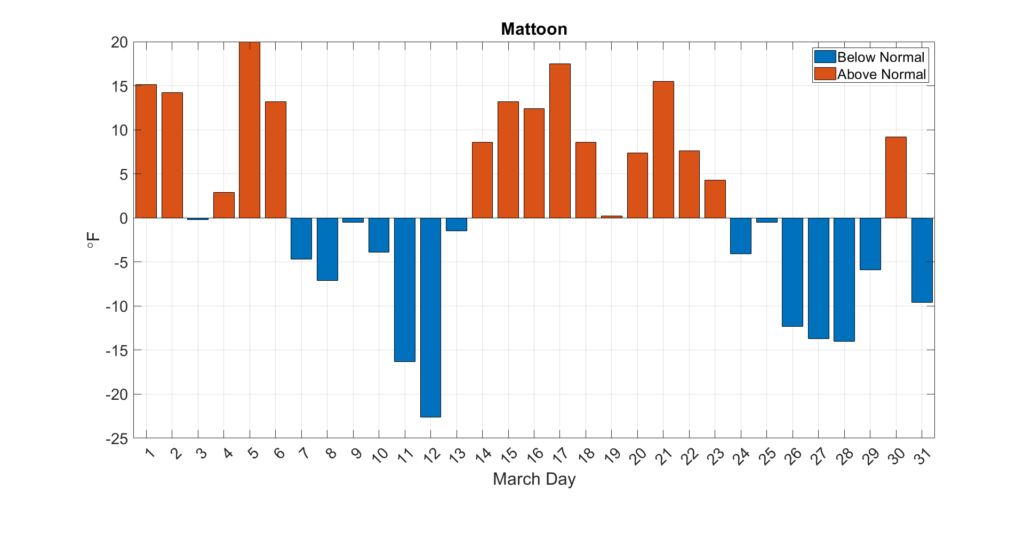
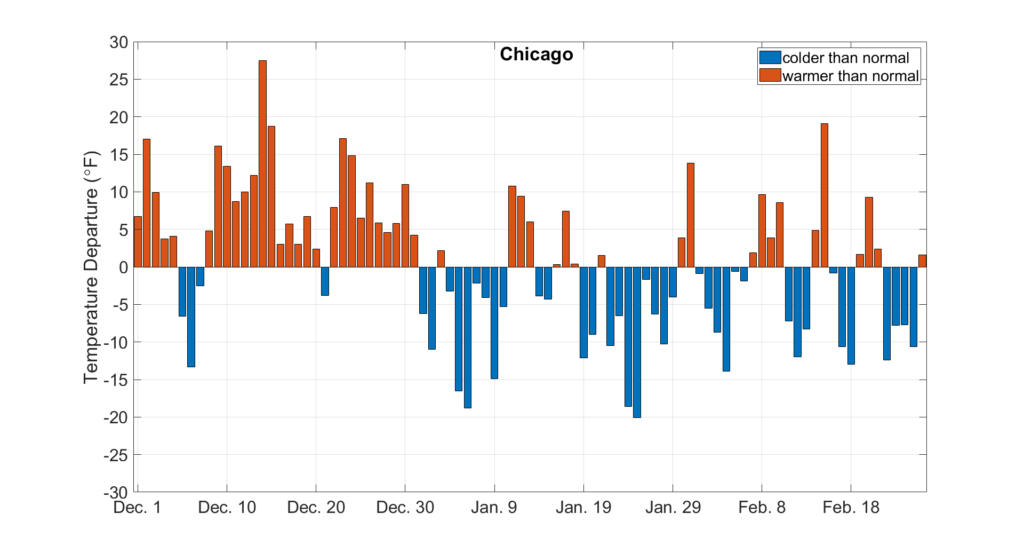
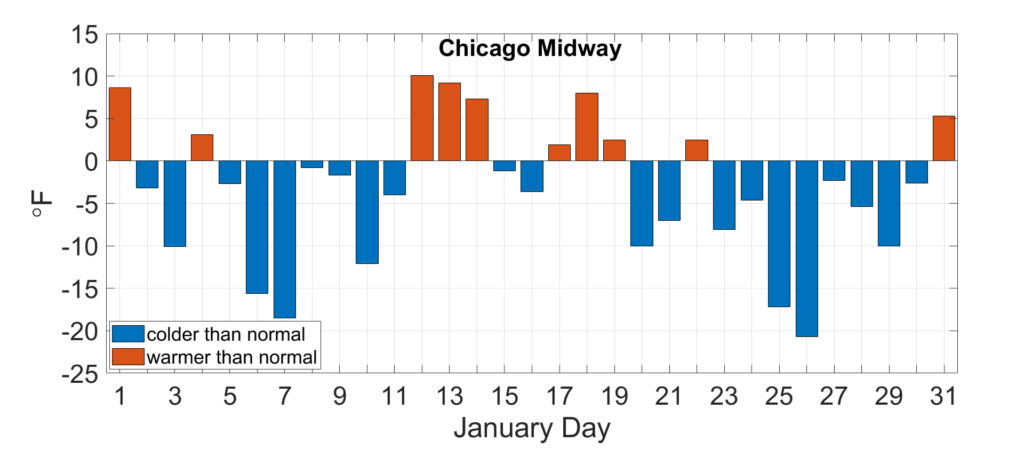
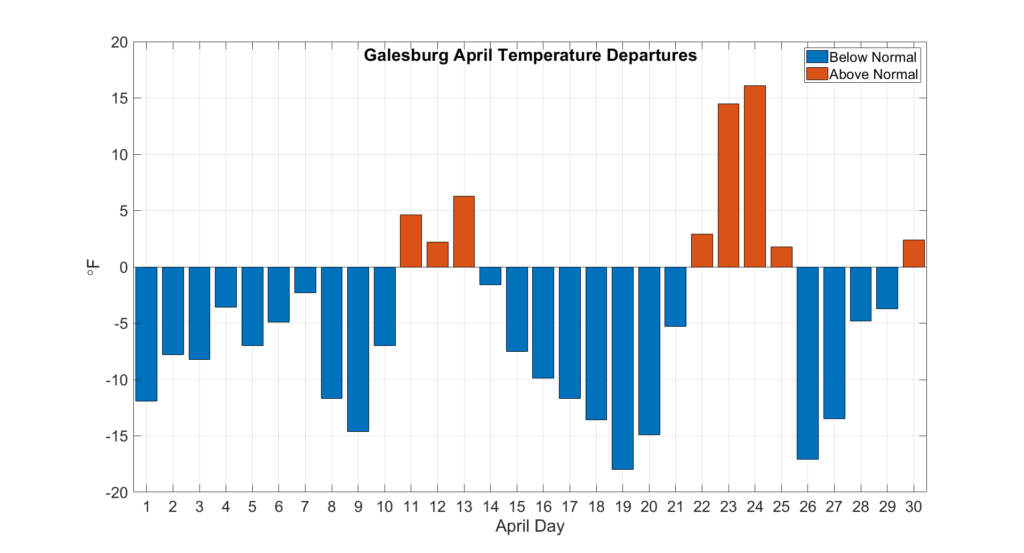
It’s not a stretch to say that most in Illinois are ready for warm weather by the time we hit mid-April. However, this year did not deliver as April temperatures were persistently well below normal. As Figure 1 shows with daily temperature departures from Galesburg, most days this past month were 5 to 10 degrees colder than normal. Only 8 out of 30 April days in Galesburg were warmer than normal, and most by only a few degrees.

As a result of the colder weather, most of the state experienced below freezing temperatures as late as mid-April, and frost was reported as far south as the St. Louis Metro East on April 26.

Figure 1. Daily April average temperature departures in Galesburg.

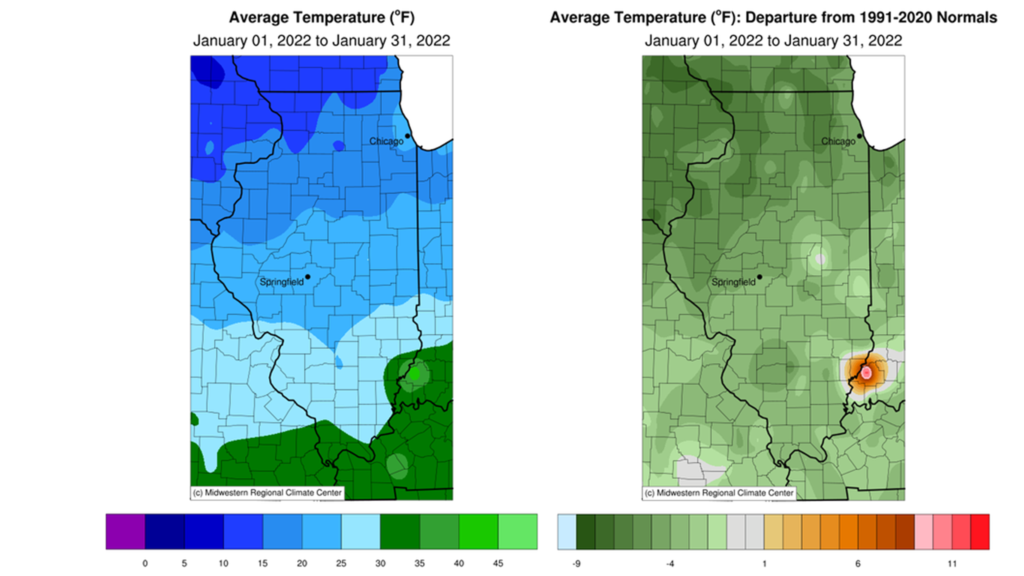
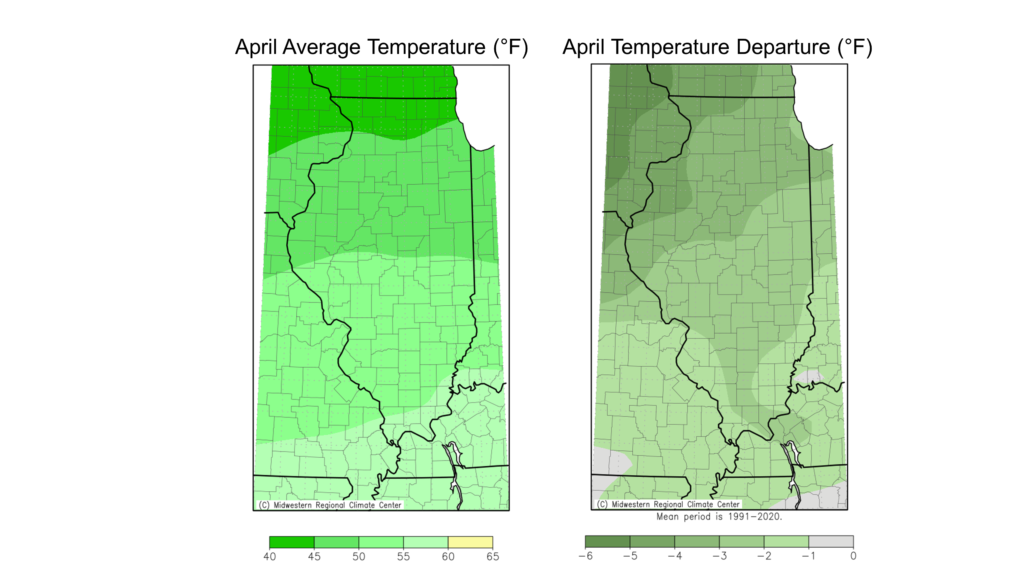
April average temperatures ranged from the low 40s in northern Illinois to the mid-50s in southern Illinois, between 1 and 6 degrees below normal (Figure 2). The coldest point in the state last month was Galena in Jo Daviess County with an average temperature of 40.8 degrees (6 degrees below normal). The warmest point in the state was Cairo in Alexander County with an average temperature of 56.1 degrees (2.5 degrees below normal). On some of the few warmer April days, many stations in Illinois hit highs in the mid-80s, including 86 degrees on April 23 in Chicago, Moline, and Quincy. Meanwhile, many stations in northern and central Illinois regularly experienced low temperatures in the mid- to low 20s, including 22 degrees on April 17 in Freeport, Rockford, and Normal.

Altogether, daily high maximum temperature records were broken last month at 9 stations, and daily high minimum temperature records were broken at 17 stations. Daily low maximum temperature records were broken last month at 12 stations, and daily low minimum temperature records were broken at 24 stations. 

Figure 2. Maps of (left) April average temperature and (right) April average temperature departures from normal.

Overall, the preliminary statewide average April temperature was 49.6 degrees, 2.7 degrees below the 1991–2020 average and tied for the 30th coldest on record going back to 1895.

 Rainy April

Given how persistently rainy last month was, we best have a plethora of May flowers. For most places, the total amount of April precipitation was not excessive, and some areas were drier than normal. However, precipitation frequency last month was unusually high as most places recorded 12+ days with some measurable precipitation. Macomb had 22 days with measurable precipitation last month, Aurora had 20, Champaign had 19, and Cairo had 18. The 22 wet days in Macomb last month set a new record for April, which was the 2nd highest frequency of any month on record, only less than the 23 wet days in Macomb in October 2009. Frequent, small precipitation meant most places only had 2 to 2.5 days between precipitation events last month, which stymied fieldwork statewide.

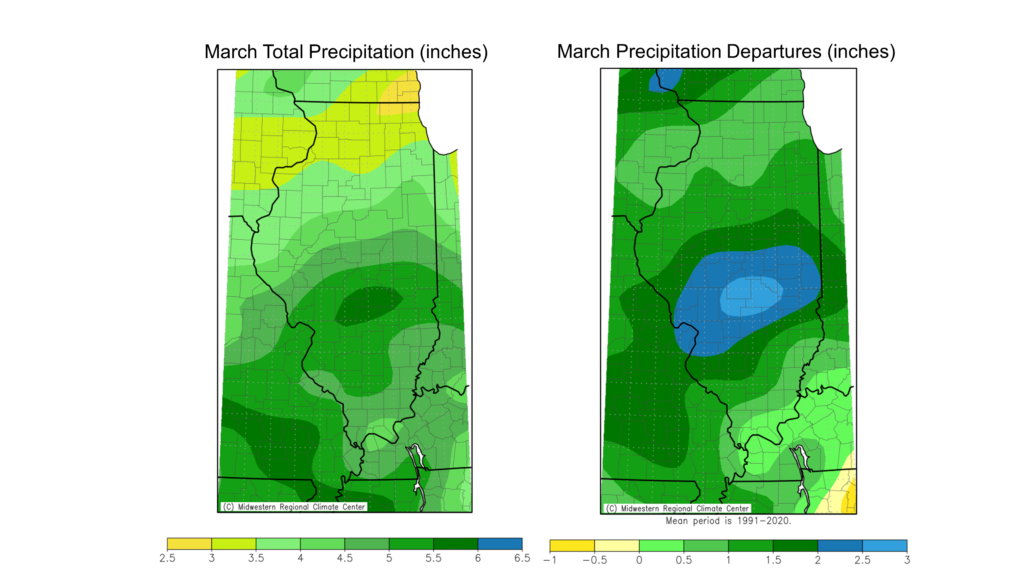
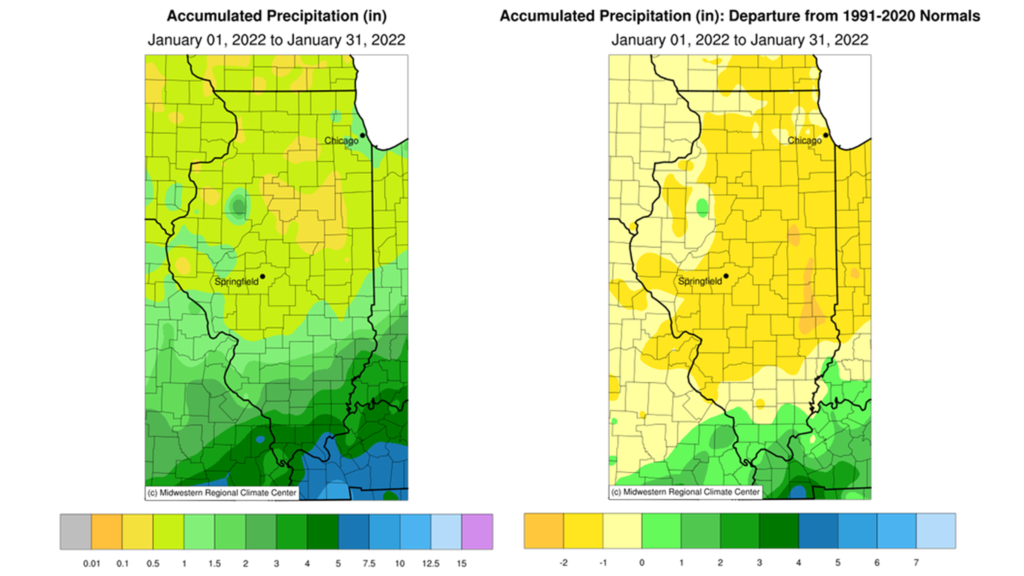
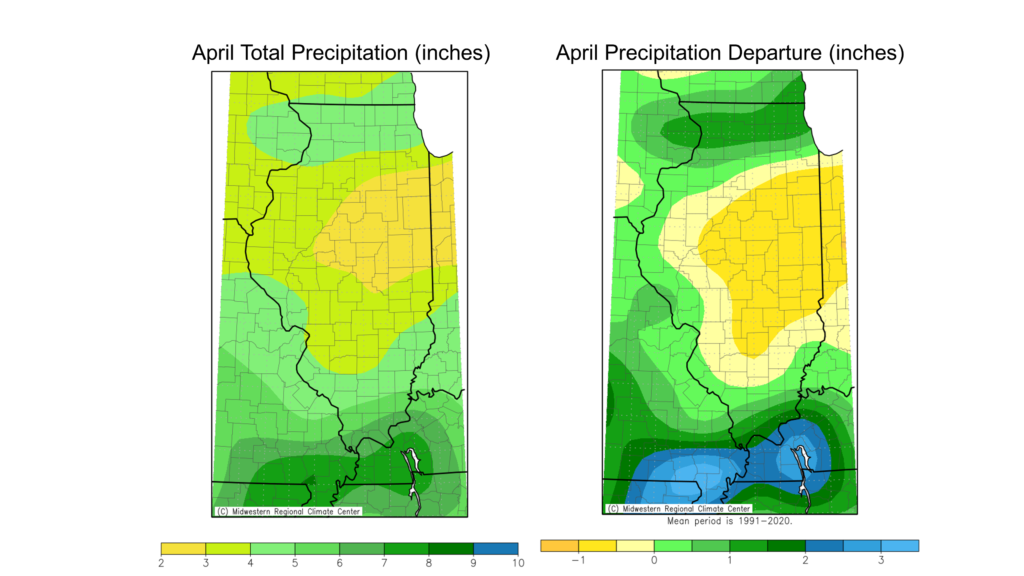
Oddly, extremely frequent precipitation did not amount to extreme totals last month. Total April precipitation ranged from just under 3 inches in east-central Illinois to over 6 inches in far southern Illinois (Figure 3). Most areas north of Interstate 80 and south of Interstate 64 were 1 to 2 inches wetter than normal last month. Meanwhile, despite many places in central Illinois having recorded 15–20 days with measurable precipitation last month, most of the central part of the state was near to slightly drier than normal. For example, Champaign recorded 19 days in April with measurable precipitation, but still ended the month about 1.4 inches drier than normal.

Figure 3. April total precipitation (left) and April precipitation departure from normal (right).

The persistently wet and cool month did make quite a dent in drought conditions in northern Illinois. Soil moisture and streamflow across northern Illinois have recovered to pre-drought conditions, and in response the U.S. Drought Monitor eliminated all drought across the state on April 26. That ended a 55-consecutive-week stretch of some drought in Illinois, the longest in the 20+ year Drought Monitor record.

Groundwater levels in northern Illinois are the lone remaining legacy of the drought as they have yet to fully recover. Groundwater levels tend to respond much more slowly going into and coming out of drought, so it is not unexpected to see groundwater drought conditions remaining. However, if the wet pattern continues, we should see more improvement in groundwater conditions in northern Illinois.

Meanwhile, the lack of extreme rainfall last month kept most serious flooding at bay. However, soils across the state remained wet due to frequent rain and cooler temperatures. This caused fieldwork and planting delays, especially in southern Illinois, where conditions remain wetter than normal for this time of the year. 

Overall, the preliminary statewide average total March precipitation was 3.74 inches, 0.06 inches below the 1991–2020 average and the 73rd driest on record statewide.   

April Snow

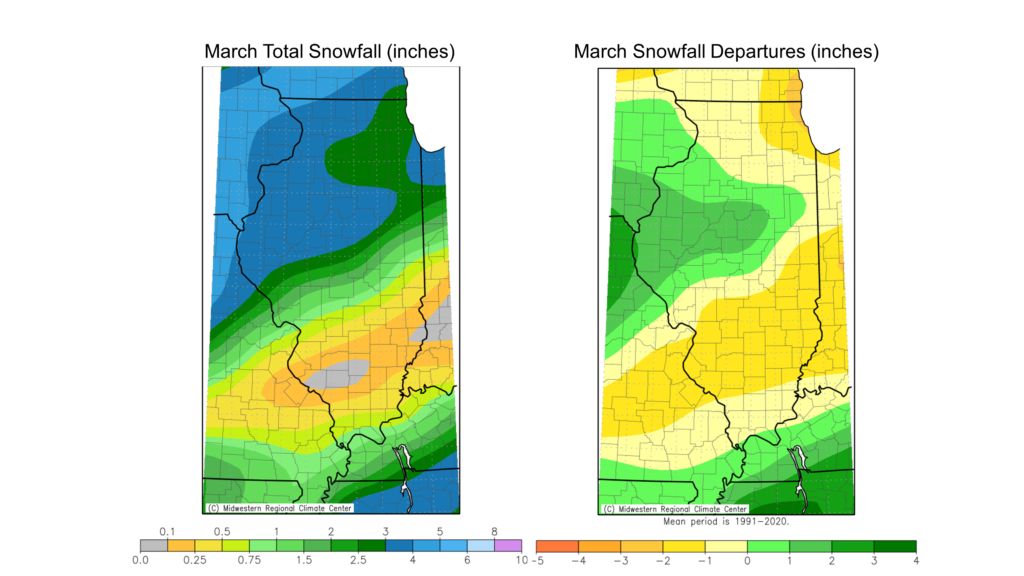
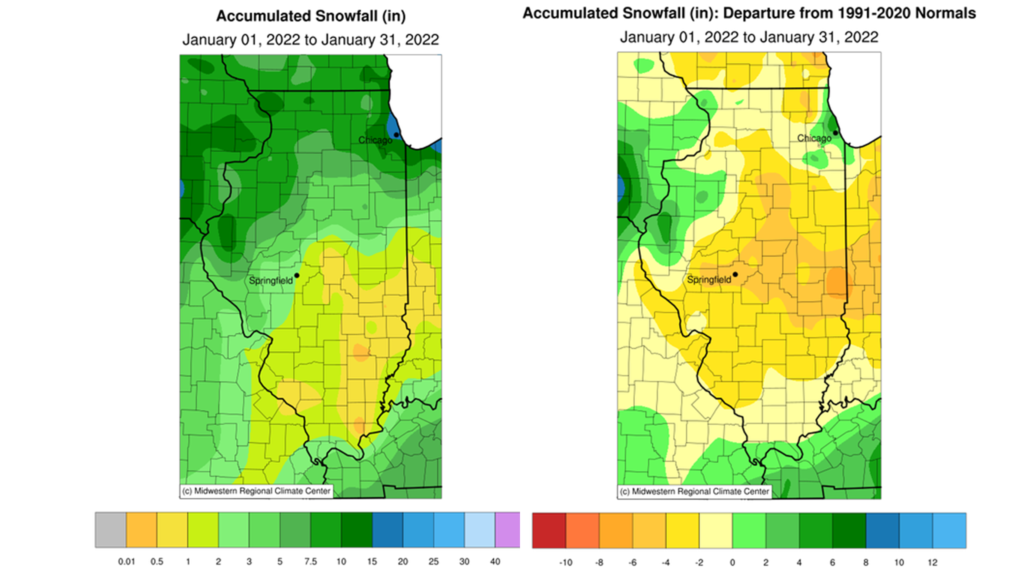
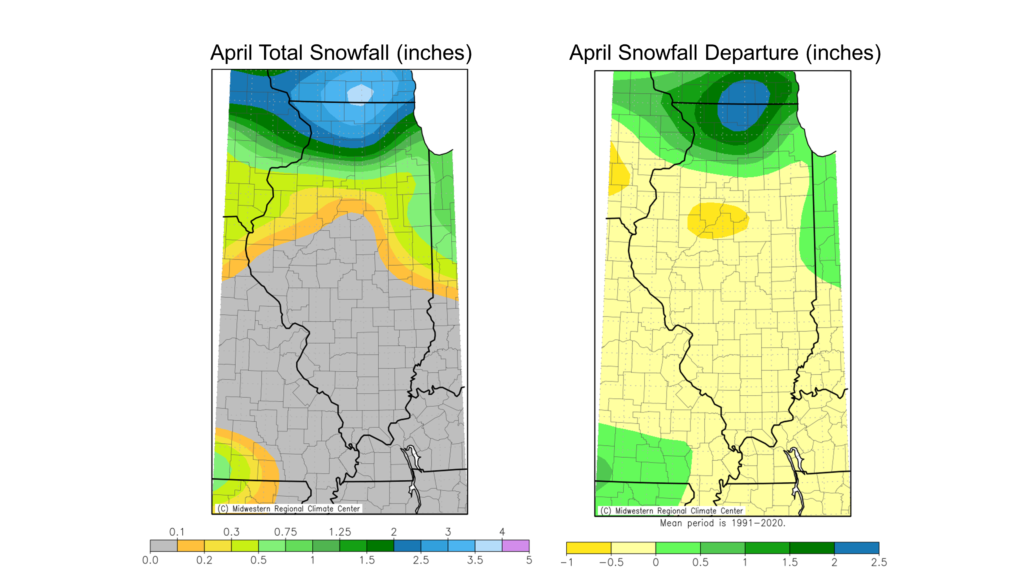
April snow is not unusual for the northern half of the state; however, this month the white stuff stayed mostly north of Interstate 80. As Figure 4 shows, April snowfall totals ranged from just over a tenth of an inch along and north of Interstate 74 to over 3 inches around the Rockford area. April snowfall was between 0.5 and 2.5 inches above normal in northern Illinois, thanks to the persistently cooler temperatures.

Figure 4. Maps show (left) total April snowfall and (right) April snowfall departure from normal.

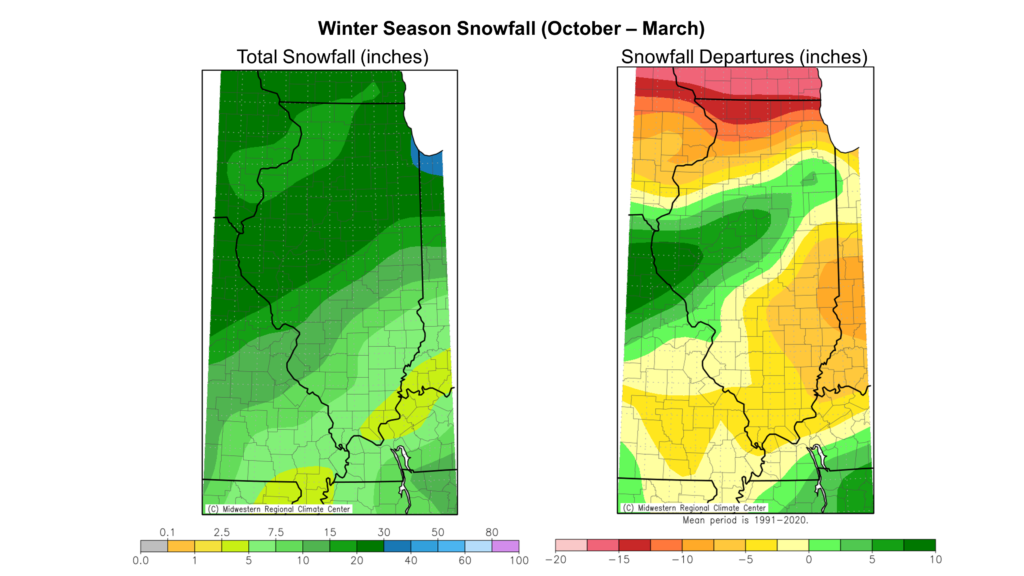
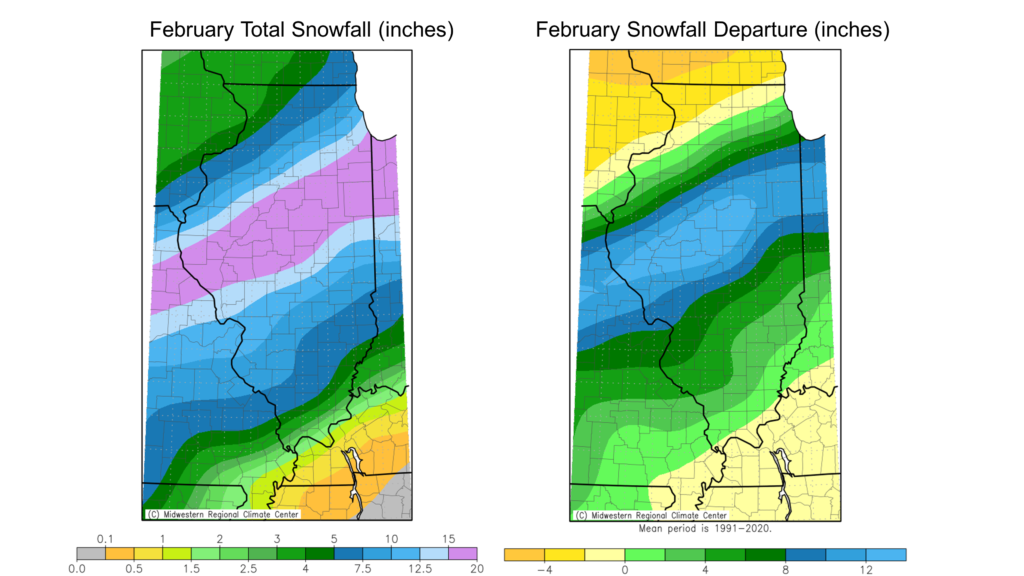
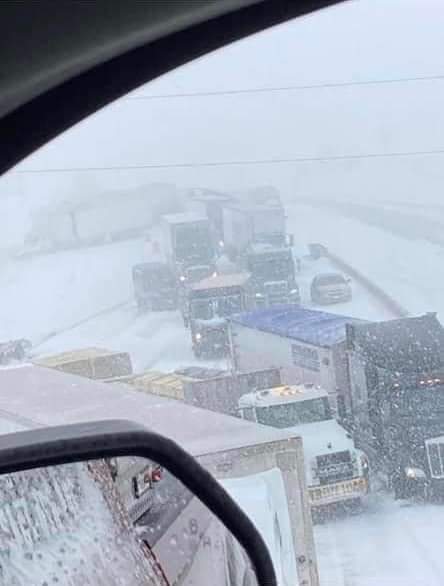
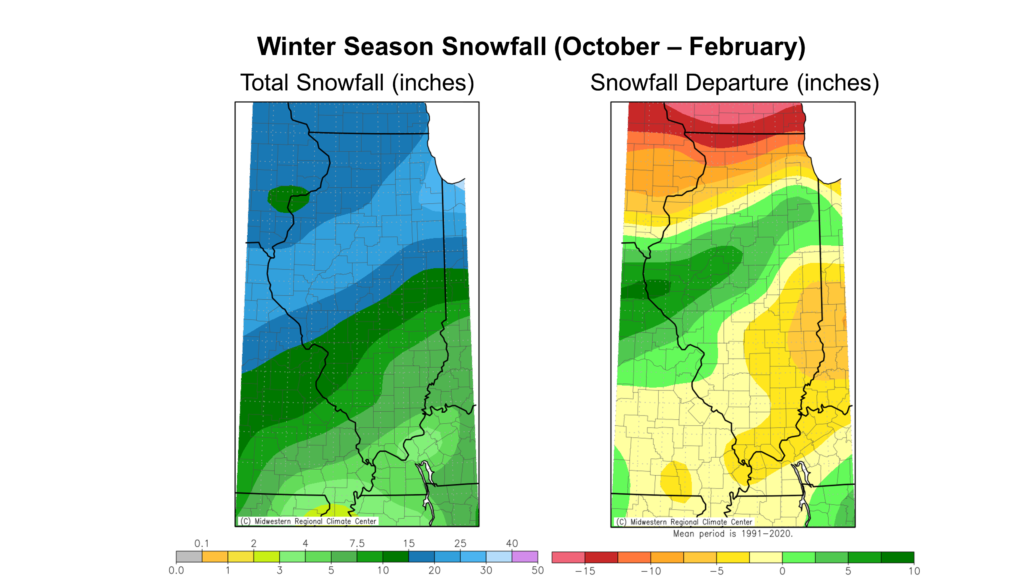
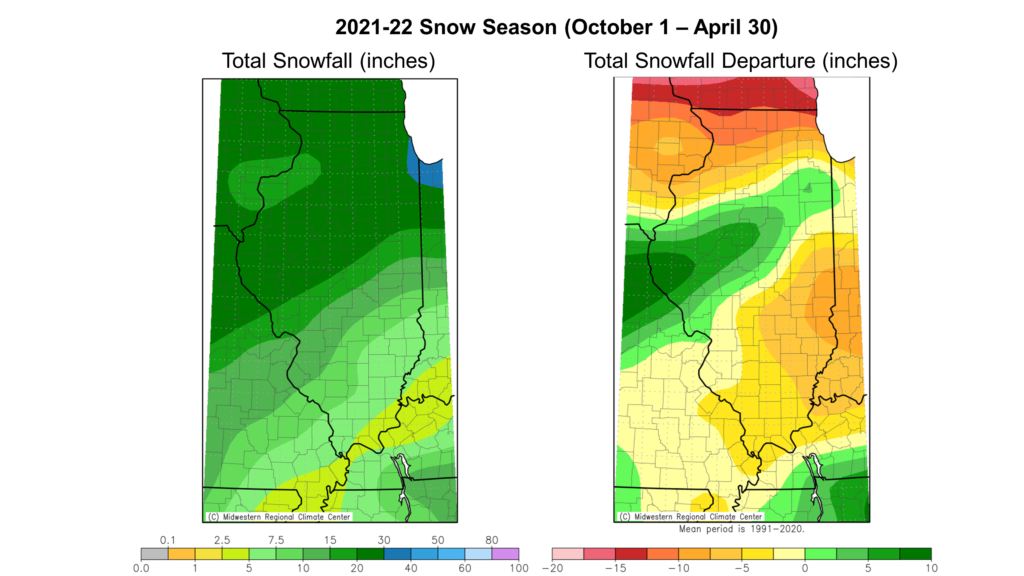
To be sure to account for late April snow, I don’t officially declare the snowfall season over until May 1. Now that we’re there we can look at how this past snowfall season–defined as October 1, 2021 to April 30, 2022–shaped up (Figure 5). Total season snowfall ranged from just over 30 inches in northeast Illinois to less than 5 inches in far southern Illinois. Most of the state was 5 to 15 inches below normal on snowfall this season, except for a narrow band from Calhoun County to Will County, which had 1 to 10 inches above normal. This strip of the state was repeatedly the target of winter storms, including the February 2–4 storm that produced as much as 20 inches over three days.

Figure 5. Winter season to date total snowfall (left) and departure from normal (right).

May & Early Summer Outlooks

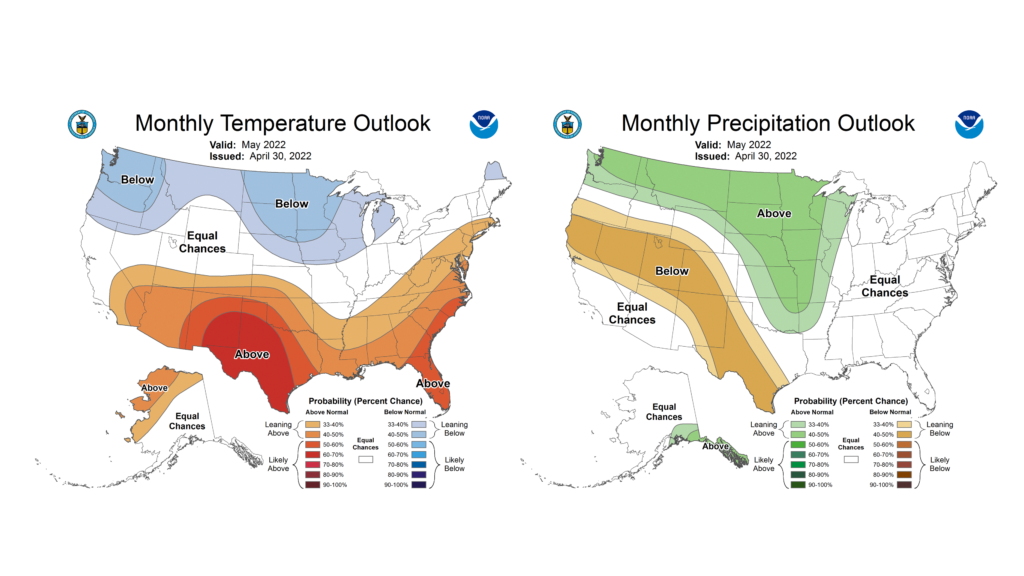
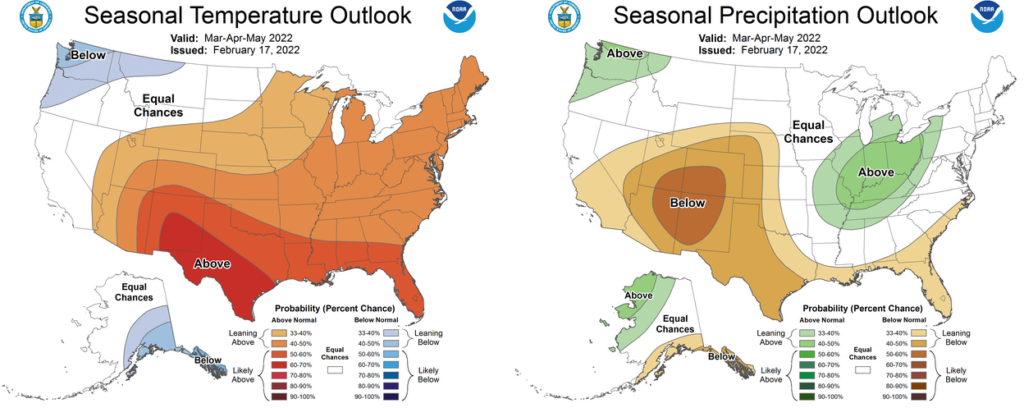
May is the final month of climatological spring and represents the transition from spring to summer weather. The most recent Climate Prediction Center outlooks suggest May could be a real transition month between what has been a colder spring and what may be a warmer summer.

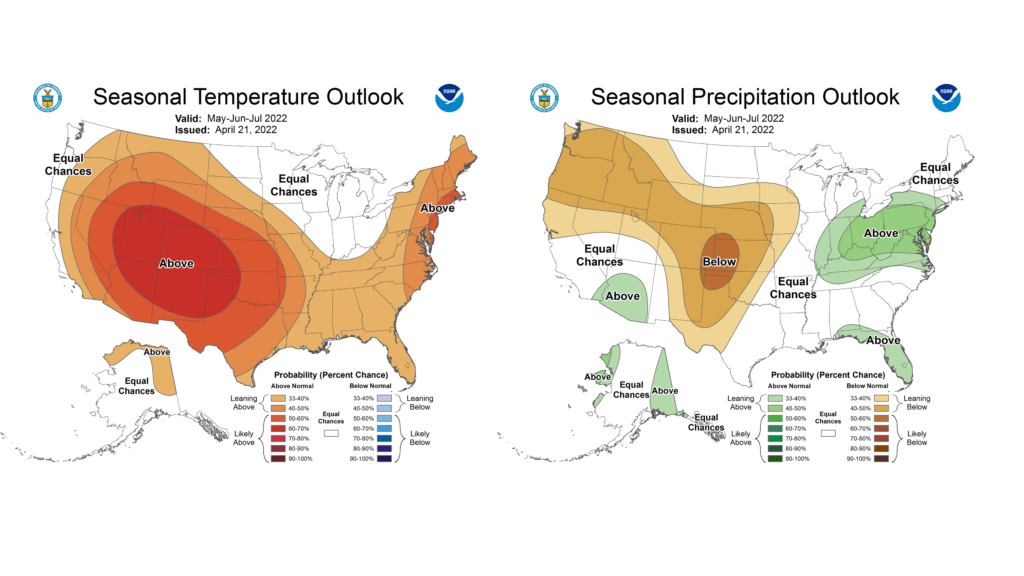
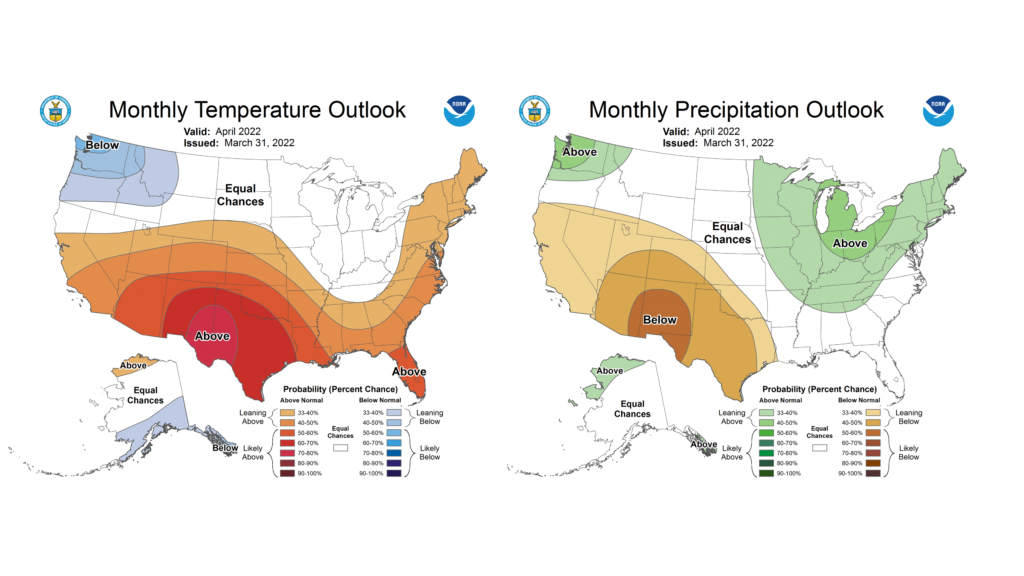
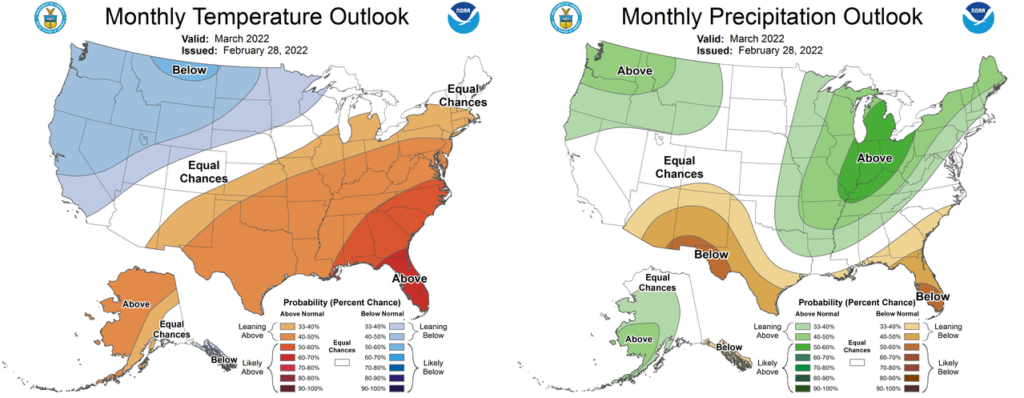
Outlooks for the month of May lean to below normal temperatures persisting from April in northern Illinois, with an equal chance of above and below normal temperatures in central and southern Illinois (Figure 6). However, the three-month (May–July) outlooks begin to lean to warmer than normal temperatures to start summer (Figure 7), and these chances increase as we move into the heart of summer, June–August.

On the precipitation side, May outlooks lean a bit wetter than normal for western Illinois but show equal chances of wetter and drier than normal rainfall for the rest of the state (Figure 6). The May–July outlooks put Illinois between higher chances of drier conditions to our west and wetter conditions to our east (Figure 7). As we move into summer, forecasts for June–August begin to move to higher chances of dry conditions farther east into western Illinois. The potential to go drier in the summer is a pattern we’ll want to keep our eye on through May and into June, but it’s important to note seasonal forecasts are typically the least confident in climatological summer. So, a lot can happen between now and June.

Figure 6. Climate Prediction Center (left) temperature and (right) precipitation outlooks for May.
Figure 7. Climate Prediction Center (left) temperature and (right) precipitation outlooks for May through July.

Of Lions and Lambs: March in Illinois

The preliminary statewide average March temperature was 42.5 degrees, 1.5 degrees above the 1991–2020 average and tied for the 40th warmest on record going back to 1895. The preliminary statewide average total March precipitation was 4.54 inches, 1.32 inches above the 1991–2020 average and the 21st wettest on record statewide.    

Data are provisional and may change slightly over time

Variable, But Warm March

Climatologically, March temperatures are among the most variable, day-to-day. This past month followed suit, as is shown in daily temperature departures from Mattoon (Figure 1).

March brought typical large temperature swings, with temperatures 10 to 15 degrees above normal in the first and third weeks of the month, and 10 to 15 degrees below normal in the second and fourth weeks. Only 10 out of the 31 days of the month had average temperatures that were within 5 degrees of the 30-year normals.

Figure 1. Daily March average temperature departures in Mattoon

March average temperatures ranged from the high 30s in northern Illinois to the high 40s in southern Illinois, between 1 and 4 degrees above the 1991–2020 normal (Figure 2). Several stations saw high temperatures in the high 70s early in the month, and even highs of over 80 degrees in St. Clair and Randolph counties. Meanwhile, many places in northern and central Illinois saw nighttime low temperatures in the single digits, including 3 degrees in Knox County.

Altogether, daily high maximum temperature records were broken at 14 stations in March, and daily high minimum temperature records were broken at one station. Daily low maximum temperature records were broken at 11 stations and daily low minimum temperature records were broken at 9 stations last month.  

Figure 2. Maps of (left) March average temperature and (right) March average temperature departures from normal.

Overall, the preliminary statewide average March temperature was 42.5 degrees, 1.5 degrees above the 1991–2020 average and tied for 40th warmest on record going back to 1895.

Wet End to March

The first two-thirds of March were quite dry in northern and southern Illinois, to the tune of 0.5 to 1 inch drier than normal through March 21. A series of storms moved through the Midwest in the last week of March and brought significant precipitation across the state in the form of rain, sleet, and snow.

In the end, March total precipitation ranged from just over 3 inches in northern Illinois to nearly 6 inches in south-central Illinois, between one-half and 3 inches above the 1991–2020 normal (Figure 3). Stations in Alton, Mt. Vernon, and Mattoon received over 7 inches of precipitation in March, over 4 inches above normal.  

Figure 3. March total precipitation (left) and March precipitation departure from normal (right).

Although the March precipitation was a bit lighter in northern and northwest Illinois, the late-month precipitation considerably improved drought conditions. The latest U.S. Drought Monitor, published March 31, improved the McHenry and Lake county listing from severe to moderate drought and completely removed drought in parts or all of Mercer, Henry, and Lee counties.

Meanwhile, the additional late March precipitation on already wet soils in central and south-central Illinois has caused more extensive standing water in fields and more areas reaching above flood stage along the Illinois, Wabash, and Kaskaskia rivers.

The preliminary statewide average total March precipitation was 4.54 inches, 1.32 inches above the 1991–2020 average and the 21st wettest on record statewide.

Yes, It Snows in March

After a virtually snowless December and holiday season, the snow finally arrived in February. Now that most folks are getting ready for spring and summer, Mother Nature said, “here’s that snow you ordered.” However, last month was certainly not the snowiest March on record, and only western Illinois had above normal March snow accumulation. Overall, March total snowfall ranged from over 4 inches in northern Illinois to less than a tenth of an inch in south-central Illinois (Figure 4).


Figure 4. Maps show (left) total March snowfall and (right) March snowfall departure from normal.

The technical climatological winter season is from December through February; however, as we all know, the snowfall season can begin much earlier and end much later. A good estimate of the full winter snowfall season in Illinois is from October 1 through May 1. Figure 5 shows the winter season-to-date total snowfall and departures from normal. Since October 1, snowfall totals have ranged from just under 5 inches in far southeastern Illinois to over 30 inches in northeast Illinois.

The area of the highest February snowfall from the northern edge of the St. Louis Metro East area to the southern edge of Chicagoland has been 1 to 10 inches snowier than normal since October 1, while snowfall in much of the rest of the state has been 2 to 7 inches below normal. The season’s total deficits are highest north of Interstate 80, with much of northern Illinois having 10 to 15 inches less snow than normal by the end of March.

Figure 5. Winter season to date total snowfall (left) and departure from normal (right).

April & Beyond Outlooks

April is truly a transition month as we say goodbye to winter weather and look ahead to summer. Final outlooks for the entire month of April show equal chances of above and below normal temperatures, and a continuation of leaning to likely above normal precipitation.  

This is good news in northern Illinois to help continue drought improvement. However, a continuation of frequent precipitation events in April could further delay agriculture activity and fieldwork in the wetter parts of central and southern Illinois.

Figure 6. Climate Prediction Center (left) temperature and (right) precipitation outlooks for April.

Meanwhile, the seasonal outlook for April through June still leans to warmer than normal weather for the spring-summer transition. Notice that for the April to June period we’re sandwiched between areas with higher chances of drier conditions west and wetter conditions east. This reflects the potential of a tight precipitation gradient as we move into summer, and we’ll see how these outlooks adjust in the coming weeks.

Figure 7. Climate Prediction Center (left) temperature and (right) precipitation outlooks for April through June.

An Active February Finishes Climatological Winter

The preliminary statewide average February temperature was 27.2 degrees, 3.0 degrees below the 1991–2020 average and tied for 42nd coldest on record going back to 1895. The preliminary statewide average total February precipitation was 3.41 inches, 1.48 inches above the 1991–2020 average and the 9th wettest on record statewide.    

Data are provisional and may change slightly over time

Variable, But Cold February

Climatologically, February is the second coldest month statewide after January. Much like January, February temperatures also tend to be quite variable day to day.

Figure 1 shows daily temperature departures from normal in Chicago over the course of the climatological winter (December–February). Following a very warm December–the fourth warmest on record in Chicago–temperatures since the beginning of the new year have been variable, but mainly colder than normal. About two-thirds of January and February days were colder than normal in Chicago.


Figure 1. Daily February average temperature departures in Chicago.

February average temperatures ranged from the low 20s in northern and north-central Illinois to the high 30s in far southern Illinois, between 1 and 6 degrees below the 1991–2020 normal. Several stations saw daily high temperatures in the high 60s in mid-February, including 67 degrees in Alexander and Pope Counties. Meanwhile, stations in northern and central Illinois saw nighttime low temperatures well below 0, including -9 degrees in Knox County and -8 degrees in Woodford County.

Altogether, daily high maximum temperature records were broken at seven stations in February, and daily high minimum temperature records were broken at five stations. Despite the persistently below normal temperatures last month, no daily low minimum or low maximum temperature records were broken.


Figure 2. Maps of (left) February average temperature and (right) February average temperature departures from normal.

Overall, the preliminary statewide average February temperature was 27.2 degrees, 3.0 degrees below the 1991–2020 average and tied for the 42nd coldest on record going back to 1895.

Tale of Two Winters

February wrapped up a climatological winter season that, even more than other winters, cannot be summarized by seasonal averages and totals alone. As Figure 3 shows, winter started with extremely mild weather in December statewide, followed by a cold but dry January. February was really the only month that brought both winter-like temperatures and the active weather we expect from Illinois winter.


Figure 3. Winter average temperature departures from normal by month. Maps show (left) December, (middle) January, and (right) February.

The 2021-2022 climatological winter average temperatures ranged from the low 20s in northern Illinois to the high 30s in southern Illinois, within 1 degree of normal statewide (Figure 4). Overall, the preliminary statewide average winter temperature was 29.5 degrees, 1.3 degrees above the 1991–2020 normal and tied for the 41st warmest on record.


Figure 4. Maps of (left) winter average temperature and (right) winter average temperature departures from normal.

Wet February

After a very dry January, February brought more active weather to most of the state. Total February precipitation ranged from less than 1 inch in far northwest Illinois to over 9 inches in parts of southern Illinois. Last month was about 1 inch drier than normal in northwest Illinois, 1 to 2 inches wetter than normal in central Illinois, and 4 to 7 inches wetter than normal in southern Illinois. Two observers near Cobden in Union County measured more than 9 inches of rain in February, one of the top 20 highest February totals on record statewide. Meanwhile, several stations in northwest Illinois recorded less than three-quarters of an inch of precipitation for February, including 0.63 inches in Freeport and 0.57 inches in Stockton. It was a top 10 driest February on record in Dubuque, Iowa.


Figure 5. February total precipitation (left) and February precipitation departure from normal (right).

Unfortunately, February precipitation patterns reinforced a dry north-to-wet south pattern in Illinois, present since the fall. The heavy February rain and snow melt in southern Illinois has caused several spots along the Wabash and Ohio Rivers and tributaries to reach or exceed moderate flood stage. Excessively wet soils in southern Illinois also raise concerns of continued flooding risks and possible fieldwork issues as we approach the start of the growing season. Concurrently, the dry winter has not helped alleviate drought conditions across northern Illinois, as the U.S. Drought Monitor expanded or continued moderate to severe drought from Lake County to Rock Island County.

The preliminary statewide average total February precipitation was 3.41 inches, 1.48 inches above the 1991–2020 average and the 9th wettest on record statewide.

The climatological winter total precipitation ranged from just around 3 inches in far northwest Illinois to nearly 20 inches in southern Illinois. Winter was between 2 and 3 inches drier than normal in western and northwest Illinois, within 1 inch of normal in central Illinois, and 5 to 7 inches wetter than normal in far southern Illinois. The preliminary statewide total winter precipitation was 7.26 inches, 0.72 inches above the 1991–2020 normal, and the 41st wettest on record.

Finally, Some Snow!

After a very slow start to winter, much of the state finally saw considerable snowfall in February. A series of winter storms in early to mid-February brought several rounds of moderate to heavy snowfall, with the highest totals along and around the Interstate 55 corridor from St. Louis to Chicago.

Overall, February total snowfall ranged from less than 4 inches in southern and far northwest Illinois to over 20 inches in parts of central and northeast Illinois. February snowfall was 2 to 4 inches below normal in drought-stricken northwest Illinois, within 2 inches of normal in northeast and southern Illinois, and 6 to 12 inches above normal from the St. Louis Metro East through central Illinois into the southern Chicagoland area.

Figure 6. Maps show (left) total February snowfall and (right) February snowfall departure from normal.

Heavy February snowfall broke daily snowfall records at 53 stations in Illinois, and the 8.33 inches observed on February 3 in Jerseyville broke their all-time February daily snowfall record. Some of the most impressive single-day snowfall totals from last month include 14 inches in Woodford County on February 2, 11.8 inches in Cook County on February 2, and 10.5 inches in Vermilion County on February 3.

The heavy snowfall caused significant transportation impacts throughout February, including closures along Interstates 38, 55, 57, and 74 in central and north-central Illinois due to poor road conditions and traffic accidents. The mid-February winter storm caused a 100+ vehicle pileup on Interstate 39 north of Bloomington-Normal (Figure 7), shutting down the Interstate for several days.


Figure 7. Multiple-vehicle pileup along Interstate-39 north of Bloomington-Normal, taken on February 17. Photo Source: Illinois Department of Transportation.

The technical climatological winter season is from December through February; however, as we all know, the snowfall season can begin much earlier and end much later. A good estimate of the full winter snowfall season in Illinois is from October 1 through May 1. Figure 8 shows the winter season to date total snowfall and departures from normal. Since October 1, snowfall totals have ranged from just under 5 inches in southern Illinois to over 20 inches in northeast Illinois.

The area of the highest February snowfall from the northern edge of the St. Louis Metro East area to the southern edge of Chicagoland has been 1 to 10 inches snowier than normal since October 1, while snowfall in much of the rest of the state has been 2 to 7 inches below normal. The season total deficits are highest north of Interstate 80, with much of northern Illinois having 10 to 15 inches less snow than normal by the end of February.

Figure 8. Winter season to date total snowfall (left) and departure from normal (right).

March & Spring Outlooks

March is a celebratory month in many ways, but one of the most significant is the start of climatological spring. The most recent March outlooks from the Climate Prediction Center are leaning toward a warmer than normal start to spring and show strongly elevated odds of a wetter than normal March (Figure 9).

This is good news for parts of northern Illinois that have not had enough precipitation in winter to make up for drought and deficits in summer and fall. However, the news of a potentially wetter than normal start to spring is less welcome in southern Illinois. A wet start to an already typically wet season increases the risk of excessively wet soil issues and flooding in southern Illinois this spring.


Figure 8. Climate Prediction Center (left) temperature and (right) precipitation outlooks for March.

The spring seasonal outlooks (March–May) are very similar to those for March, leaning toward warmer and wetter weather for most of the state.


Figure 9. Climate Prediction Center (left) temperature and (right) precipitation outlooks for March through May.

2022 Begins with a Dry and Cold January

The preliminary statewide average January temperature was 21.1 degrees, 5.6 degrees below the 1991–2020 average and the 27th coldest on record going back to 1895. The preliminary statewide average total January precipitation was 1.17 inches, 1.14 inches below the 1991–2020 average and the 25th driest on record.  

Data are provisional and may change slightly over time

Winter Temperatures Return

Following the second warmest December on record statewide, a return to winter-like temperatures was quite a shock to the system. Although temperatures last month were quite variable–typical of January–on average they were 3 to 8 degrees below normal.

Figure 1 shows daily temperature departures from normal at Chicago’s Midway Airport. Most January days in Chicago were colder than normal, some 15 to 20 degrees below normal in early and late January. Although last month’s temperatures were not nearly record breaking, it was the coldest January since 2014 in Chicago, Rockford, Moline, Peoria, Springfield, Quincy, and St. Louis.


Figure 1. Daily January average temperature departures at Chicago Midway.

January average temperatures ranged from the low teens in northern Illinois to the low 30s in southern Illinois, between 2 and 8 degrees below normal (Figure 2). High temperatures reached into the mid- to high 60s in southern Illinois last month, including 68 degrees in Pope County and 67 degrees in Alexander County. Meanwhile, nighttime low temperatures frequently dipped below zero in central and northern Illinois last month, including lows of -22 degrees in Kane County and -20 degrees in Jo Daviess and Carroll Counties.

Figure 2. Maps of (left) January average temperature and (right) January average temperature departures from normal.

The variable January temperatures broke 4 daily high maximum temperature records, 3 daily low maximum temperature records, and 2 daily low minimum temperature records. Overall, the preliminary statewide average January temperature was 21.1 degrees, 5.6 degrees below the 1991–2020 average and the 27th coldest on record going back to 1895.

Dry January Extends Snow Drought

The abnormally dry pattern that has affected most of the northern two-thirds of the state since November has persisted throughout January. Total January precipitation ranged from less than a tenth of an inch in central Illinois to over 5 inches in far southern Illinois (Figure 3). Most areas north of the Highway 13 corridor were 1 to 3 inches drier than normal, while the southern seven counties were 1 to 3 inches wetter than normal.


Figure 3. Maps show (left) total January precipitation and (right) January precipitation departure from normal.

January precipitation patterns were like those in November and December, continuing the north-south, dry-wet pattern over the past 90 days. Since November 1, areas outside of the south seven counties were 2 to 6 inches drier than normal. In fact, the period between November 1 and January 31 was the driest on record in Macomb since 1903.

Snowfall essentially requires two ingredients: (1) cold-enough temperatures to permit the snow to reach the ground and (2) enough moisture in the air to precipitate as snow. In November we had enough cold air in the region, but the air was too dry to amount to much snowfall. In December we generally had enough moisture in the air, but the persistently warm weather ensured most of the month’s precipitation was in liquid form. In January we went back to the dry, cold pattern, which resulted in below normal snowfall for most of the state.

January snowfall totals ranged from over 10 inches in parts of northern Illinois to less than half an inch in central and southern Illinois (Figure 4). Totals for the month were near to above normal in far western Illinois and the Chicagoland area, but were 1 to 8 inches below normal in central Illinois.

Figure 4. Maps show (left) total January snowfall and (right) January snowfall departure from normal.

The snow season was mild statewide through the end of January. Snowfall totals going back to the start of October are between 5 and 15 inches below normal, with the highest deficits in northern and east-central Illinois.

With the liquid water content of snow and rainfall taken together, the preliminary statewide average total January precipitation was 1.17 inches, 1.14 inches below the 1991–2020 average and the 25th driest on record.  

Outlooks

As I write this monthly summary on February 1, there is currently a winter storm warning for most of central Illinois and parts of northern Illinois. Forecasted snowfall totals range from 4-12 inches, with some areas in central Illinois expected to get more than a foot of snow before the end of the week. So, it’s likely our February summary will be very different from January’s, at least from a winter weather perspective.

Looking beyond the looming winter storm, the most recent February outlooks from the Climate Prediction Center show elevated odds of wetter than normal conditions statewide, with slightly higher odds of warmer than normal weather in southern Illinois (Figure 5).


Figure 5. Climate Prediction Center (left) temperature and (right) precipitation outlooks for February.

The three-month outlooks for February, March, and April together show a similar pattern of warmer and wetter than normal conditions to wrap up winter and begin climatological spring. These outlooks are still guided by La Niña conditions, but other indicators do point to a wetter three-month period than the last few months.


Figure 6. Climate Prediction Center (left) temperature and (right) precipitation outlooks for February, March, and April together.