The preliminary statewide average October temperature was 56.7 degrees, 1.9 degrees above the 1991–2020 average and tied for the 31st warmest on record going back to 1895. The preliminary statewide total October precipitation was 3.46 inches, 0.20 inches above the 1991–2020 average and the 41st wettest on record.
Data are provisional and may change slightly over time.
Mild October Temperatures with Some Extremes Thrown In
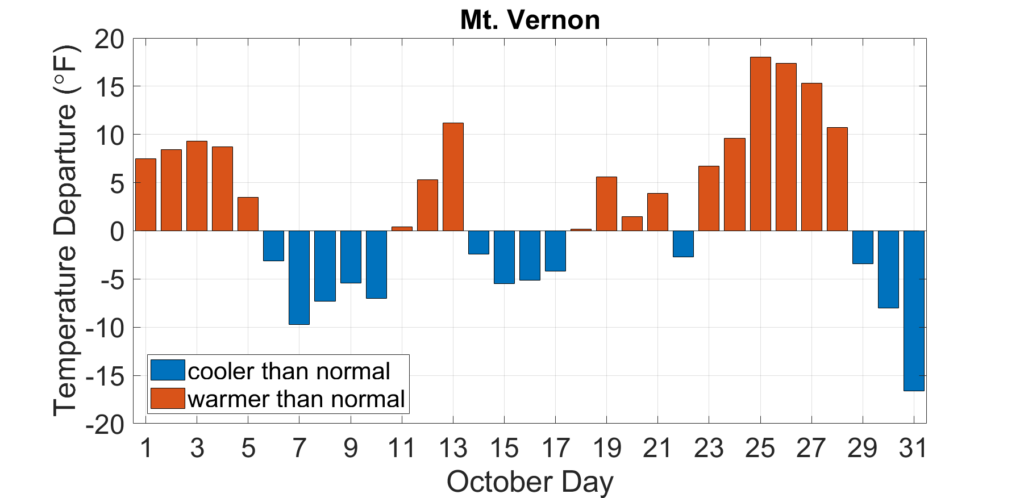
For my money, October is the best weather month of the year. The summer heat mellows out and mixes with the first real shots of chilly air. We had both summer- and winter-like weather last month, but a little more of the former than the latter. As the daily temperature departures from normal in Mt. Vernon show, most October days had above average temperatures, including a few days in the final week of the month that were 15 to 20 degrees above normal (Figure 1).
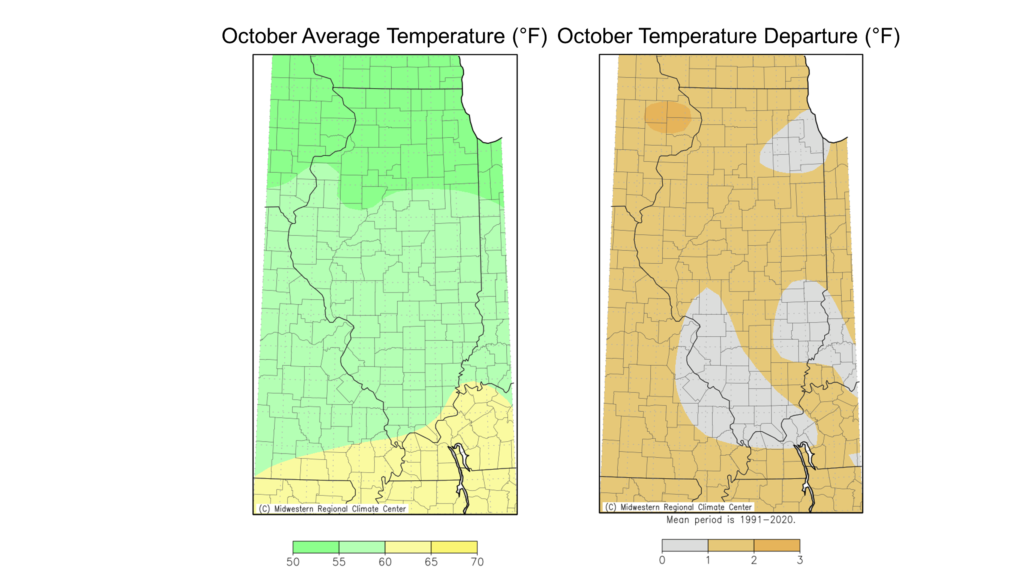
October average temperatures ranged from the low 50s in northern Illinois to the low 60s in southern Illinois, between 1 and 2 degrees above normal in most places (Figure 2). Most of the state saw high temperatures in the upper 80s or low 90s in early October, including 94 in Quincy and 90 in Hoopeston. The brief taste of winter in the last few days of the month brought widespread low temperatures in the low 20s, including 21 degrees in Mt. Vernon and 23 in Bloomington.
The warm periods last month broke 31 daily high maximum temperature records and an incredible 66 daily high minimum temperature records. Aledo in Mercer County broke its all-time October high temperature records last month with a high temperature of 93 degrees on October 3. The cold end to the month broke 18 daily low maximum temperature records and 37 daily low minimum temperature records.
Overall, the preliminary statewide average October temperature was 56.7 degrees, 1.9 degrees above the 1991–2020 average and tied for the 31st warmest on record going back to 1895.
Dry Start and Wet End to October
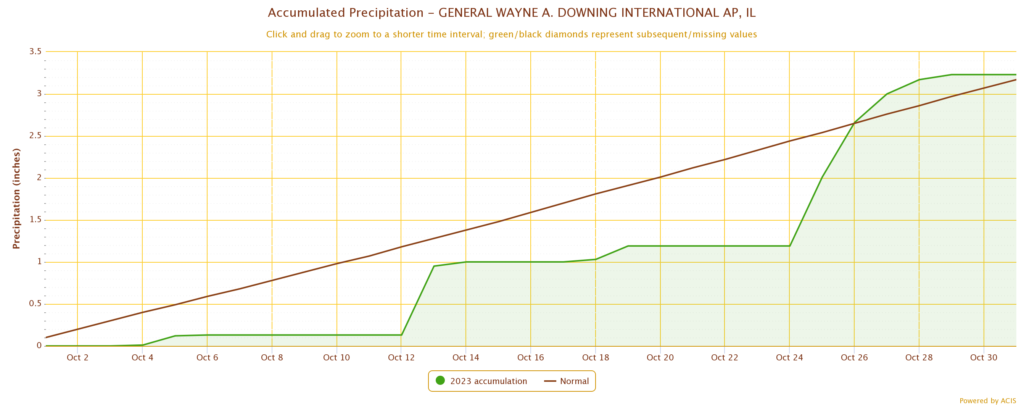
The month-end precipitation totals across the state do not tell the entire story of October precipitation. The first two-thirds of the month were somewhat to very dry across the state, as most places were 1 to 2 inches drier than normal through October 24. More active weather brought multiple rounds of rain–and some snow–to Illinois, raising month-end totals near or above the 30-year normals. As Figure 3 shows, Peoria picked up more rain in the last 7 days of October than in the first 24 days, and the month ended just slightly wetter than normal in Peoria. The dry start to the month was ideal for fall harvest, while the wetter end of the month helped improve dry conditions that prevailed in August and September.
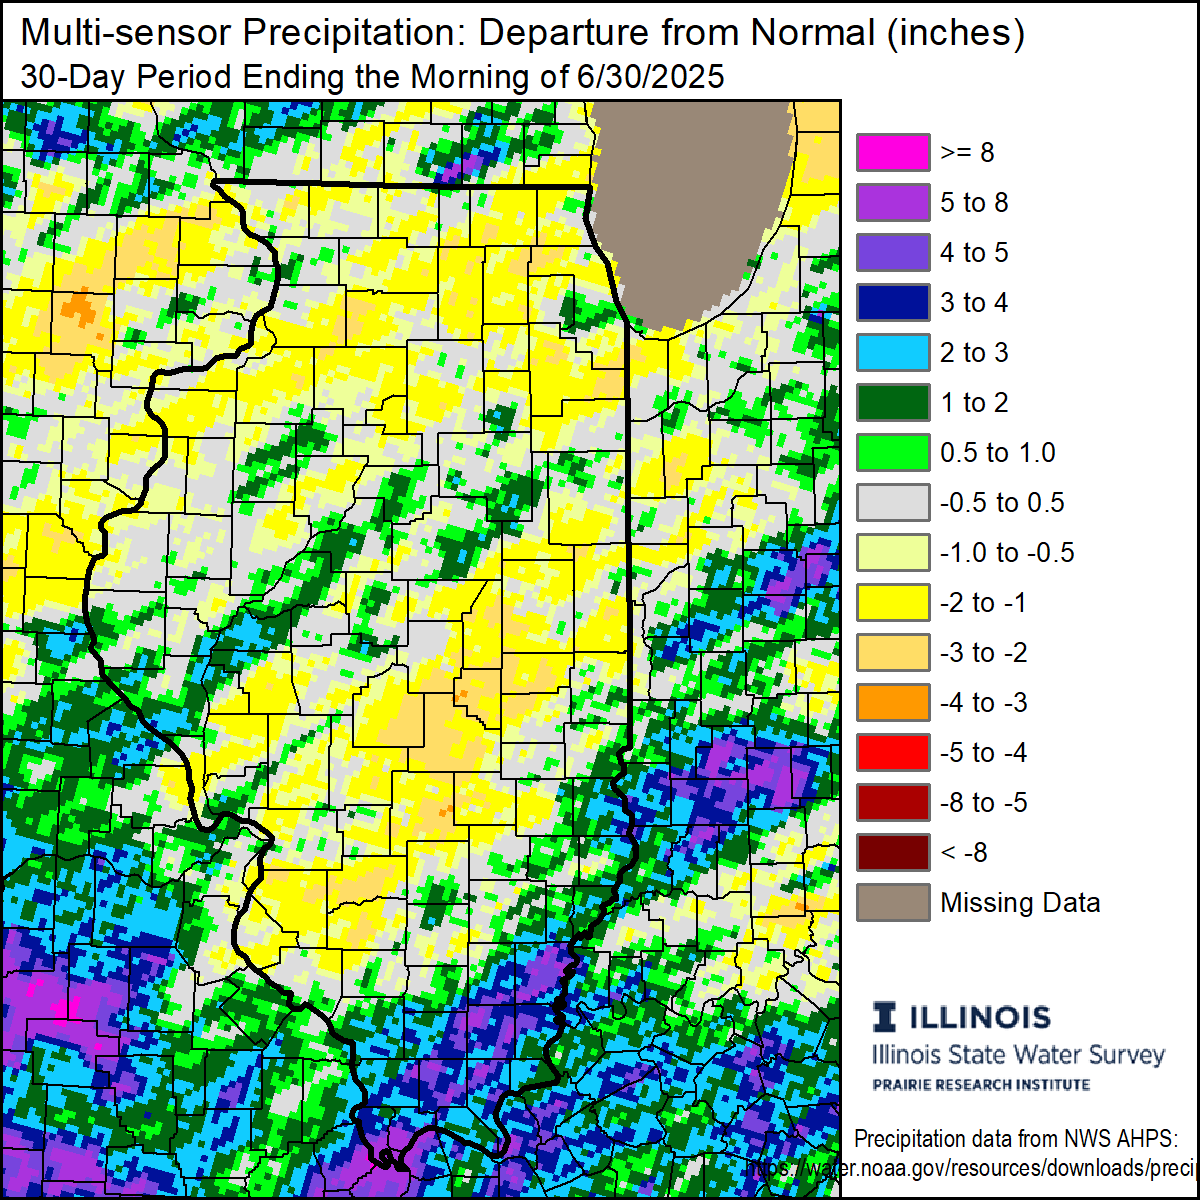
October precipitation ranged from nearly 6 inches in northeast Illinois to less than 2.5 inches in the St. Louis Metro East. Most of the state north of Interstate 70 was 1 to 2 inches wetter than normal, while areas farther south were just slightly drier, up to 2 inches drier than normal (Figure 4).
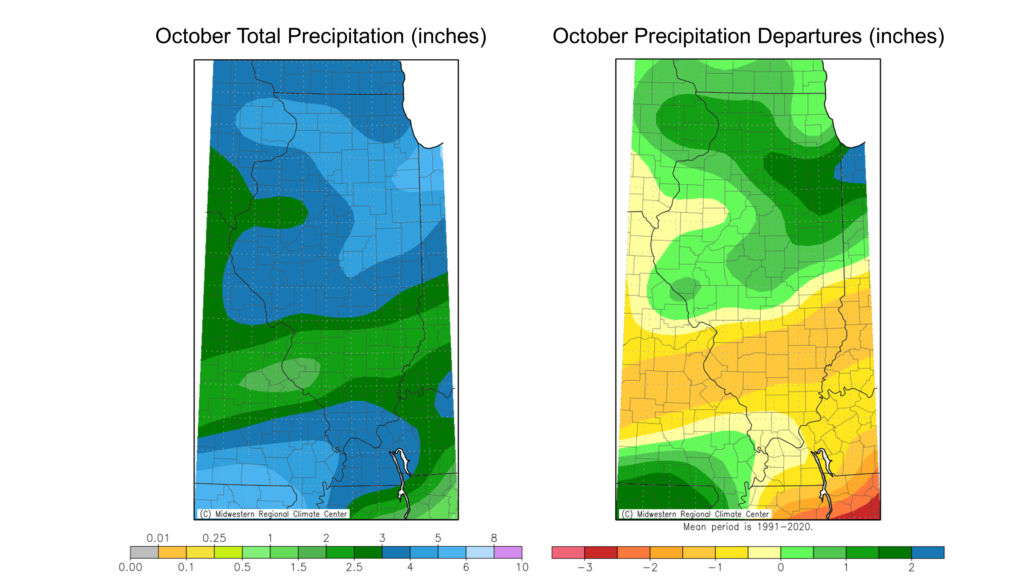
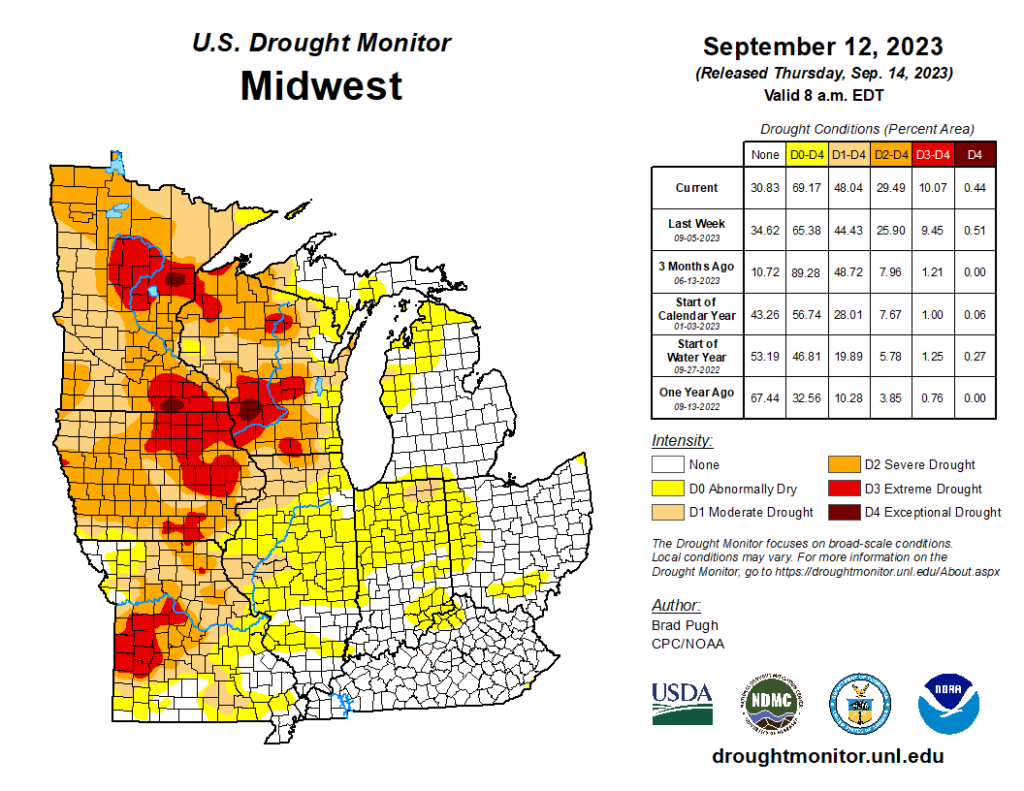
Last month wasn’t an extremely wet or extremely dry month anywhere in the state; however, the wetter conditions in the northern half of the state helped reduce drought extent from 23 percent of the state on October 3 to 7 percent on October 31. Small areas of western and southern Illinois remain in moderate drought due to longer-term precipitation deficits. For example, the first 10 months of the year have had the third lowest precipitation total in Quincy with 20.17 inches, around 10 inches below average. While topsoil moisture in western Illinois has improved from the wetter end of October, deeper layer moisture and water table levels remain less than ideal because of the long-term dryness.
Overall, the preliminary statewide total October precipitation was 3.46 inches, 0.20 inches above the 1991–2020 average and the 41st wettest on record.
A Spooky, Winter-y Halloween
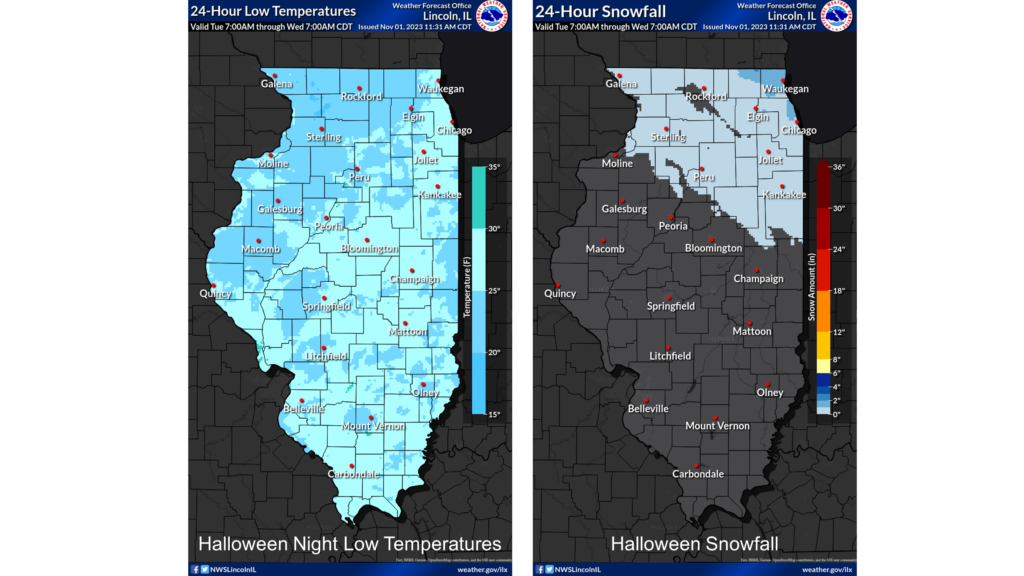
Like all the horror film characters who inevitably run back into the haunted house, mild October temperatures lulled all of us into a false sense of security. The intense cold, wind, and for some folks, snow on Halloween was more shocking than the sound of a revving chainsaw. Halloween nighttime temperatures dipped into the low 20s and high teens across much of the state, including 18-degree lows in Monmouth and Rochelle (Figure 5). The daytime high temperatures on Halloween were the coldest on record in several spots across the state, including at Chicago’s Midway airport (37 degrees) and Mt. Vernon (43 degrees). The low temperatures on Halloween night also set records in many places, including in Kankakee (24 degrees) and Olney (22 degrees). In fact, this year was the coldest Halloween in Olney since observations began there in 1896.
Halloween snow in northern and central Illinois is not necessarily a rarity but happens once every 4 to 6 years. Measurable snow, with totals exceeding 0.1 inches, was recorded in much of the state north of Interstate 74, with totals as high as 1.5 inches in Mundelein and 0.9 inches at O’Hare (Figure 5). For reference, the average first measurable snow comes in the third or fourth week of November for most of northern and central Illinois, so this year’s event came about two to three weeks early. It’s important to note that an early snowfall does not mean we will necessarily have a very snowy winter… but this State Climatologist can hope.
Outlooks
November doesn’t get the love it deserves, because it is so often associated with cloudy, blustery weather. But November typically gives us a great mix of pleasant and not-so-pleasant weather and portends the beautiful winter season in Illinois. The latest Climate Prediction Center outlooks lean into El Niño with higher chances of below normal November precipitation. November temperature outlooks are more mixed, with equal chances of warmer and colder weather this month (Figure 6).
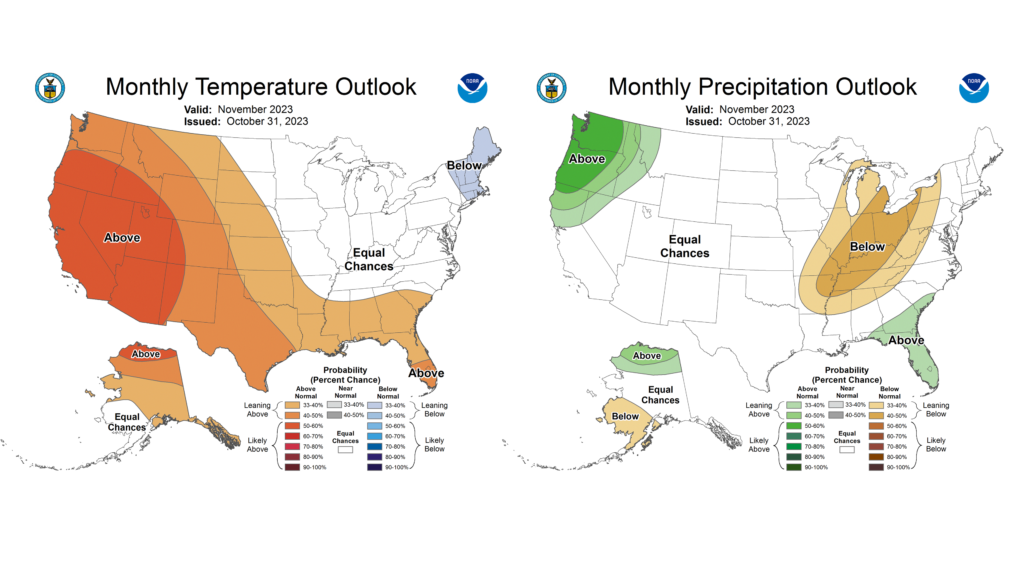
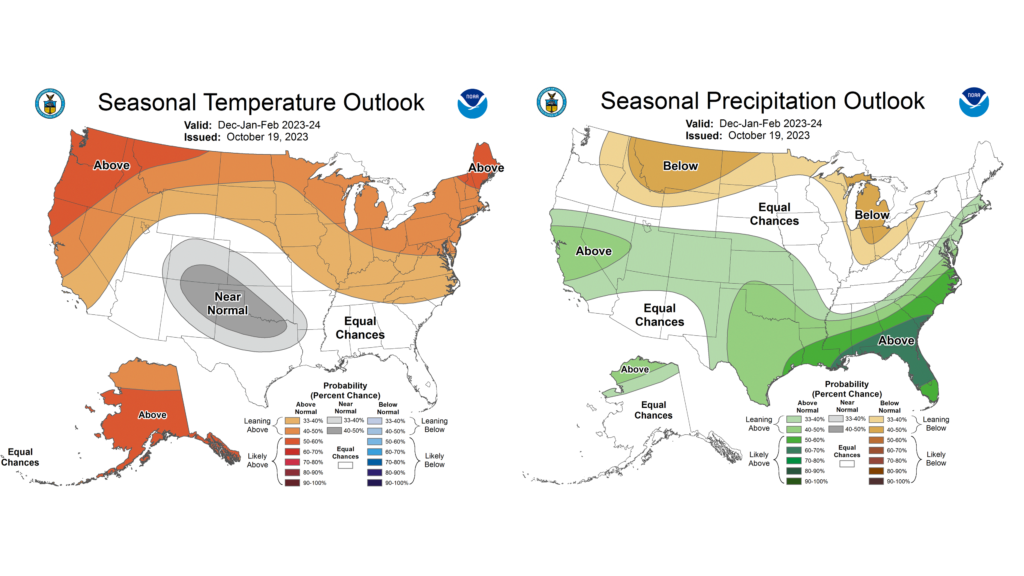
Meanwhile, NOAA leans even more heavily into El Niño for climatological winter (December–February) outlooks (Figure 7). The outlooks show highest chances of above normal temperatures in winter, with mostly equal chances of above or below normal precipitation.
