

The preliminary statewide average January temperature was 21.1 degrees, 5.6 degrees below the 1991–2020 average and the 27th coldest on record going back to 1895. The preliminary statewide average total January precipitation was 1.17 inches, 1.14 inches below the 1991–2020 average and the 25th driest on record.
Data are provisional and may change slightly over time
Winter Temperatures Return
Following the second warmest December on record statewide, a return to winter-like temperatures was quite a shock to the system. Although temperatures last month were quite variable–typical of January–on average they were 3 to 8 degrees below normal.
Figure 1 shows daily temperature departures from normal at Chicago’s Midway Airport. Most January days in Chicago were colder than normal, some 15 to 20 degrees below normal in early and late January. Although last month’s temperatures were not nearly record breaking, it was the coldest January since 2014 in Chicago, Rockford, Moline, Peoria, Springfield, Quincy, and St. Louis.
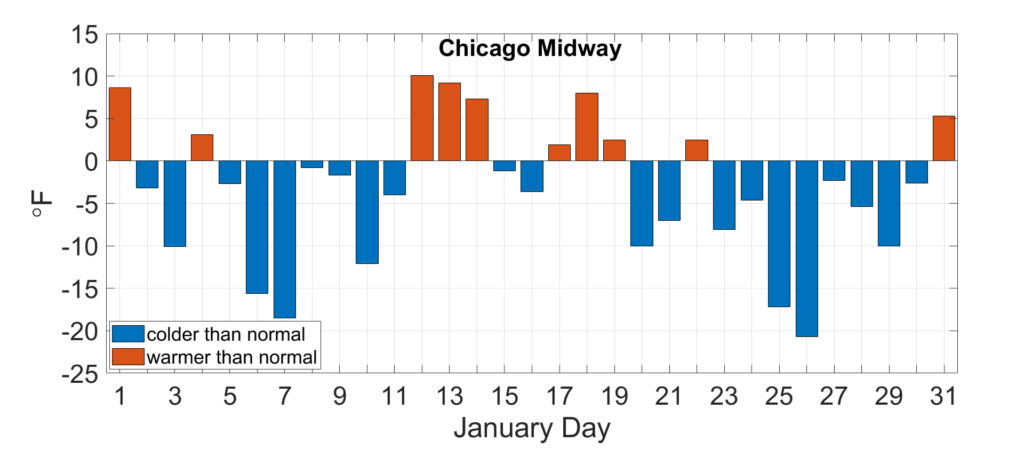
Figure 1. Daily January average temperature departures at Chicago Midway.
January average temperatures ranged from the low teens in northern Illinois to the low 30s in southern Illinois, between 2 and 8 degrees below normal (Figure 2). High temperatures reached into the mid- to high 60s in southern Illinois last month, including 68 degrees in Pope County and 67 degrees in Alexander County. Meanwhile, nighttime low temperatures frequently dipped below zero in central and northern Illinois last month, including lows of -22 degrees in Kane County and -20 degrees in Jo Daviess and Carroll Counties.
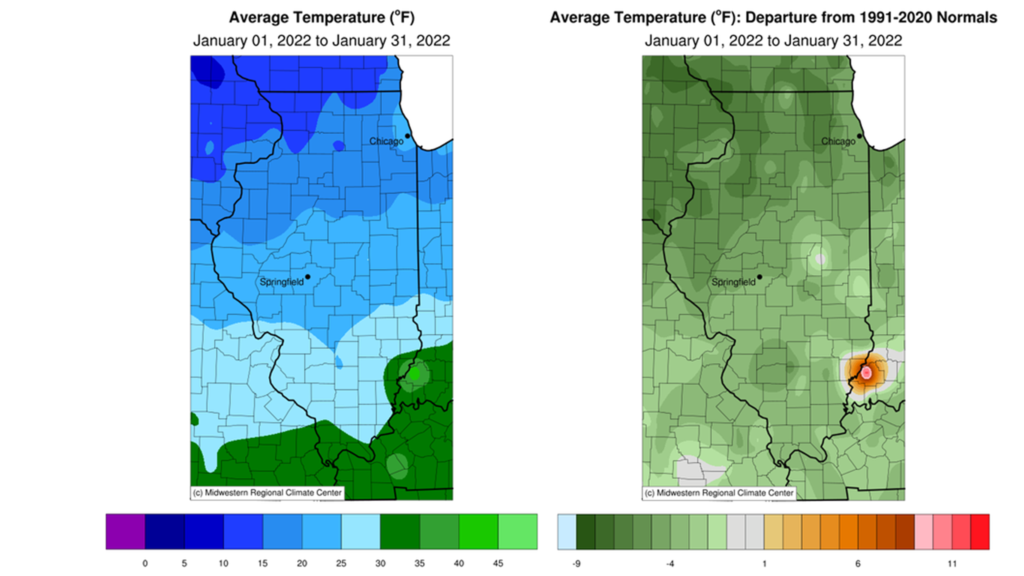
The variable January temperatures broke 4 daily high maximum temperature records, 3 daily low maximum temperature records, and 2 daily low minimum temperature records. Overall, the preliminary statewide average January temperature was 21.1 degrees, 5.6 degrees below the 1991–2020 average and the 27th coldest on record going back to 1895.
Dry January Extends Snow Drought
The abnormally dry pattern that has affected most of the northern two-thirds of the state since November has persisted throughout January. Total January precipitation ranged from less than a tenth of an inch in central Illinois to over 5 inches in far southern Illinois (Figure 3). Most areas north of the Highway 13 corridor were 1 to 3 inches drier than normal, while the southern seven counties were 1 to 3 inches wetter than normal.
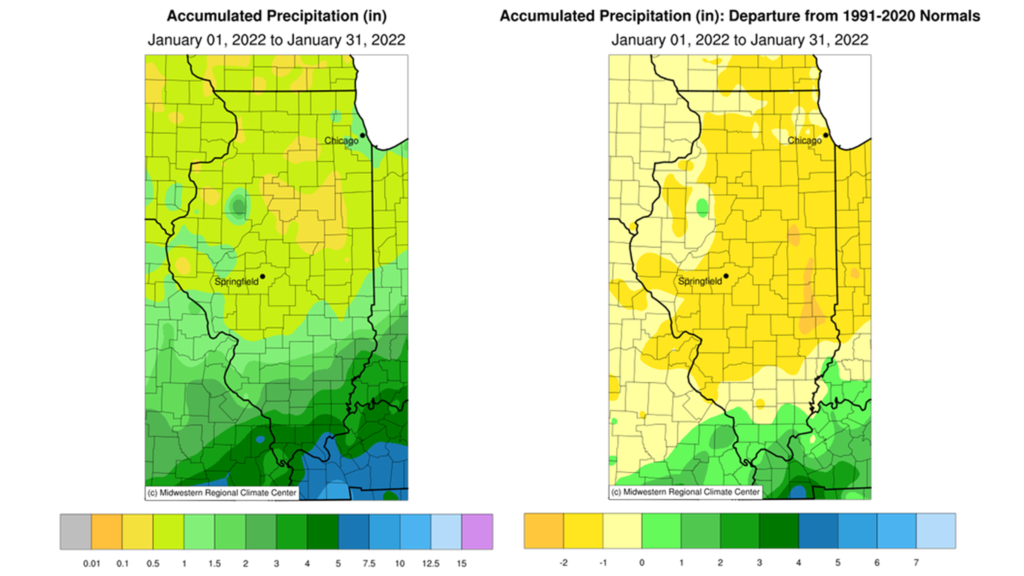
Figure 3. Maps show (left) total January precipitation and (right) January precipitation departure from normal.
January precipitation patterns were like those in November and December, continuing the north-south, dry-wet pattern over the past 90 days. Since November 1, areas outside of the south seven counties were 2 to 6 inches drier than normal. In fact, the period between November 1 and January 31 was the driest on record in Macomb since 1903.
Snowfall essentially requires two ingredients: (1) cold-enough temperatures to permit the snow to reach the ground and (2) enough moisture in the air to precipitate as snow. In November we had enough cold air in the region, but the air was too dry to amount to much snowfall. In December we generally had enough moisture in the air, but the persistently warm weather ensured most of the month’s precipitation was in liquid form. In January we went back to the dry, cold pattern, which resulted in below normal snowfall for most of the state.
January snowfall totals ranged from over 10 inches in parts of northern Illinois to less than half an inch in central and southern Illinois (Figure 4). Totals for the month were near to above normal in far western Illinois and the Chicagoland area, but were 1 to 8 inches below normal in central Illinois.
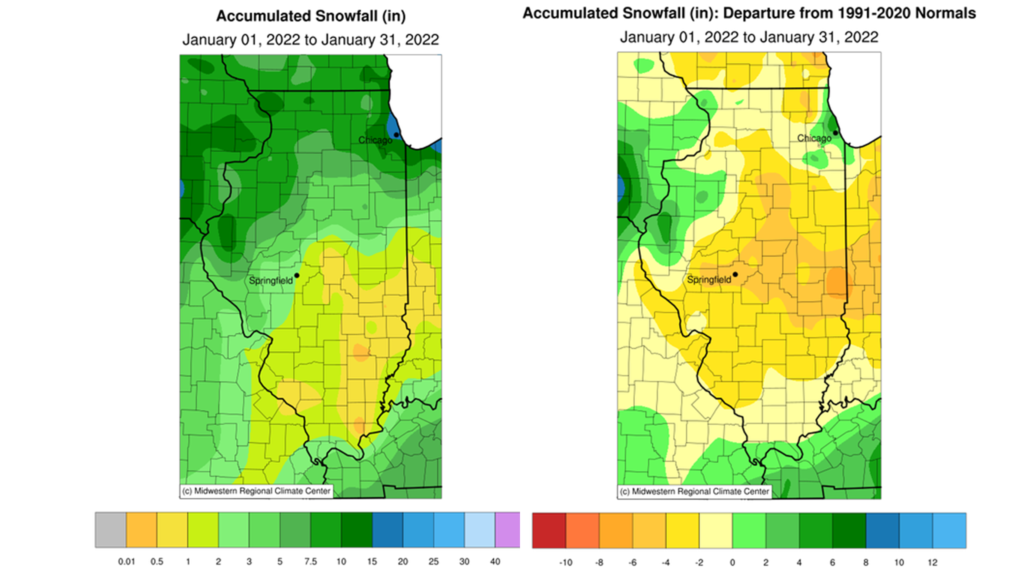
The snow season was mild statewide through the end of January. Snowfall totals going back to the start of October are between 5 and 15 inches below normal, with the highest deficits in northern and east-central Illinois.
With the liquid water content of snow and rainfall taken together, the preliminary statewide average total January precipitation was 1.17 inches, 1.14 inches below the 1991–2020 average and the 25th driest on record.
Outlooks
As I write this monthly summary on February 1, there is currently a winter storm warning for most of central Illinois and parts of northern Illinois. Forecasted snowfall totals range from 4-12 inches, with some areas in central Illinois expected to get more than a foot of snow before the end of the week. So, it’s likely our February summary will be very different from January’s, at least from a winter weather perspective.
Looking beyond the looming winter storm, the most recent February outlooks from the Climate Prediction Center show elevated odds of wetter than normal conditions statewide, with slightly higher odds of warmer than normal weather in southern Illinois (Figure 5).

Figure 5. Climate Prediction Center (left) temperature and (right) precipitation outlooks for February.
The three-month outlooks for February, March, and April together show a similar pattern of warmer and wetter than normal conditions to wrap up winter and begin climatological spring. These outlooks are still guided by La Niña conditions, but other indicators do point to a wetter three-month period than the last few months.

Figure 6. Climate Prediction Center (left) temperature and (right) precipitation outlooks for February, March, and April together.