Dry and Mild February Ends an Otherwise Cold Winter

The preliminary statewide average February temperature was 33.8 degrees, 2.8 degrees above the 1991–2020 normal, 4.6 degrees above the 20th Century average, 2.8 degrees above the most recent 30-year average, and it tied for 29th warmest February on record going back to 1895.

The preliminary statewide average total February precipitation was 0.54 inches, 1.57 inches below the 1991–2020 normal, 1.32 inches below the 20th Century average, 1.65 inches below the most recent 30-year average, and the 5th driest February on record statewide.    

Data are provisional and may change slightly over time

Mild February Temperatures with Some Cold Breaks

Most perceive February weather as consistently cold and dreary. But February often brings some of the largest day-to-day temperature swings in Illinois. Figure 1 shows daily temperature departures from normal in Pana last month. The first week of February was mainly 5 to 15 degrees cooler than normal, followed by a prolonged period of temperatures that were 5 to 25 degrees warmer than normal.

Daily average temperatures and departures from normal in Pana, Illinois.
Figure 1. Daily February average temperatures and departures in Pana.

February average temperatures ranged from the low 40s in southern Illinois to the high 20s in northern Illinois, between 1 and 7 degrees above the 1991-2020 normal (Figure 2). During the peak of extreme cold in early February, many stations across Illinois recorded nighttime low temperatures well below 0, including -8 degrees in Paris and -2 in Aurora. Meanwhile, the milder weather in mid-February brought some impressive daytime highs including 77 degrees in Cahokia Heights and 72 in Moline. The coldest place in the state last month was Stockton in Jo Daviess County with an average February temperature of 28.5 degrees, and the warmest place in the state was Crab Orchard in Williamson County with an average temperature of 41.5 degrees.

The milder weather last month broke 76 daily high maximum temperature records and 31 daily high minimum temperature records. Meanwhile, the extreme cold in early February and the third week of the month broke 2 daily low maximum temperature records and 1 daily low minimum temperature record.

Maps of February average temperature and February average temperature departures from normal.
Figure 2. Maps of (left) February average temperature and (right) February average temperature departures from normal.

Overall, the preliminary statewide average February temperature was 33.8 degrees, 2.8 degrees above the 1991–2020 normal, 4.6 degrees above the 20th Century average, 2.8 degrees above the most recent 30-year average, and it tied for 29th warmest February on record going back to 1895.

Cold Start, Mild End to Winter

Climatological winter runs from December through February and is the coldest season of the year in Illinois. Midwest winters have warmed at a much faster rate than the other three seasons over the past 100+ years because of human-caused climate change. Consequently, many of the past decade’s winter seasons have been very mild. The 2025-26 winter somewhat bucked that trend in December and certainly in January, when temperatures were 1 to 4 degrees below the 1991-2020 normals. , with December temperatures that were 1 to 6 degrees warmer than normal. However, the mild weather in mid-February pushed the meteorological winter average temperatures a bit closer to the 1991-2020 normals (Figure 3). In fact, much of the western third of the state ended winter with slightly warmer than normal temperatures.   

Overall, the preliminary statewide average winter temperature was 28.8 degrees, 0.9 degrees below the 1991–2020 normal, 0.8 degrees above the 20th Century average, and 1.2 degrees below the most recent 30-year average. If confirmed, last season would be tied for 63rd warmest winter on record in Illinois.

Maps of average temperature departures from the 1991-2020 normals for December, January, February, and meteorological winter.
Figure 3. Maps of average temperature departures from the 1991-2020 normals for December, January, February, and meteorological winter.

Extremely Dry February Worsens Drought

February is normally one of the driest months of the year, but even among typically drier conditions last month was extreme. Total February precipitation ranged from less than a quarter of an inch in much of northern Illinois to just over 3 inches in isolated parts of south-central Illinois. The state was 1 to 4 inches drier than normal last month (Figure 4).

February total precipitation and February precipitation departure from normal.
Figure 4. February total precipitation (left) and February precipitation departure from normal (right).

Last month was the driest February on record in Moline (Trace), the second driest on record in Rockford (0.12”), the third driest on record in Chicago (0.16”), the third driest on record in Springfield (0.45”), the second driest on record in Champaign-Urbana (0.18”), the third driest on record in Carbondale (0.51”), and the second driest on record in Mt. Vernon (0.08”).

Not only was last month the driest February on record in Moline, but it was the only month (of any calendar month) on record there to not record any measurable precipitation. Records in Moline go back to 1872, meaning February 2026 was the driest month in the Quad Cities in the last 154 years, or – put another way – the driest month since at least the Ulysses S. Grant administration.

Although December and January were not as extremely dry as February, they were not remarkably wet either. The preliminary statewide total meteorological winter precipitation in Illinois was 3.24 inches, which is 3.73 inches below the 1991-2020 normal, 3.07 inches below the 20th Century average, and 3.75 inches below the most recent 30-year average. If confirmed, the 2025-26 winter season would be the fifth driest on record in Illinois, and the driest since 1976-77. The winter was the 7th driest on record in Springfield, the 5th driest on record in Champaign-Urbana, the 8th driest on record in Quincy, and the driest on record in Carbondale.

Flipped Snow Pattern in Illinois

I am contractually obligated to remind everyone that Illinois often – if not normally – gets some measurable snowfall in March, and occasionally in April. So, the “snowfall season” is not yet complete; however, meteorological winter (December – February) almost always contain most of the snowfall in the state. December brought an active winter stormtrack through central Illinois and produced above average snowfall for the northern half of the state, particularly along the Interstate 72 corridor between Quincy and Danville. January was exceptionally snowy in southern Illinois; however, much of northern Illinois experienced a snow drought. February united the entire state with a substantial lack of snow, and the 2025-26 meteorological winter overall was much snowier than normal in southern and parts of central Illinois, and it was a disappointing snow winter in northern Illinois (Figure 5).

Maps show snowfall departures from the 1991-2020 normals in December, January, February, and meteorological winter.
Figure 5. Maps show snowfall departures from the 1991-2020 normals in December, January, February, and meteorological winter.

March & Spring Outlooks

After a nearly record dry winter, we need rain in a bad way! Fortunately, March begins meteorological spring, which is typically one of the wettest seasons across Illinois. And even better news: the most recent Climate Prediction Center outlooks show good chances of wetter than normal weather in March (Figure 6). Models are also bullish for a milder start to spring with above average temperatures this month.

Climate Prediction Center temperature and precipitation outlooks for March.
Figure 6. Climate Prediction Center (left) temperature and (right) precipitation outlooks for March.

The spring season outlooks (March–May) also show higher chances of above normal precipitation, which is also good news. Meanwhile, there is not much of a temperature signal, with equal chances of a warmer and cooler than normal spring (Figure 7).  

Climate Prediction Center temperature and precipitation outlooks for March through May.
Figure 7. Climate Prediction Center (left) temperature and (right) precipitation outlooks for March through May.

January Brought Winter Weather of Yore

The preliminary statewide average January temperature was 22.3 degrees, 4.4 degrees below the 1991-2020 average and tied for the 34th coldest on record going back to 1895. The preliminary statewide average total January precipitation was 1.25 inches, 1.06 inches below the 1991-2020 average and tied for the 32nd driest on record statewide.

Data are provisional and may change slightly over time.

Is this what winter used to be? 

All four of Illinois’ distinct seasons are getting warmer thanks to human-caused climate change; however, winter is warming far faster than the other seasons. As a result, we have experienced many more mild winters in recent decades; and this trend made last month’s persistently cold weather seem particularly extreme. Daily temperatures and departures from normal in Quincy show much of the first and third weeks of the month had temperatures that were consistently 5 to 30 degrees below normal (Figure 1).

Figure 1. Daily January average temperature departures in Quincy.

January average temperatures ranged from the high teens in northwest Illinois to the low 30s in southern Illinois, between 2 and 8 degrees below normal. Persistent snowpack in southern Illinois helped depress temperatures farther below normal than in relatively snow-less northern Illinois (Figure 2). The warmest point in the state last month was Du Quoin at 31.7 degrees, and the coldest point in the state was Stockton at 16.9 degrees. The few warm spells in January broke 10 daily high maximum temperature records. The extreme cold in the middle of the month broke 23 daily low maximum temperature records and 15 daily low minimum temperature records, including -20 degrees in Springfield.

Figure 2. Maps of (left) January average temperature and (right) January average temperature departures from normal.

Overall, the preliminary statewide average January temperature was 22.3 degrees, 4.4 degrees below the 1991-2020 average and tied for the 34th coldest on record going back to 1895.

Snowy Southern Illinois

Depending on who you talk to, January 2025 was either a very active winter weather month or quite a boring one. An active storm track setup across the southern half of the state in the first week of January, pushing multiple winter storms through the state, which produced multiple rounds of heavy snow mostly along and south of Interstate 70. The result was a strong gradient of snowfall opposite of what is typical for this time of the year, with more in southern Illinois than northern Illinois.

January total snowfall ranged from over 12 inches in south-central Illinois to less than 1 inch in northwest Illinois. Much of the southern half of the state had 1 to 8 inches more snowfall than normal in January, while northern Illinois racked up a 1-to-8-inch snowfall deficit (Figure 3). Last month was the fifth snowiest January on record in Fairfield with 15.6 inches and the snowiest since 1996. Meanwhile, Moline had only 2.3 inches of snow in January, the lowest amount since 2018 and fourth lowest there since 1989.

Figure 3. Maps of (left) January total snowfall and (right) January snowfall departures from normal

Other than a couple of noteworthy snow and ice events, January was otherwise mostly dry across Illinois. Total January precipitation ranged from just over 5 inches in far southern Illinois to less than a quarter of an inch in far northwest Illinois. Most of northern and central parts of the state were around 1 to 2 inches drier than normal last month and only the southern seven counties were wetter than normal (Figure 4).

Overall, the preliminary statewide average total January precipitation was 1.25 inches, 1.06 inches below the 1991-2020 average and tied for the 32nd driest on record statewide.

Figure 4. Maps show (left) January total precipitation and (right) precipitation departure from normal across Illinois.

Outlooks

The Climate Prediction Center outlooks, reflecting model tendencies and expert assessments, continue to lean into La Niña influence on our late winter and early spring weather across the U.S. Here in Illinois, the expectation is for near normal temperatures and above normal precipitation for both the last winter month of February and the first two months of spring (Figure 5).

Figure 5. Maps show (left) temperature and (right) precipitation outlooks for the month of February and February through April.  

2024 Weather Was Very Warm and Wild

Illinois was both warmer and wetter than the 1991–2020 normal in 2024. The statewide average annual temperature was 55.5 degrees, 2.9 degrees above normal and 2nd warmest on record statewide. Statewide average total precipitation in 2024 was 40.69 inches, 0.05 inches above normal and the 43rd wettest year on record.

The Second Warmest Year on Record

The past year was very warm in Illinois, but the largest temperature departures from normal were outside of the climatologically warmest time of the year. February, March, and November were all at least 4 degrees warmer than normal, while July and August were near to slightly cooler than normal statewide (Figure 1).  

Figure 1. Plot shows 2023 statewide monthly average temperature (black line) and temperature departures from the 1991–2020 normal (red and blue bars).

Average temperatures in Illinois last year ranged from the low 50s in northern Illinois to the low 60s in southern Illinois, between 1 and 6 degrees above normal (Figure 2). The year 2024 was the warmest year on record in Chicago, Peoria, St. Louis, and Paducah, and it was a top 5 warmest year on record in the Quad Cities, Champaign-Urbana, Quincy, and Carbondale, among other places. The warmest point in the state last year was Dixon Springs in Pope County with an average temperature of 60.2 degrees. The coolest point in the state was Stockton in Jo Daviess County with an average temperature of 50.2 degrees.

Figure 2. Maps show 2024 annual average temperature (left) and average temperature departures from the 1991–2020 normal (right).

Last year was the warmest on record in Chicago, which stretches back to the 1870s. The weather station of record for the city of Chicago is currently at O’Hare airport; however, the station’s location has changed multiple times since the 1870s. For the first half of the record, the station was much closer to Lake Michigan, including in the Roanoke Building between 1873 and 1887 and Rosenwald Hall at the University of Chicago between 1926 and 1942. The Chicago National Weather Service office has a complete weather history for Chicago and Rockford: https://www.weather.gov/lot/observation_history.

Despite the likely moderating effect of the lake on temperatures in the early part of Chicago’s record, 2024 was still the warmest year since Ulysses Grant was president. Figure 3 shows the record of annual average temperature in Chicago, illustrating a long-term warming trend the city has experienced over the past 150 years.

Figure 3. Plot shows the annual average temperature in Chicago from 1873 to 2024.

Table 1 shows the number of daily weather records broken at Illinois Cooperative Observer stations in each month of 2024.

Our very mild February led with the highest number of daily high maximum temperature records, with 222 statewide. Meanwhile, the final three months of the year led with the most high minimum temperature records with 101, 67, and 64, respectively. The fleeting but intense cold air outbreak in mid-January in 2024 broke 73 low maximum temperature records and 28 low minimum temperature records. Multiple months had at least 100 daily high precipitation records broken last month, including January, April, July, and November.

Table 1. Table shows the number of daily local weather records in 2023 by month and variable.

2024 Precipitation

Calendar year 2024 had quite variable precipitation, with five months of wetter than normal conditions (January, April, July, November, December) and seven months that were drier than normal (Figure 4).

Figure 4. 2024 monthly total precipitation as a departure from the 1991–2020 normal.

Illinois experienced the 2nd driest February on record statewide, with only 0.48 inches of statewide average February precipitation, about 1.5 inches below normal. A wetter than normal April and May helped refill soils ahead of the growing season, but also delayed crop planting and critical fieldwork in many parts of the state.

July brought multiple rounds of heavy rain to the state, including events that caused widespread damaging flooding in the St. Louis Metro East area: https://storymaps.arcgis.com/stories/df7ac819701a445399d7fe87328b4f77, and the Rockford area: https://www.weather.gov/lot/2024_07_13-14_Flooding. Nashville, Illinois experienced over 6 inches of rain in less than 8 hours on July 16th, forcing overflow of a local reservoir and flooding of several homes.  

For the third consecutive year Illinois fell back into drought in the fall as the months of September and October were 1 to 3 inches drier than normal across the state. Total precipitation in September and October statewide was only 3.48 inches, about 60% of normal and the 12th driest 2-month period on record. Once again, the region’s largest rivers approached low stage, including along the Illinois, Mississippi, and Ohio Rivers, causing some moderate challenges to shipping. November and December were both wetter than normal to end the year.

Figure 5 shows the spatial variability of 2024 precipitation in more detail. Total precipitation last year ranged from over 60 inches in far southern Illinois and the St. Louis Metro East area to less than 35 inches in parts of northern and north-central Illinois. Areas along the Wisconsin and Iowa borders were 2 to 6 inches wetter than normal last year, and areas around St. Louis and along the Interstate 70 corridor were 6 to 12 inches wetter than normal.

Figure 5. Maps show (left) total precipitation and (right) precipitation departures in 2024.

A CoCoRaHS citizen science observer in Metropolis in Massac County had 62.92 inches of precipitation in 2024, making the birth of Superman the wettest point in the state. Meanwhile, another CoCoRaHS observer in El Paso in Woodford County had only 28.22 inches of precipitation in 2024.

Overall, statewide average total precipitation in 2024 was 40.69 inches, 0.05 inches above normal and the 43rd wettest year on record.

2024 Severe Weather

Severe weather came early and often in 2024, with all of our 102 counties affected by strong wind, hail, tornadoes, or heavy rain (Figure 6). Overall, the NOAA Storm Prediction Center reported a preliminary 142 tornadoes in Illinois in 2024, which  would set a new annual tornado record, breaking the 124 event record in 2006, and follows the very active tornado year of 2023 with 121 tornadoes. Figure 6 shows the monthly frequency of tornadoes in 2024 compared to the 1994-2023 average frequency. February through May had above average tornado frequency, and then came a record-breaking July. The 7th month of the year ended with 45 tornadoes in the state, including a massive tornado outbreak in the Chicagoland area on July 15th. In total, the derecho on that evening brought 32 confirmed tornadoes, including several that made it into the Chicago city limits: https://www.weather.gov/lot/2024_07_15_Derecho.  

Only one tornado was reported in the last four months of the year. It is likely the 2024 tornado total will be adjusted, but irrespective of changes, 2024 was an extremely active tornado year and very likely the most active tornado year on record in Illinois

Figure 6. Plot shows tornado frequency by month in 2024 (blue bars) compared to the 1994-2023 average (red bars).

The NOAA Storm Prediction Center also had 216 severe hail reports and 716 severe wind reports in Illinois in 2024. Many of the wind reports came from a strong derecho that moved through the state on June 29. Over one-third of all severe wind reports came on July 15th, including 100+ mph wind reports in Marshall County and Ogle County.

2024 Snowfall

Snow was hard to come by in 2024. Figure 7 shows snowfall departures from normal between January and May, September and December, and for the 2024 year as a whole. Most places in the state had between 5 and 20 inches below normal snowfall last year. Overall, the statewide average total snowfall was just under 12 inches in 2024, below the long term average of 19 inches (Figure 7).

Figure 7. Maps of snowfall departures from normal across Illinois and a plot of statewide average total snowfall in Illinois between 1904 and 2024. The maps show departures from (left) January through May, (middle) September through December, and (right) the entire year of 2024.

Mild October Had a Chilly End

The preliminary statewide average October temperature was 56.7 degrees, 1.9 degrees above the 1991–2020 average and tied for the 31st warmest on record going back to 1895. The preliminary statewide total October precipitation was 3.46 inches, 0.20 inches above the 1991–2020 average and the 41st wettest on record.

Data are provisional and may change slightly over time.

Mild October Temperatures with Some Extremes Thrown In

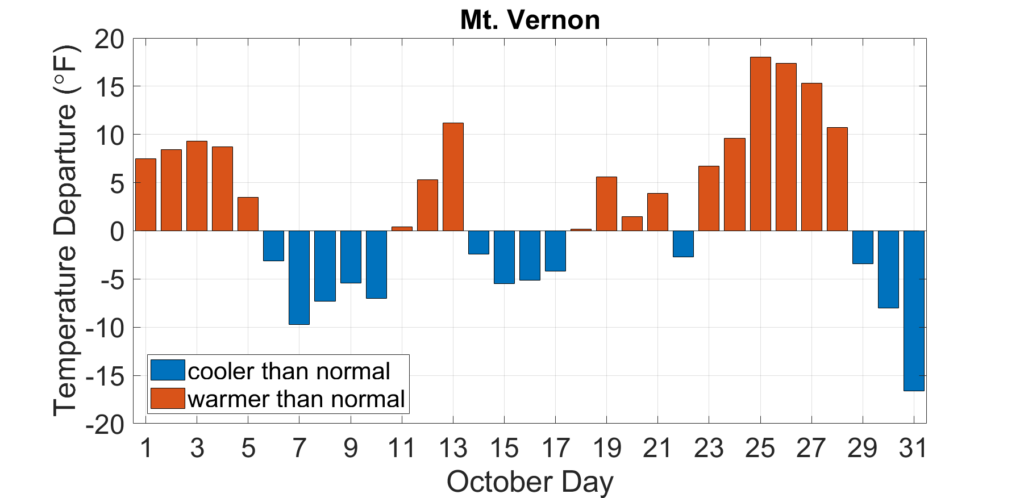
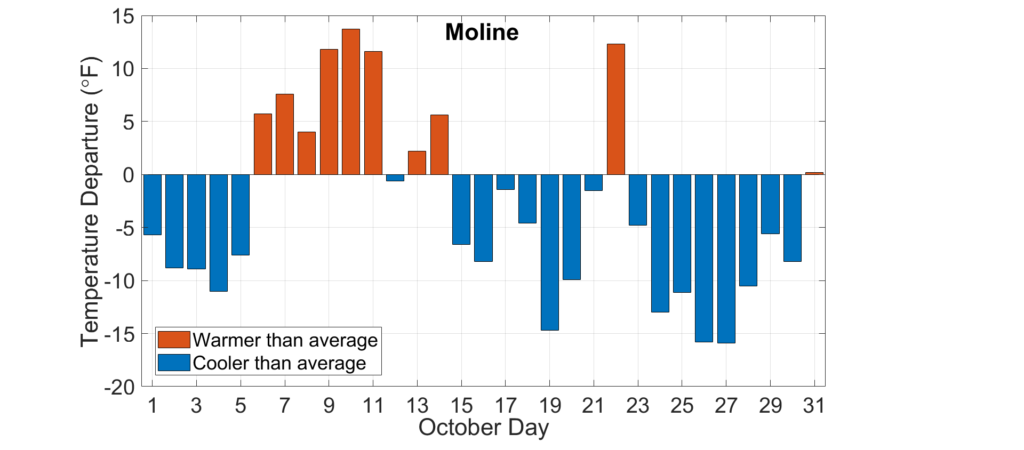
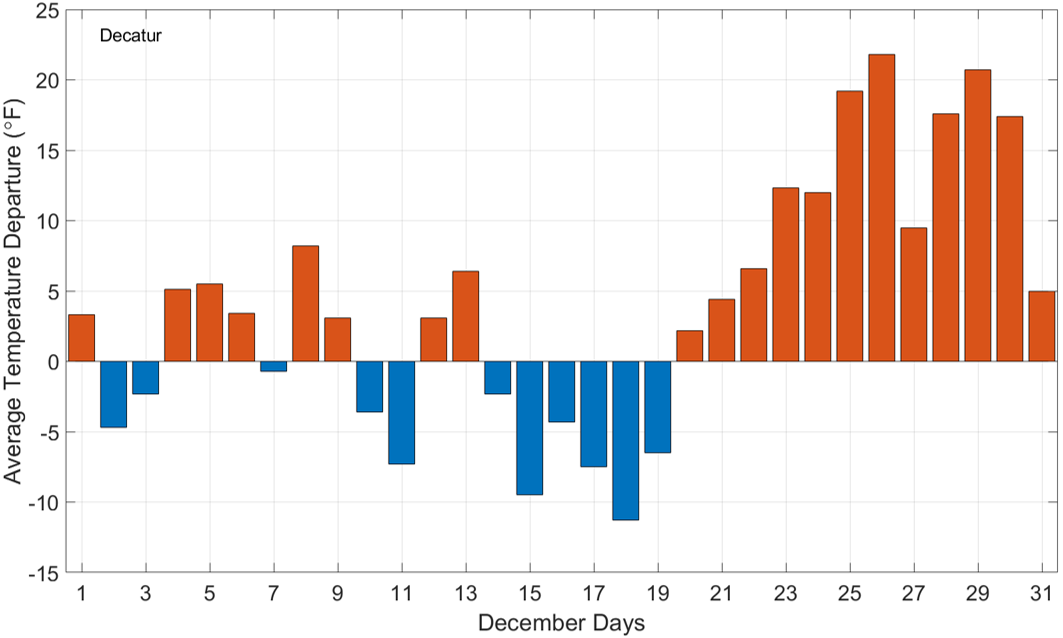
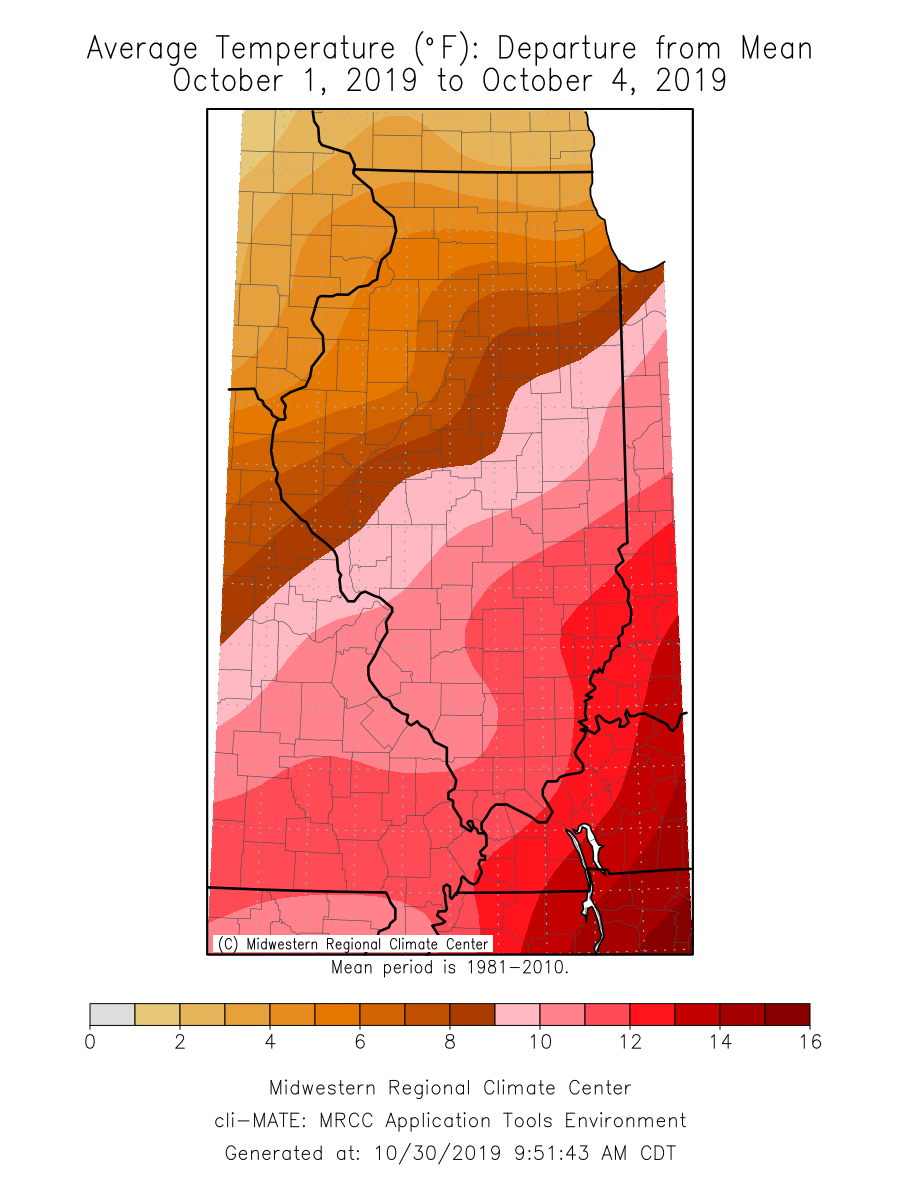
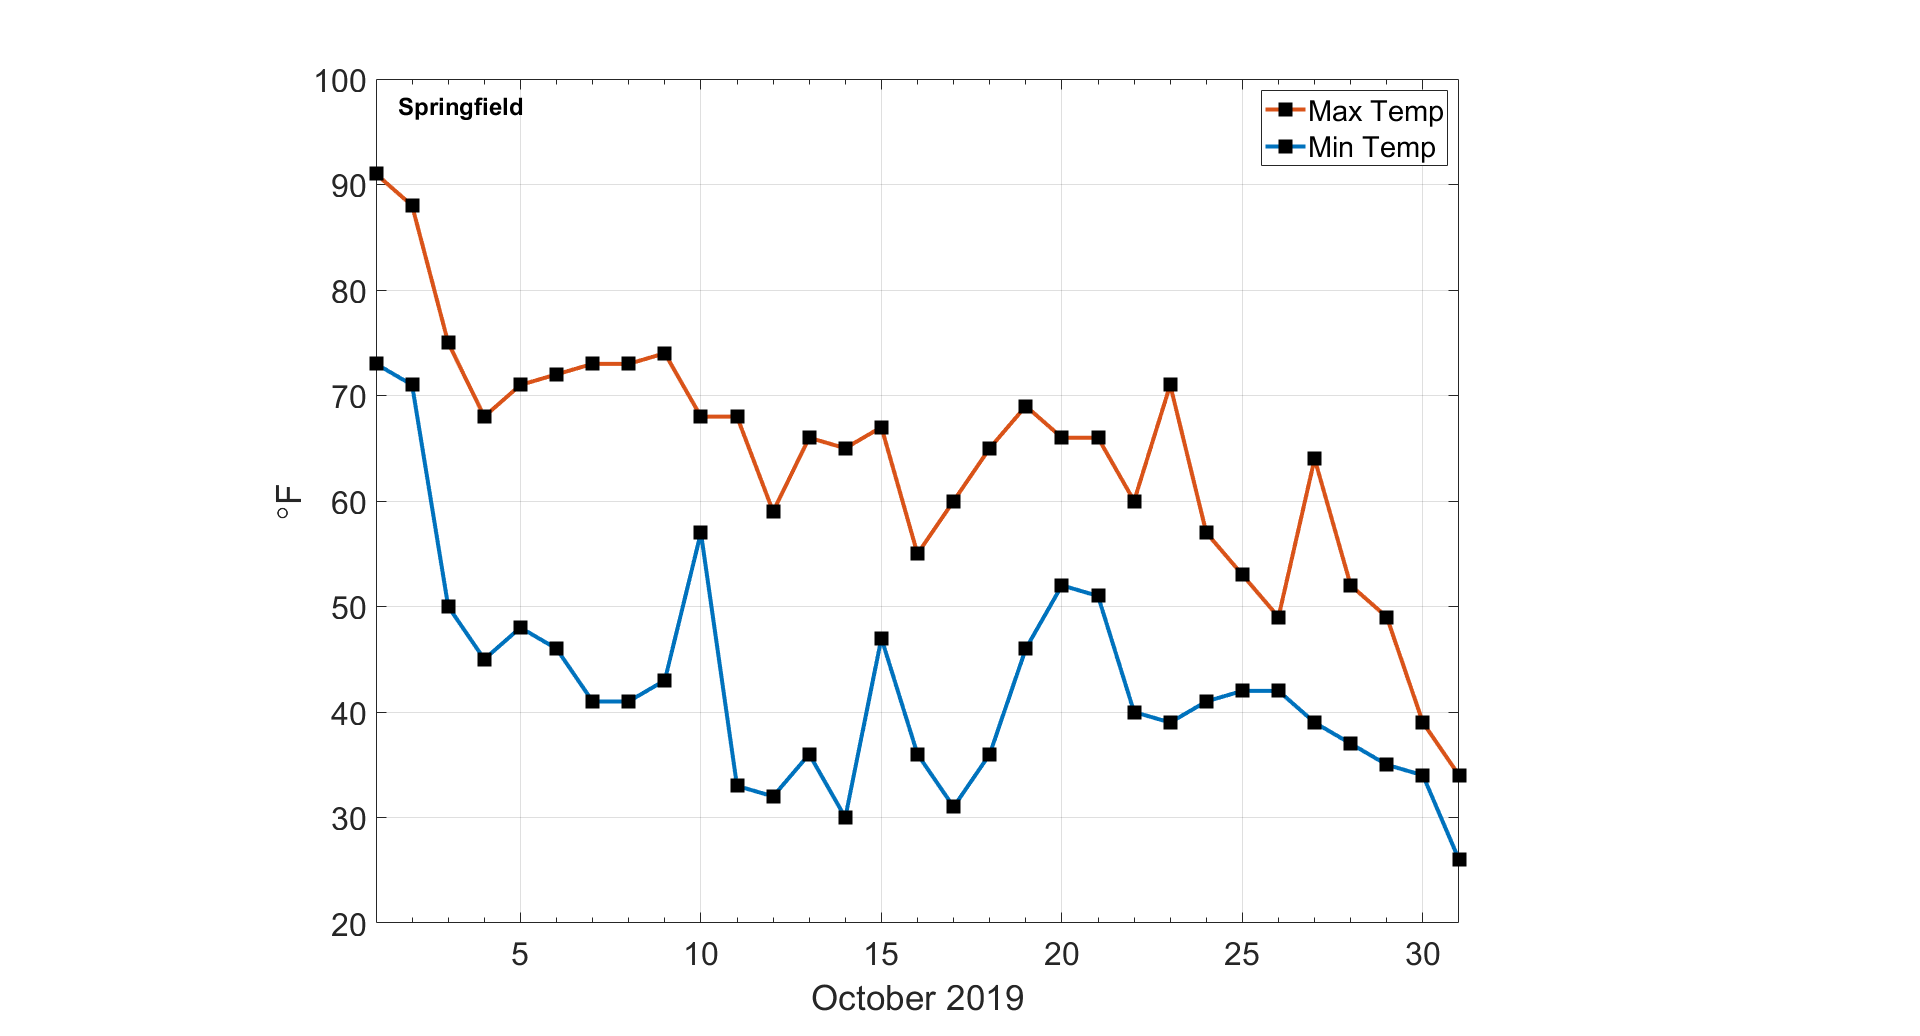
For my money, October is the best weather month of the year. The summer heat mellows out and mixes with the first real shots of chilly air. We had both summer- and winter-like weather last month, but a little more of the former than the latter. As the daily temperature departures from normal in Mt. Vernon show, most October days had above average temperatures, including a few days in the final week of the month that were 15 to 20 degrees above normal (Figure 1).

Figure 1. Daily October average temperature departures in Mt. Vernon.

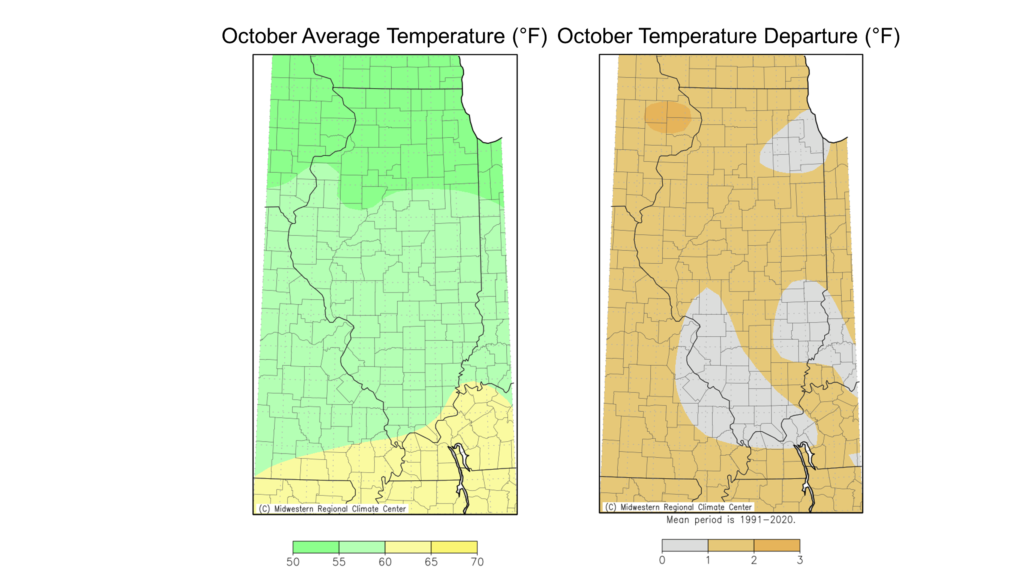
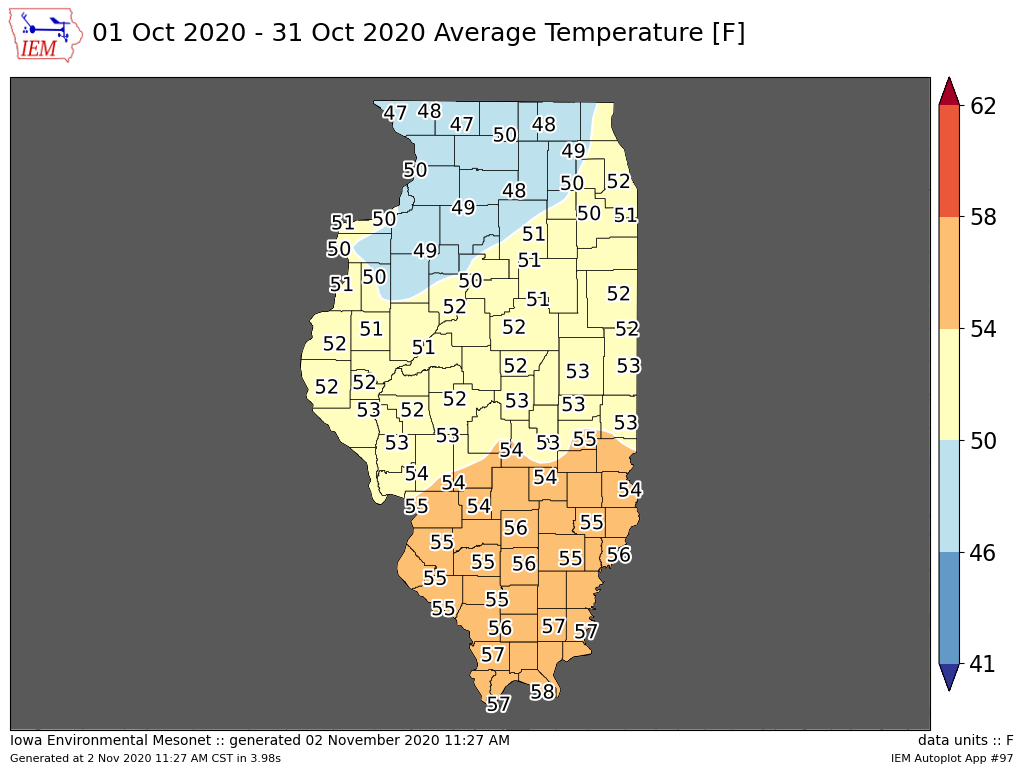
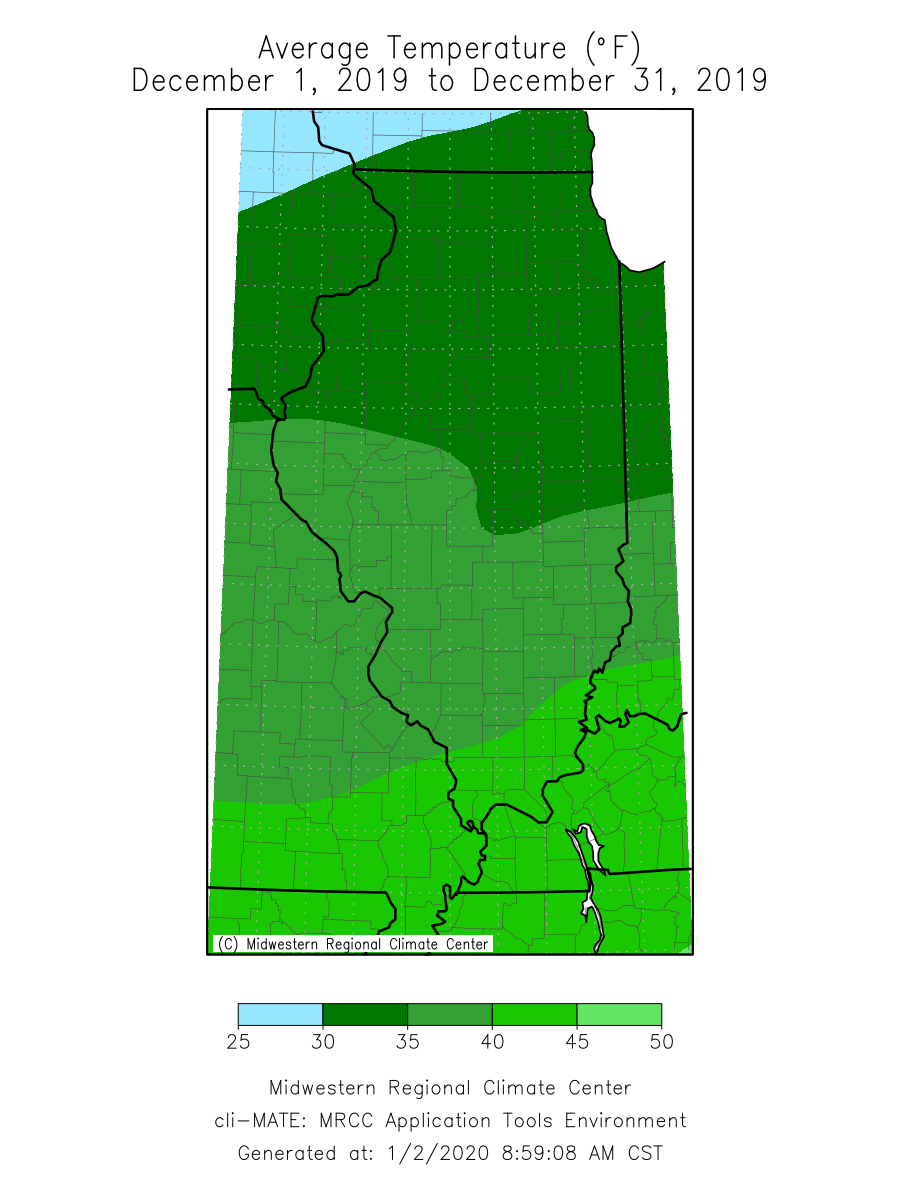
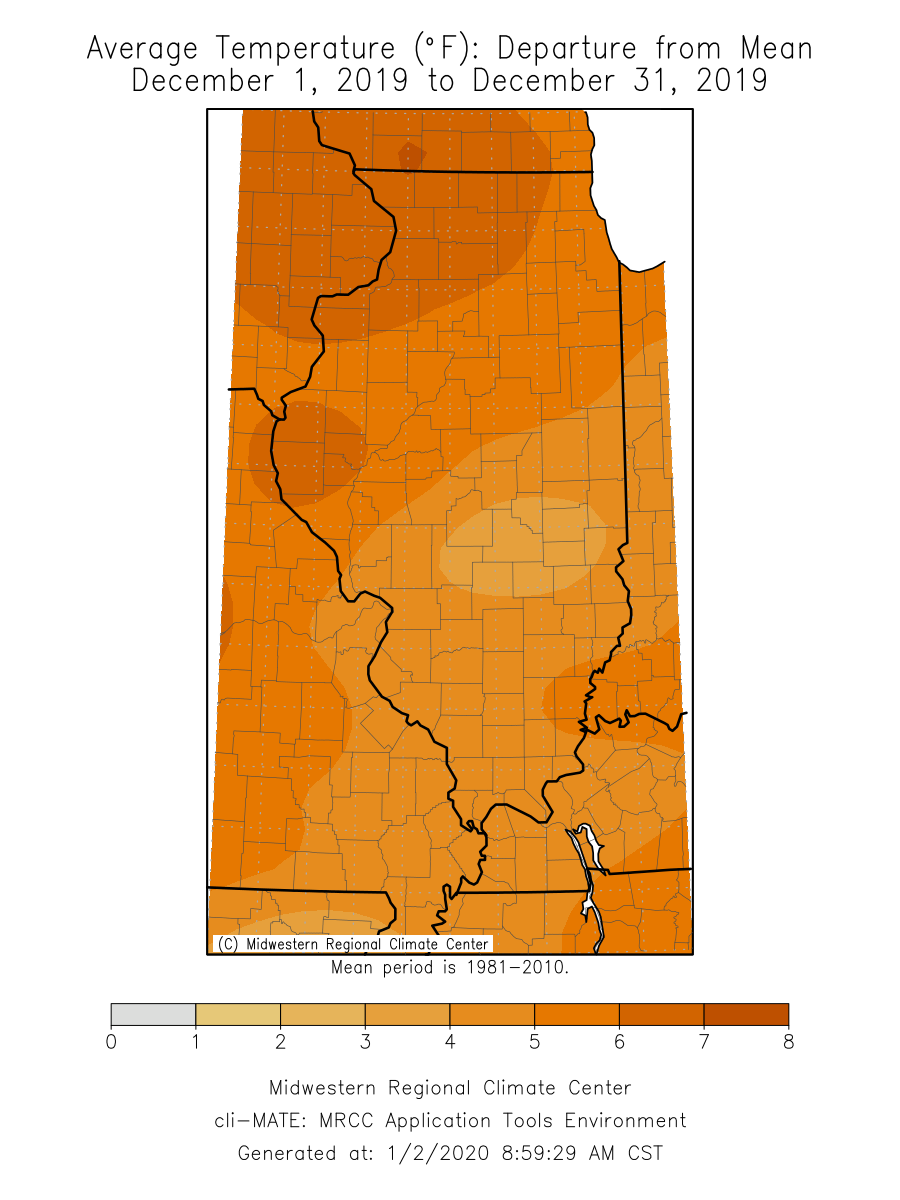
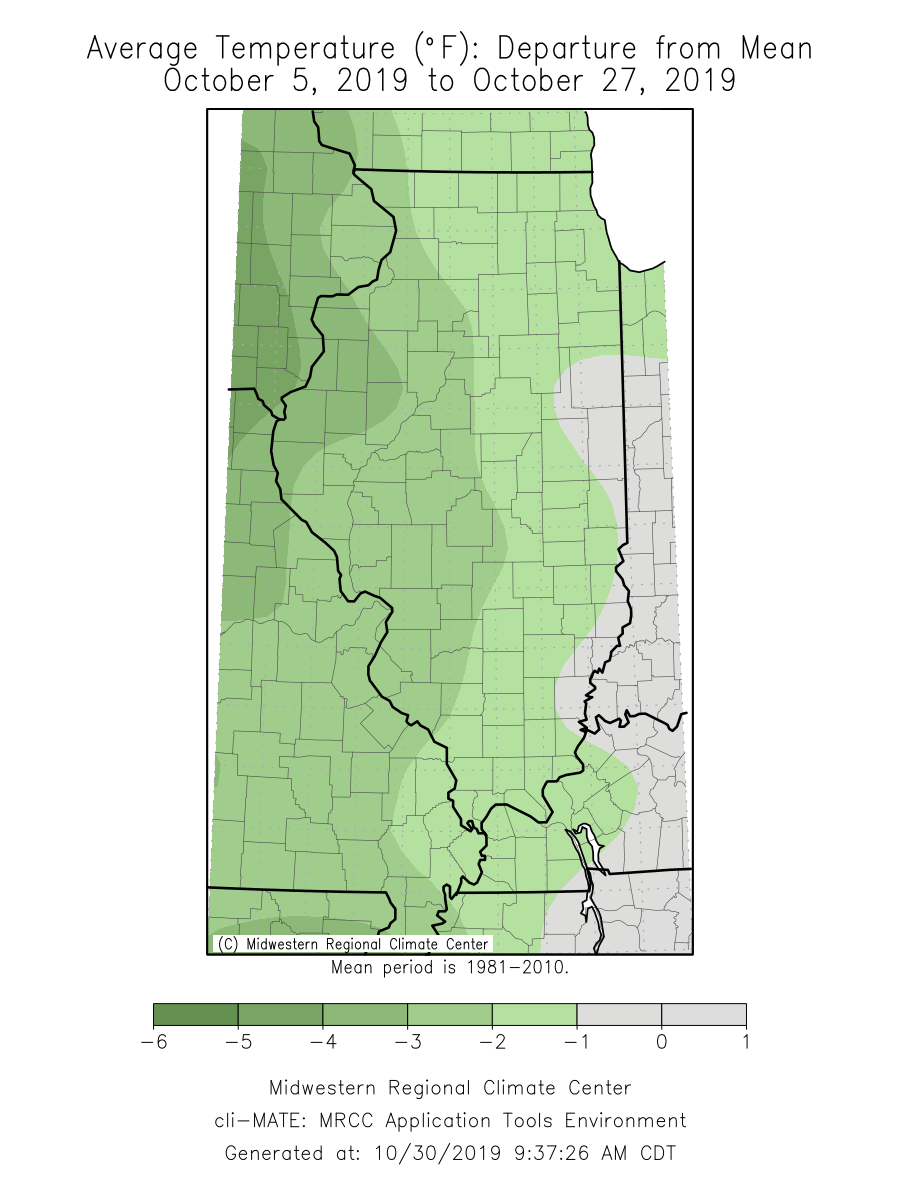
October average temperatures ranged from the low 50s in northern Illinois to the low 60s in southern Illinois, between 1 and 2 degrees above normal in most places (Figure 2). Most of the state saw high temperatures in the upper 80s or low 90s in early October, including 94 in Quincy and 90 in Hoopeston. The brief taste of winter in the last few days of the month brought widespread low temperatures in the low 20s, including 21 degrees in Mt. Vernon and 23 in Bloomington.

The warm periods last month broke 31 daily high maximum temperature records and an incredible 66 daily high minimum temperature records. Aledo in Mercer County broke its all-time October high temperature records last month with a high temperature of 93 degrees on October 3. The cold end to the month broke 18 daily low maximum temperature records and 37 daily low minimum temperature records. 

Figure 2. Maps of (left) October average temperature and (right) October average temperature departures from normal.

Overall, the preliminary statewide average October temperature was 56.7 degrees, 1.9 degrees above the 1991–2020 average and tied for the 31st warmest on record going back to 1895.

Dry Start and Wet End to October

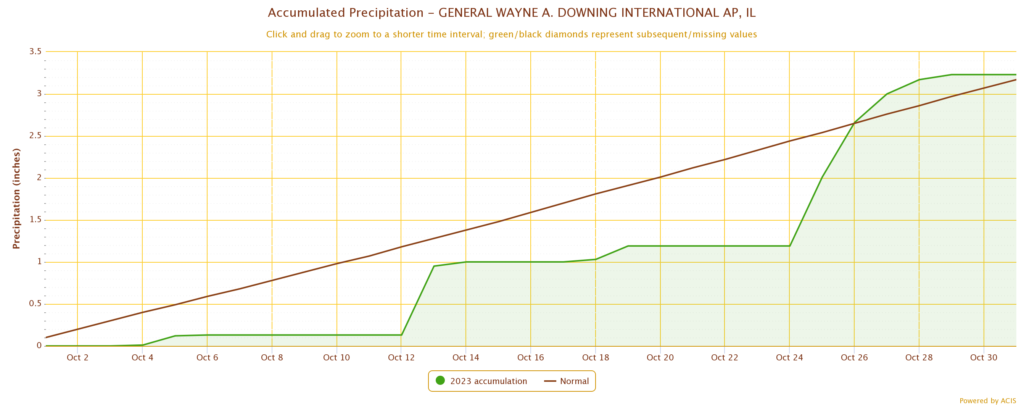
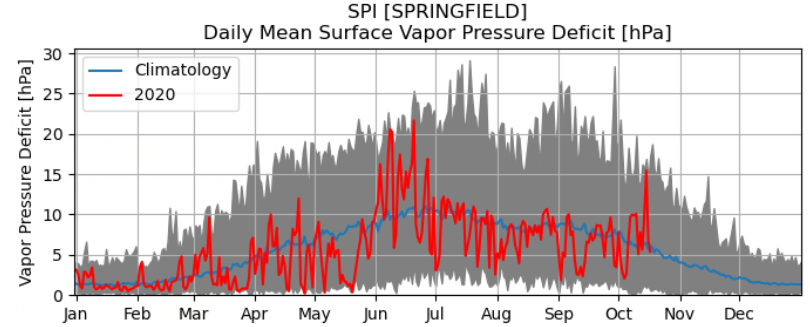
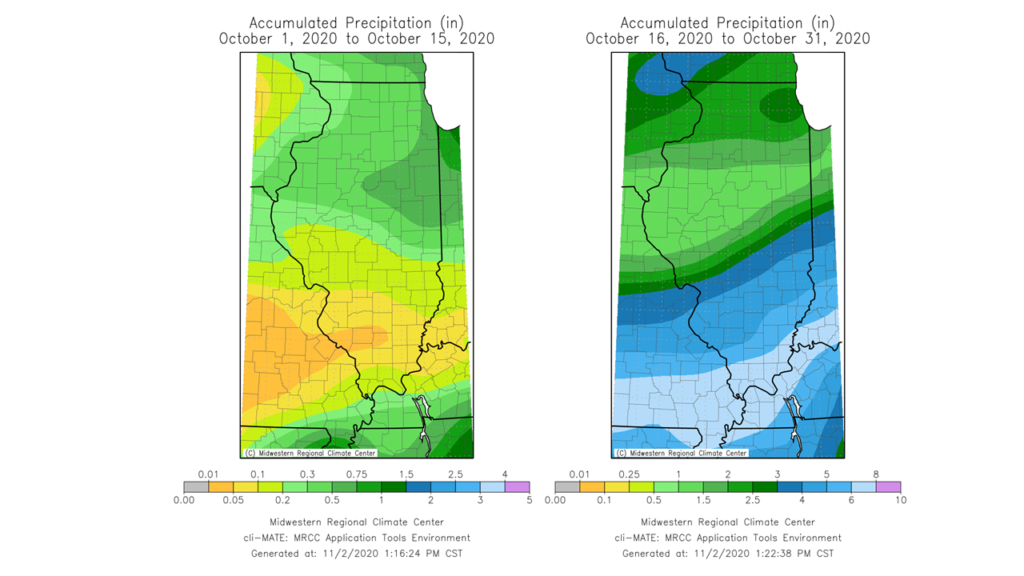
The month-end precipitation totals across the state do not tell the entire story of October precipitation. The first two-thirds of the month were somewhat to very dry across the state, as most places were 1 to 2 inches drier than normal through October 24. More active weather brought multiple rounds of rain–and some snow–to Illinois, raising month-end totals near or above the 30-year normals. As Figure 3 shows, Peoria picked up more rain in the last 7 days of October than in the first 24 days, and the month ended just slightly wetter than normal in Peoria. The dry start to the month was ideal for fall harvest, while the wetter end of the month helped improve dry conditions that prevailed in August and September.

Figure 3. Plot of October daily precipitation accumulation in Peoria (shaded area) versus the normal daily accumulation (black line).

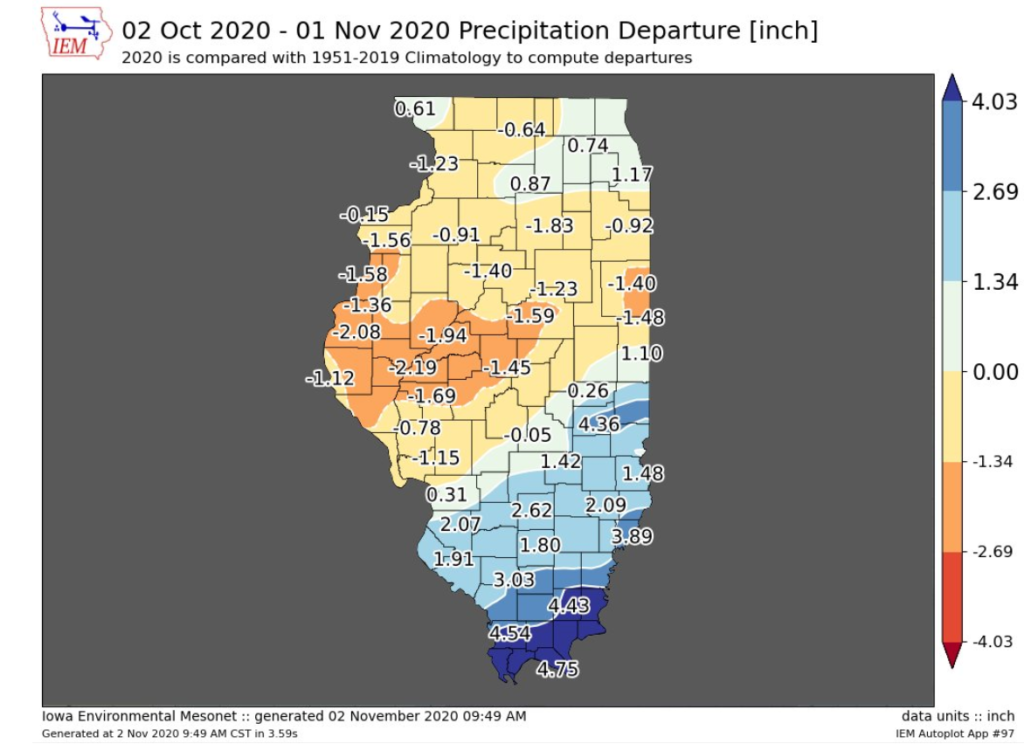
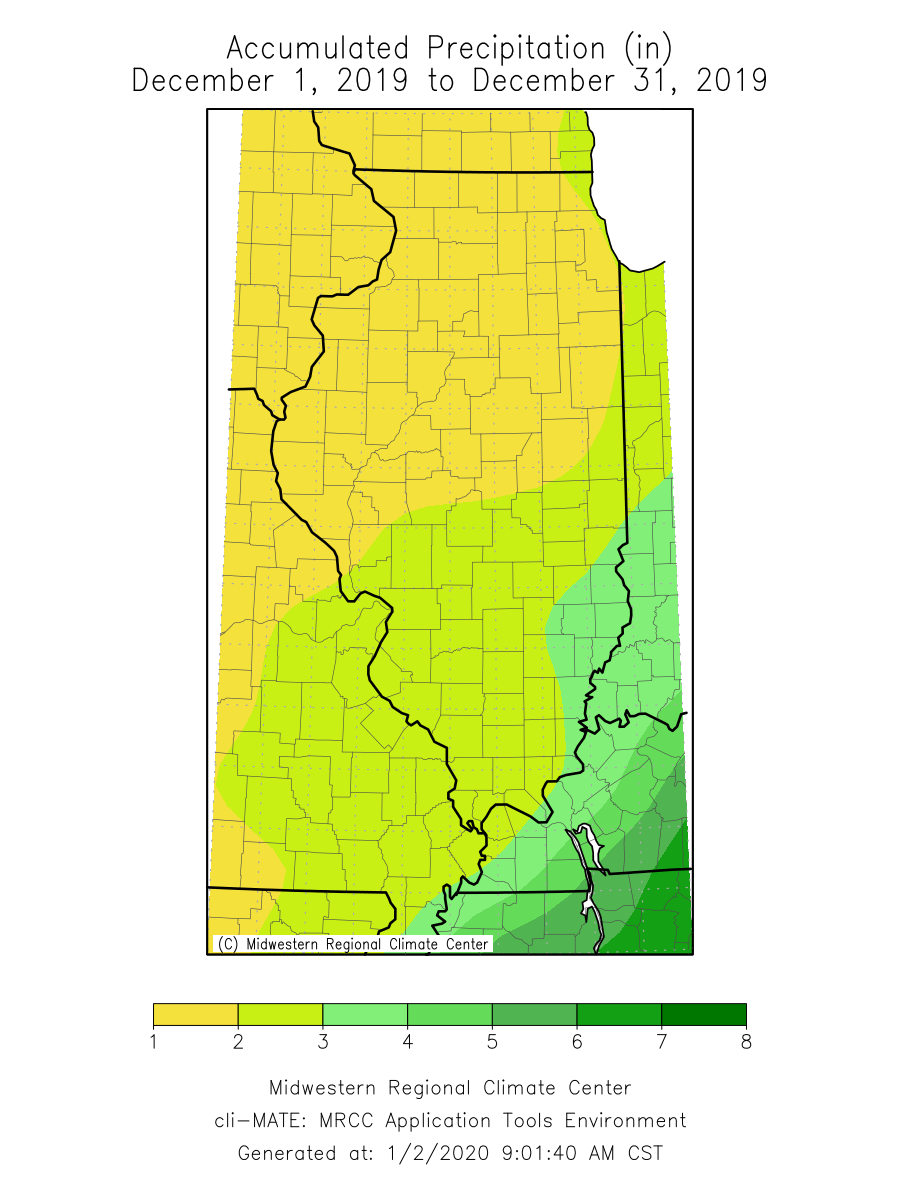
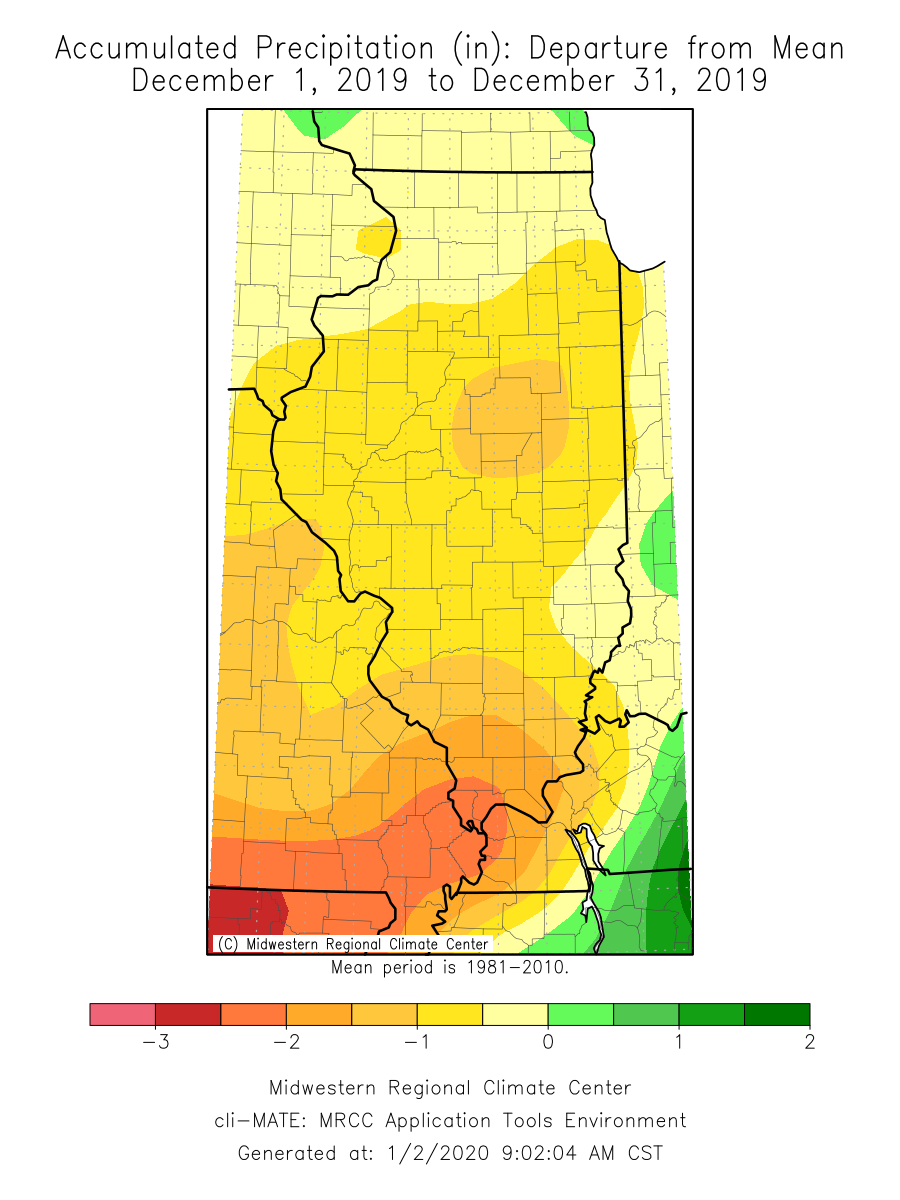
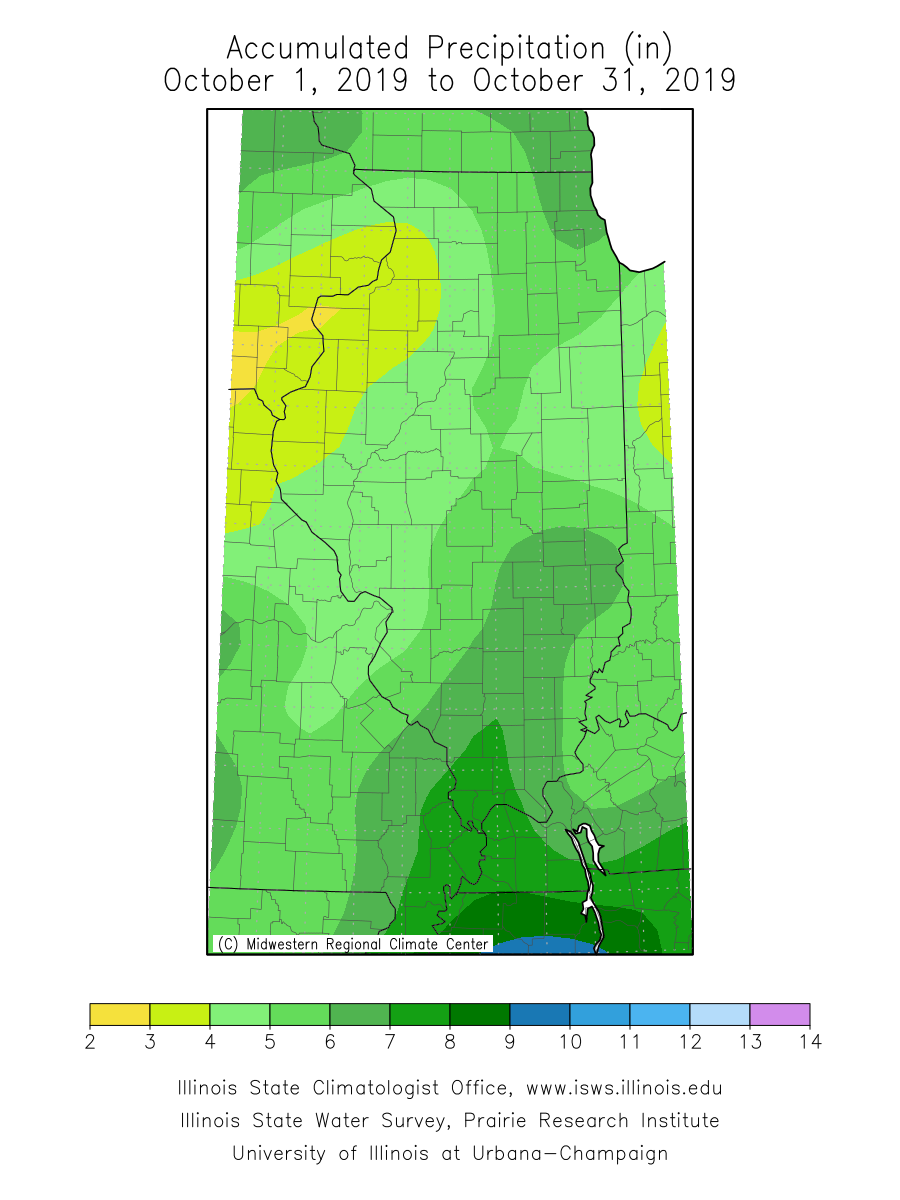
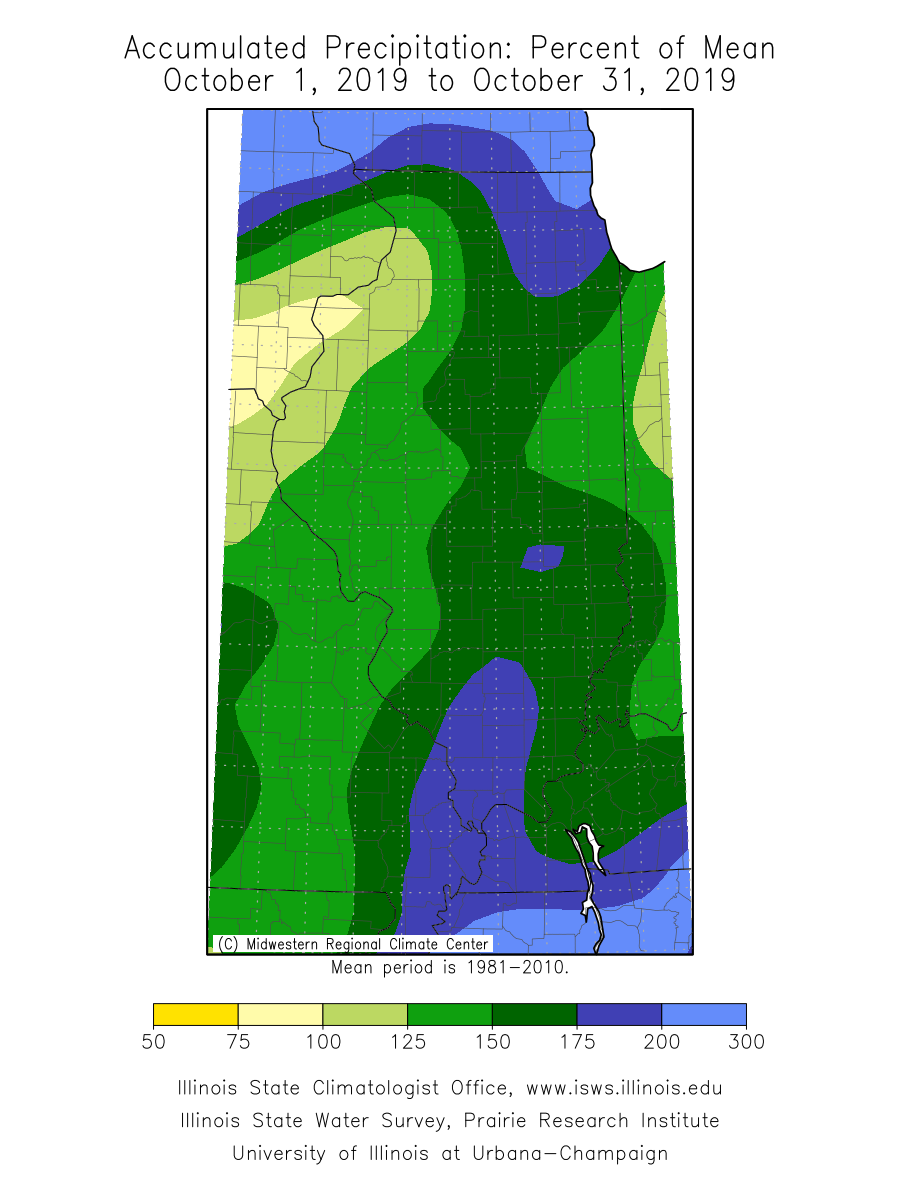
October precipitation ranged from nearly 6 inches in northeast Illinois to less than 2.5 inches in the St. Louis Metro East. Most of the state north of Interstate 70 was 1 to 2 inches wetter than normal, while areas farther south were just slightly drier, up to 2 inches drier than normal (Figure 4).

Figure 4. Maps show (left) October total precipitation and (right) October precipitation departure from average.

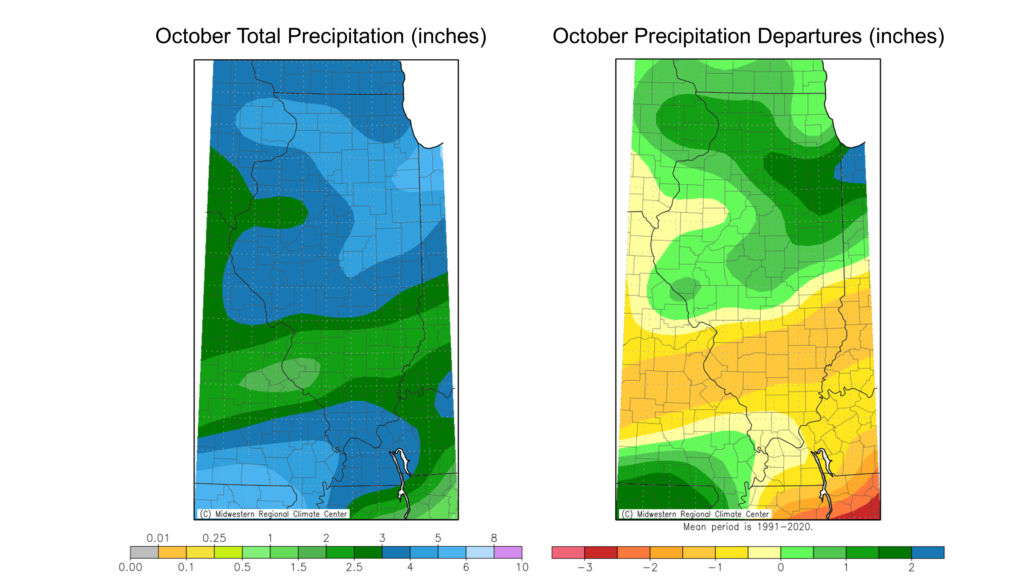
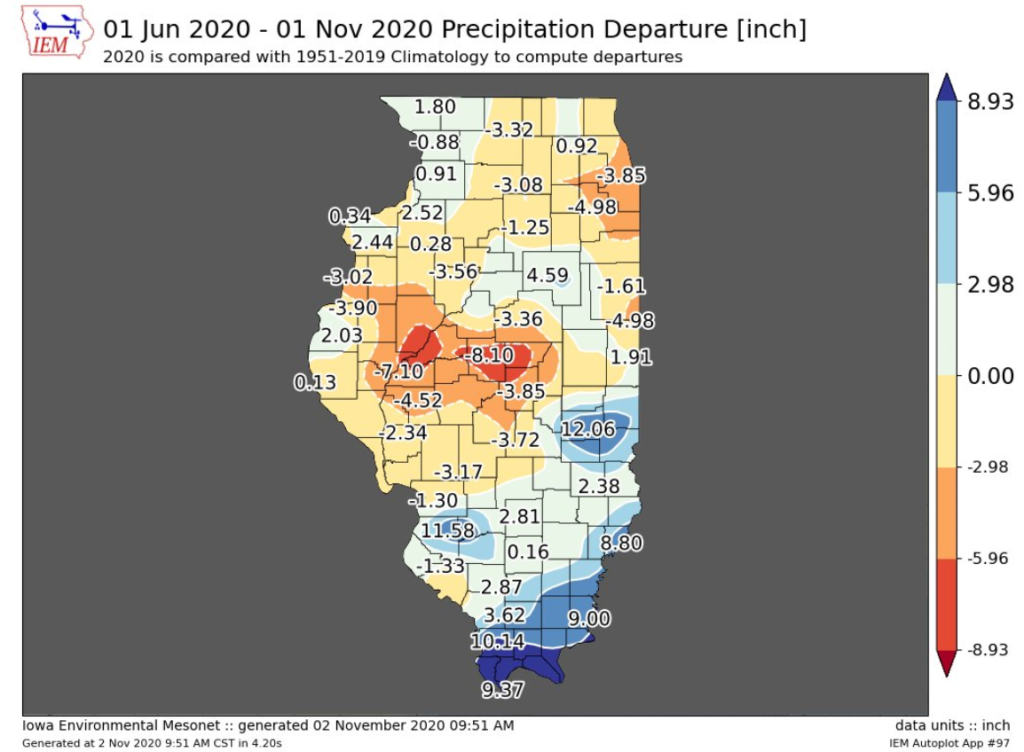
Last month wasn’t an extremely wet or extremely dry month anywhere in the state; however, the wetter conditions in the northern half of the state helped reduce drought extent from 23 percent of the state on October 3 to 7 percent on October 31. Small areas of western and southern Illinois remain in moderate drought due to longer-term precipitation deficits. For example, the first 10 months of the year have had the third lowest precipitation total in Quincy with 20.17 inches, around 10 inches below average. While topsoil moisture in western Illinois has improved from the wetter end of October, deeper layer moisture and water table levels remain less than ideal because of the long-term dryness.

Overall, the preliminary statewide total October precipitation was 3.46 inches, 0.20 inches above the 1991–2020 average and the 41st wettest on record.

A Spooky, Winter-y Halloween

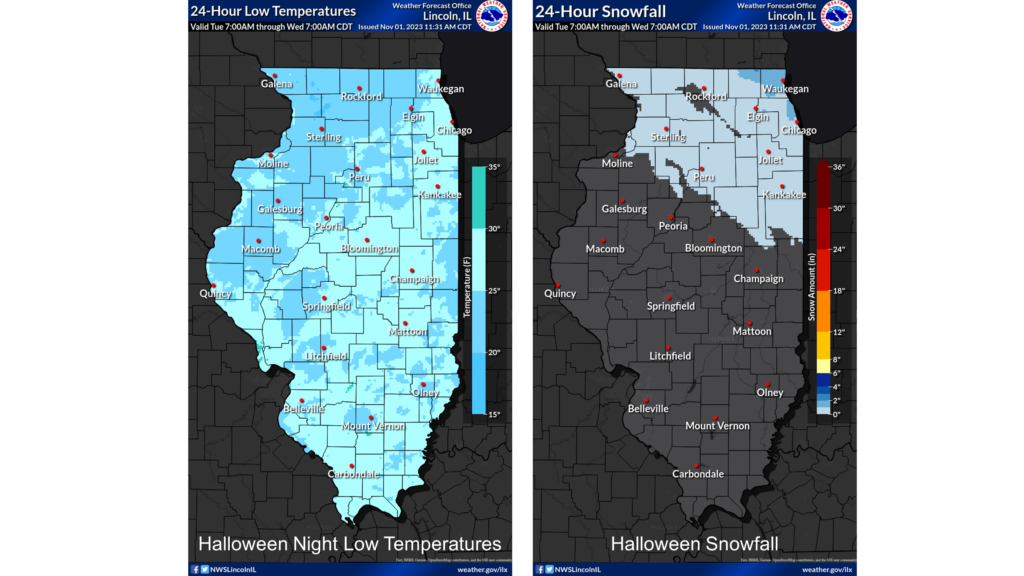
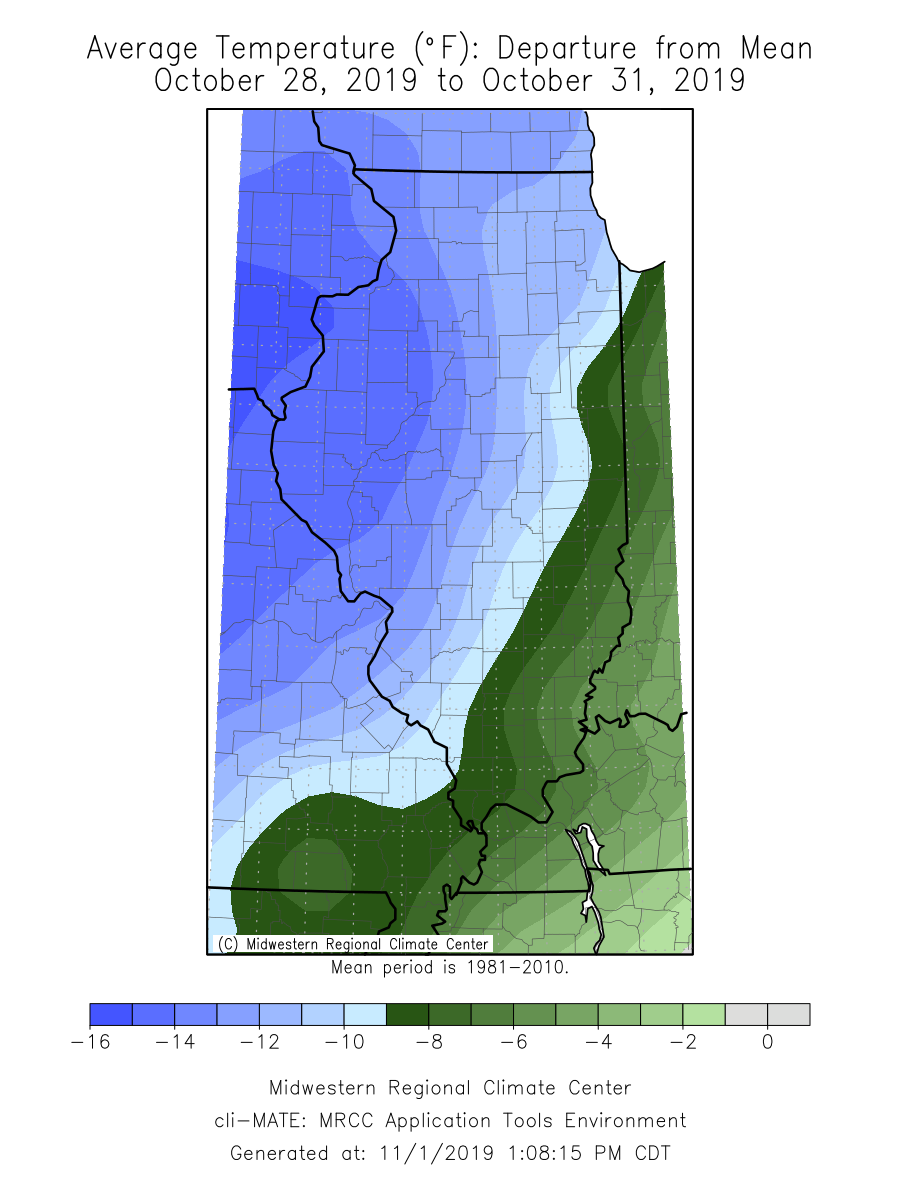
Like all the horror film characters who inevitably run back into the haunted house, mild October temperatures lulled all of us into a false sense of security. The intense cold, wind, and for some folks, snow on Halloween was more shocking than the sound of a revving chainsaw. Halloween nighttime temperatures dipped into the low 20s and high teens across much of the state, including 18-degree lows in Monmouth and Rochelle (Figure 5). The daytime high temperatures on Halloween were the coldest on record in several spots across the state, including at Chicago’s Midway airport (37 degrees) and Mt. Vernon (43 degrees). The low temperatures on Halloween night also set records in many places, including in Kankakee (24 degrees) and Olney (22 degrees). In fact, this year was the coldest Halloween in Olney since observations began there in 1896.

Halloween snow in northern and central Illinois is not necessarily a rarity but happens once every 4 to 6 years. Measurable snow, with totals exceeding 0.1 inches, was recorded in much of the state north of Interstate 74, with totals as high as 1.5 inches in Mundelein and 0.9 inches at O’Hare (Figure 5). For reference, the average first measurable snow comes in the third or fourth week of November for most of northern and central Illinois, so this year’s event came about two to three weeks early. It’s important to note that an early snowfall does not mean we will necessarily have a very snowy winter… but this State Climatologist can hope.

Figure 5. Maps of (left) nighttime low temperatures and (right) total snowfall on Halloween. Maps are from the Lincoln National Weather Service Office: https://www.weather.gov/ilx/illinois-daily.

Outlooks

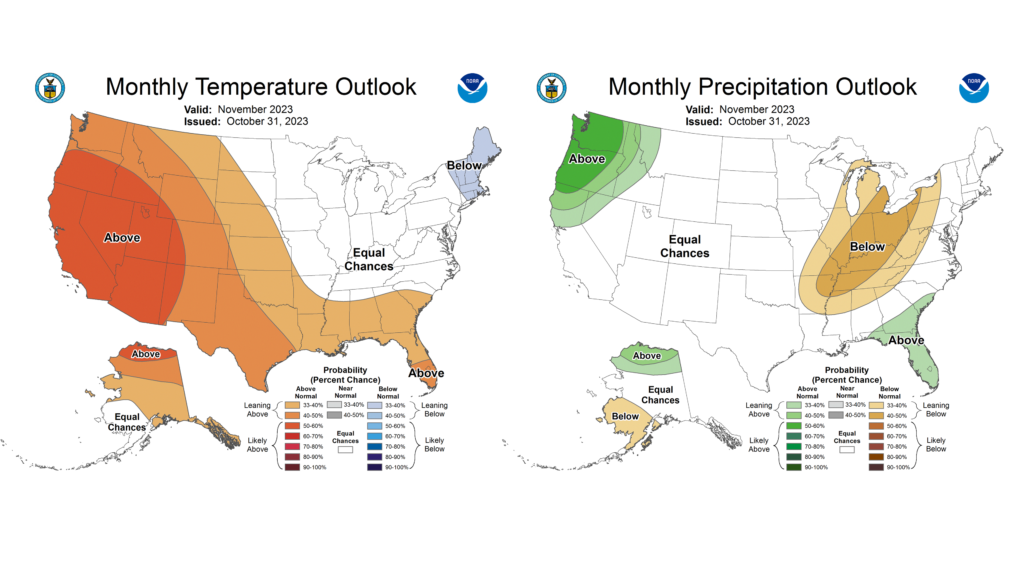
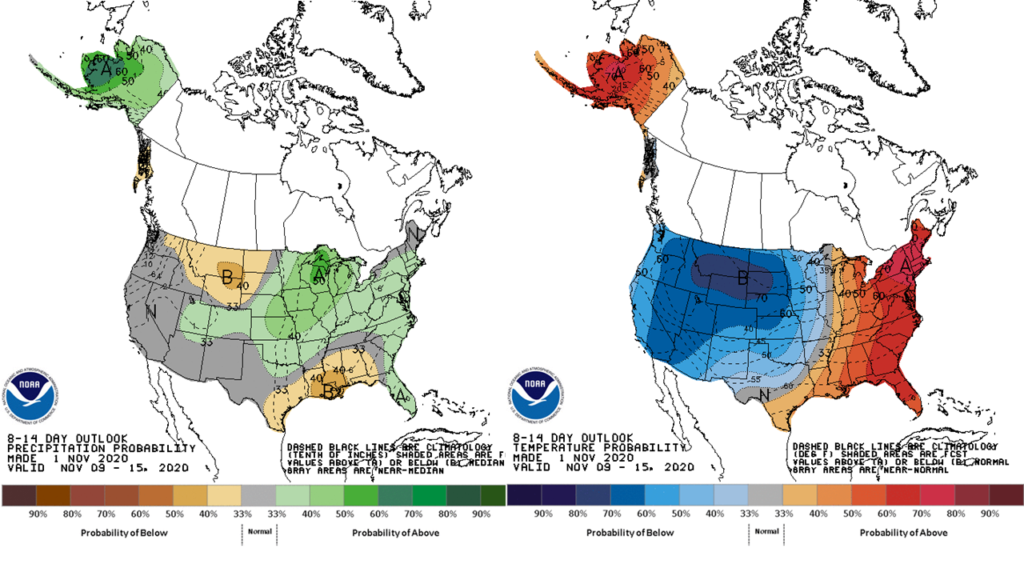
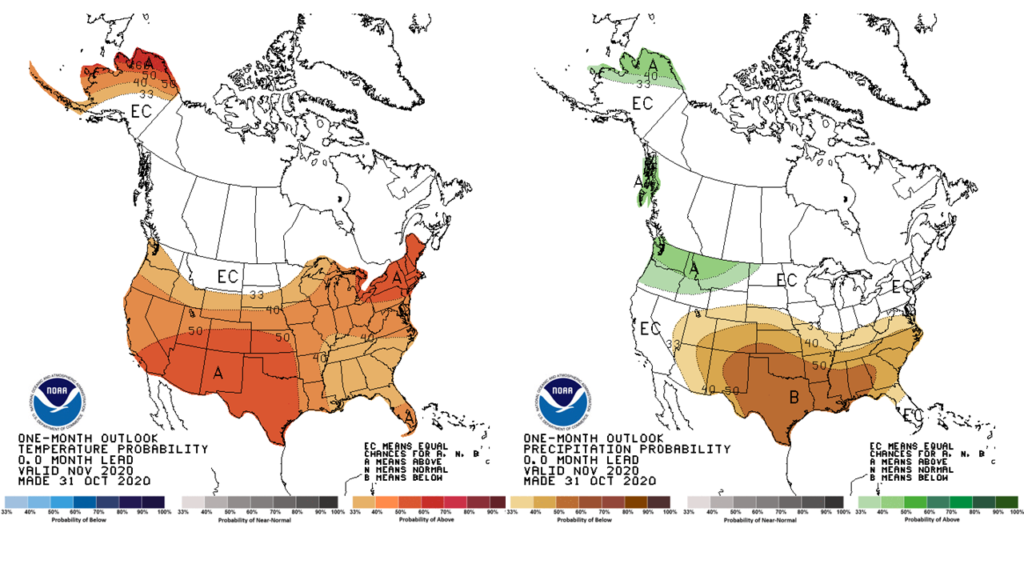
November doesn’t get the love it deserves, because it is so often associated with cloudy, blustery weather. But November typically gives us a great mix of pleasant and not-so-pleasant weather and portends the beautiful winter season in Illinois. The latest Climate Prediction Center outlooks lean into El Niño with higher chances of below normal November precipitation. November temperature outlooks are more mixed, with equal chances of warmer and colder weather this month (Figure 6).

Figure 6. Maps of (left) temperature and (right) precipitation outlooks for November.

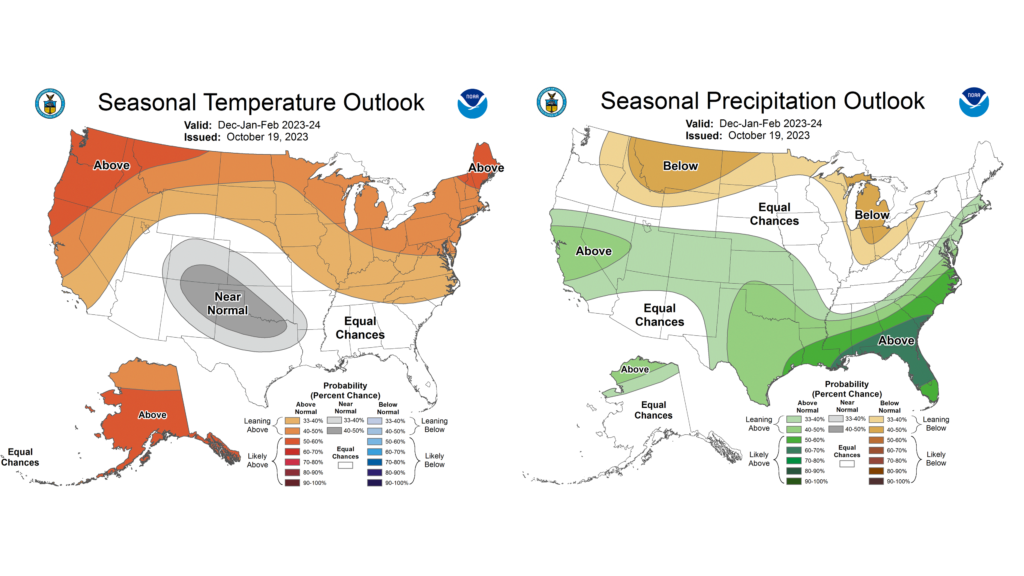
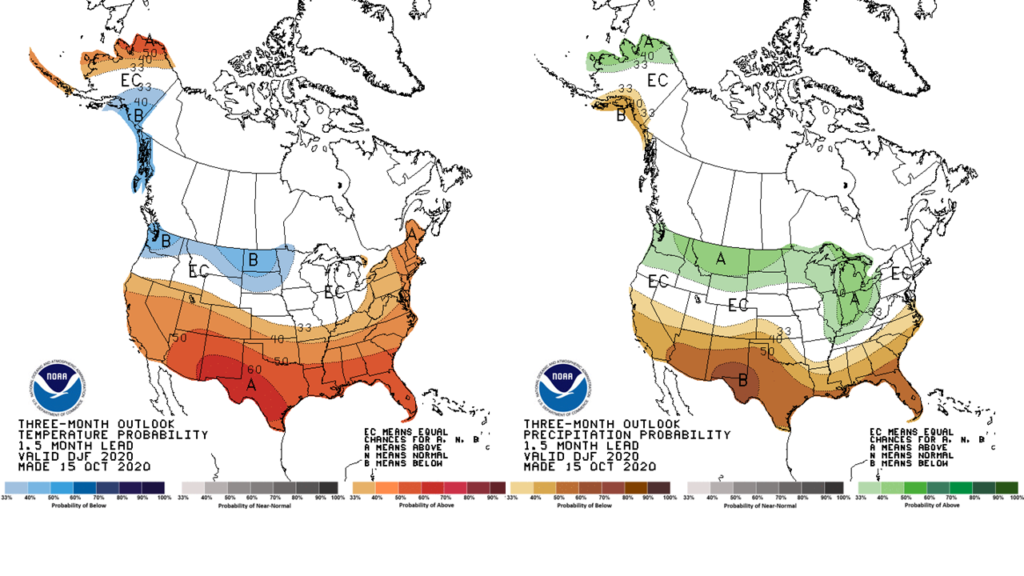
Meanwhile, NOAA leans even more heavily into El Niño for climatological winter (December–February) outlooks (Figure 7). The outlooks show highest chances of above normal temperatures in winter, with mostly equal chances of above or below normal precipitation.
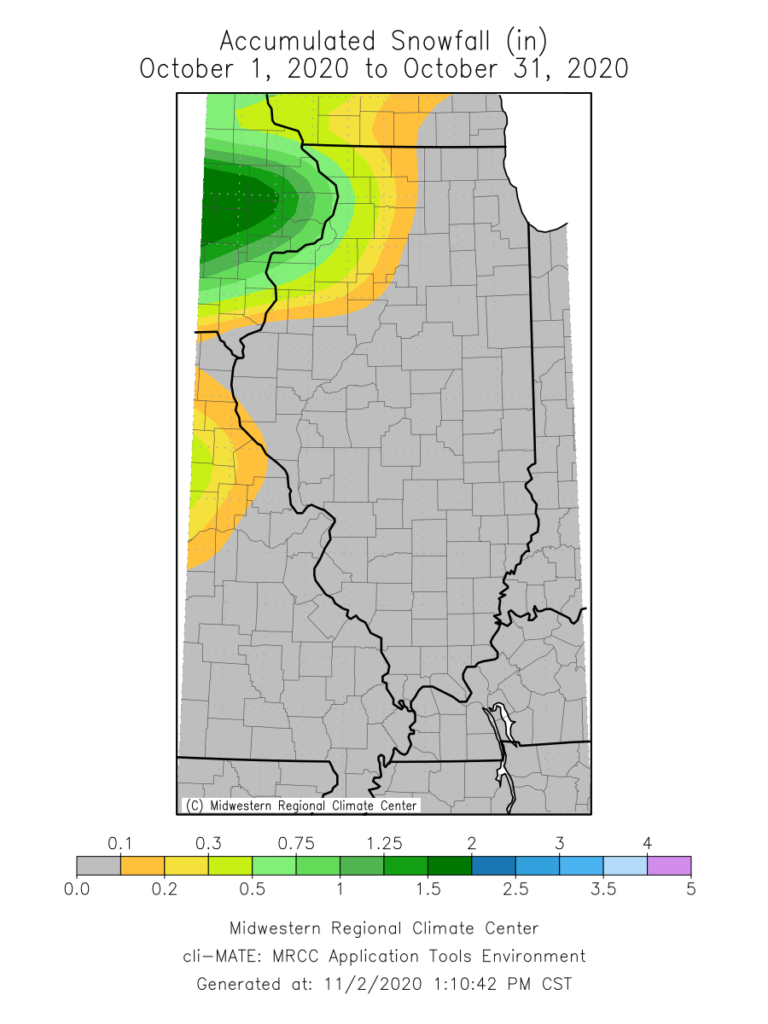
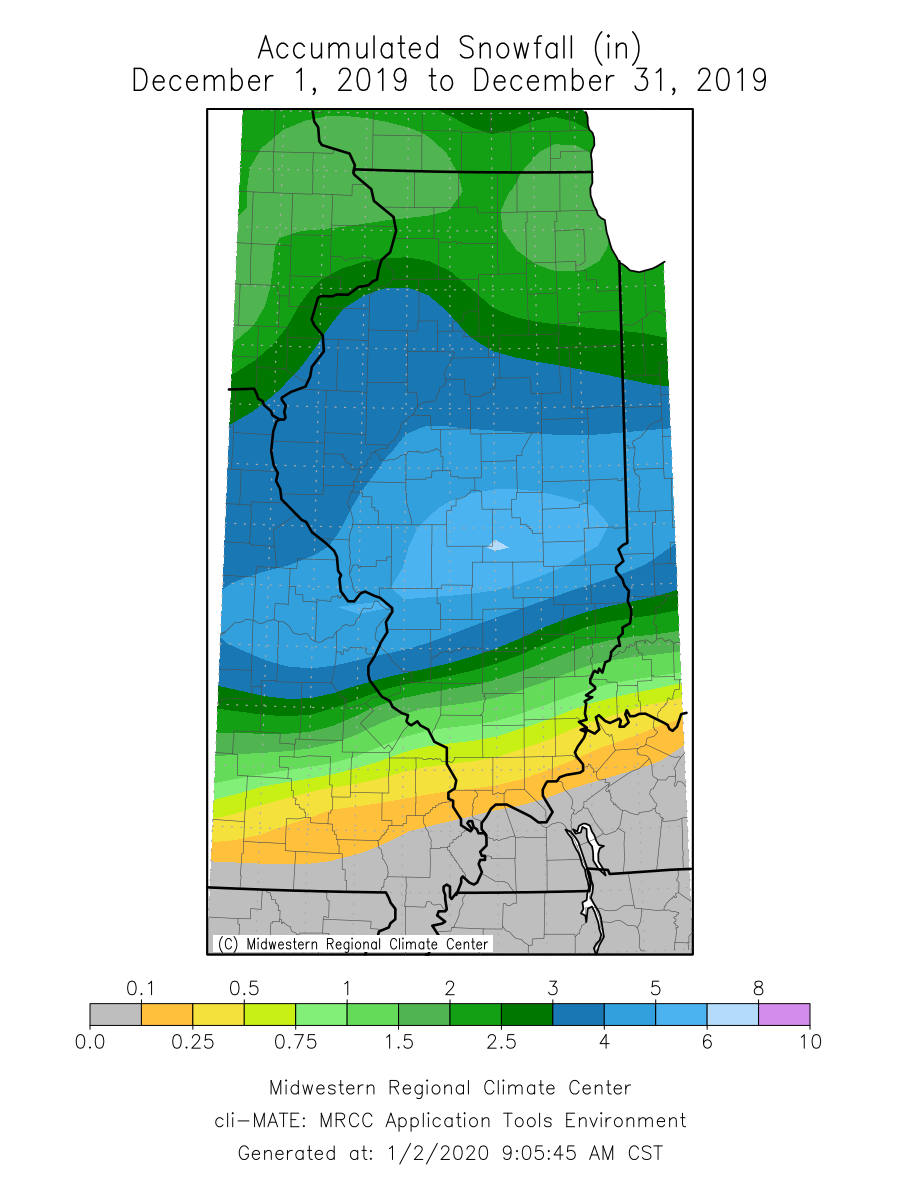
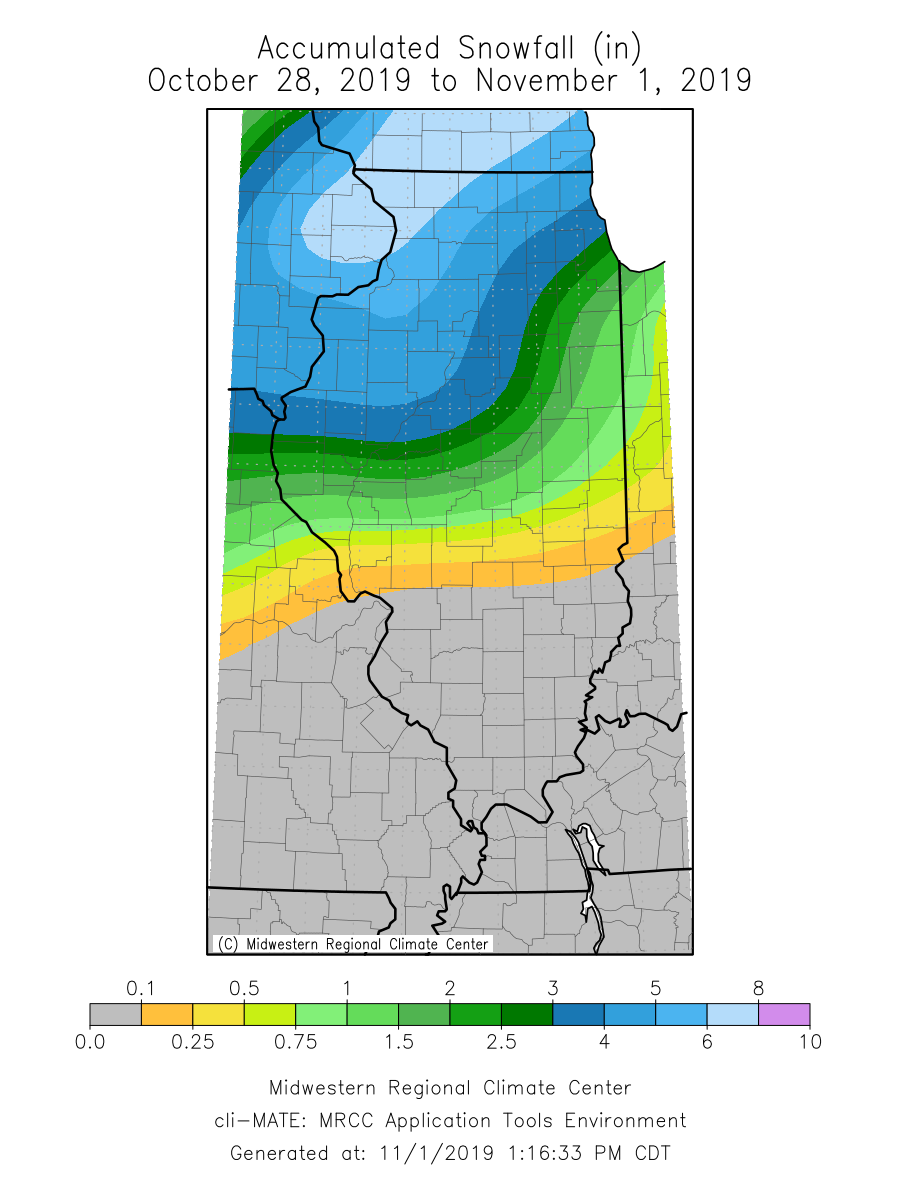
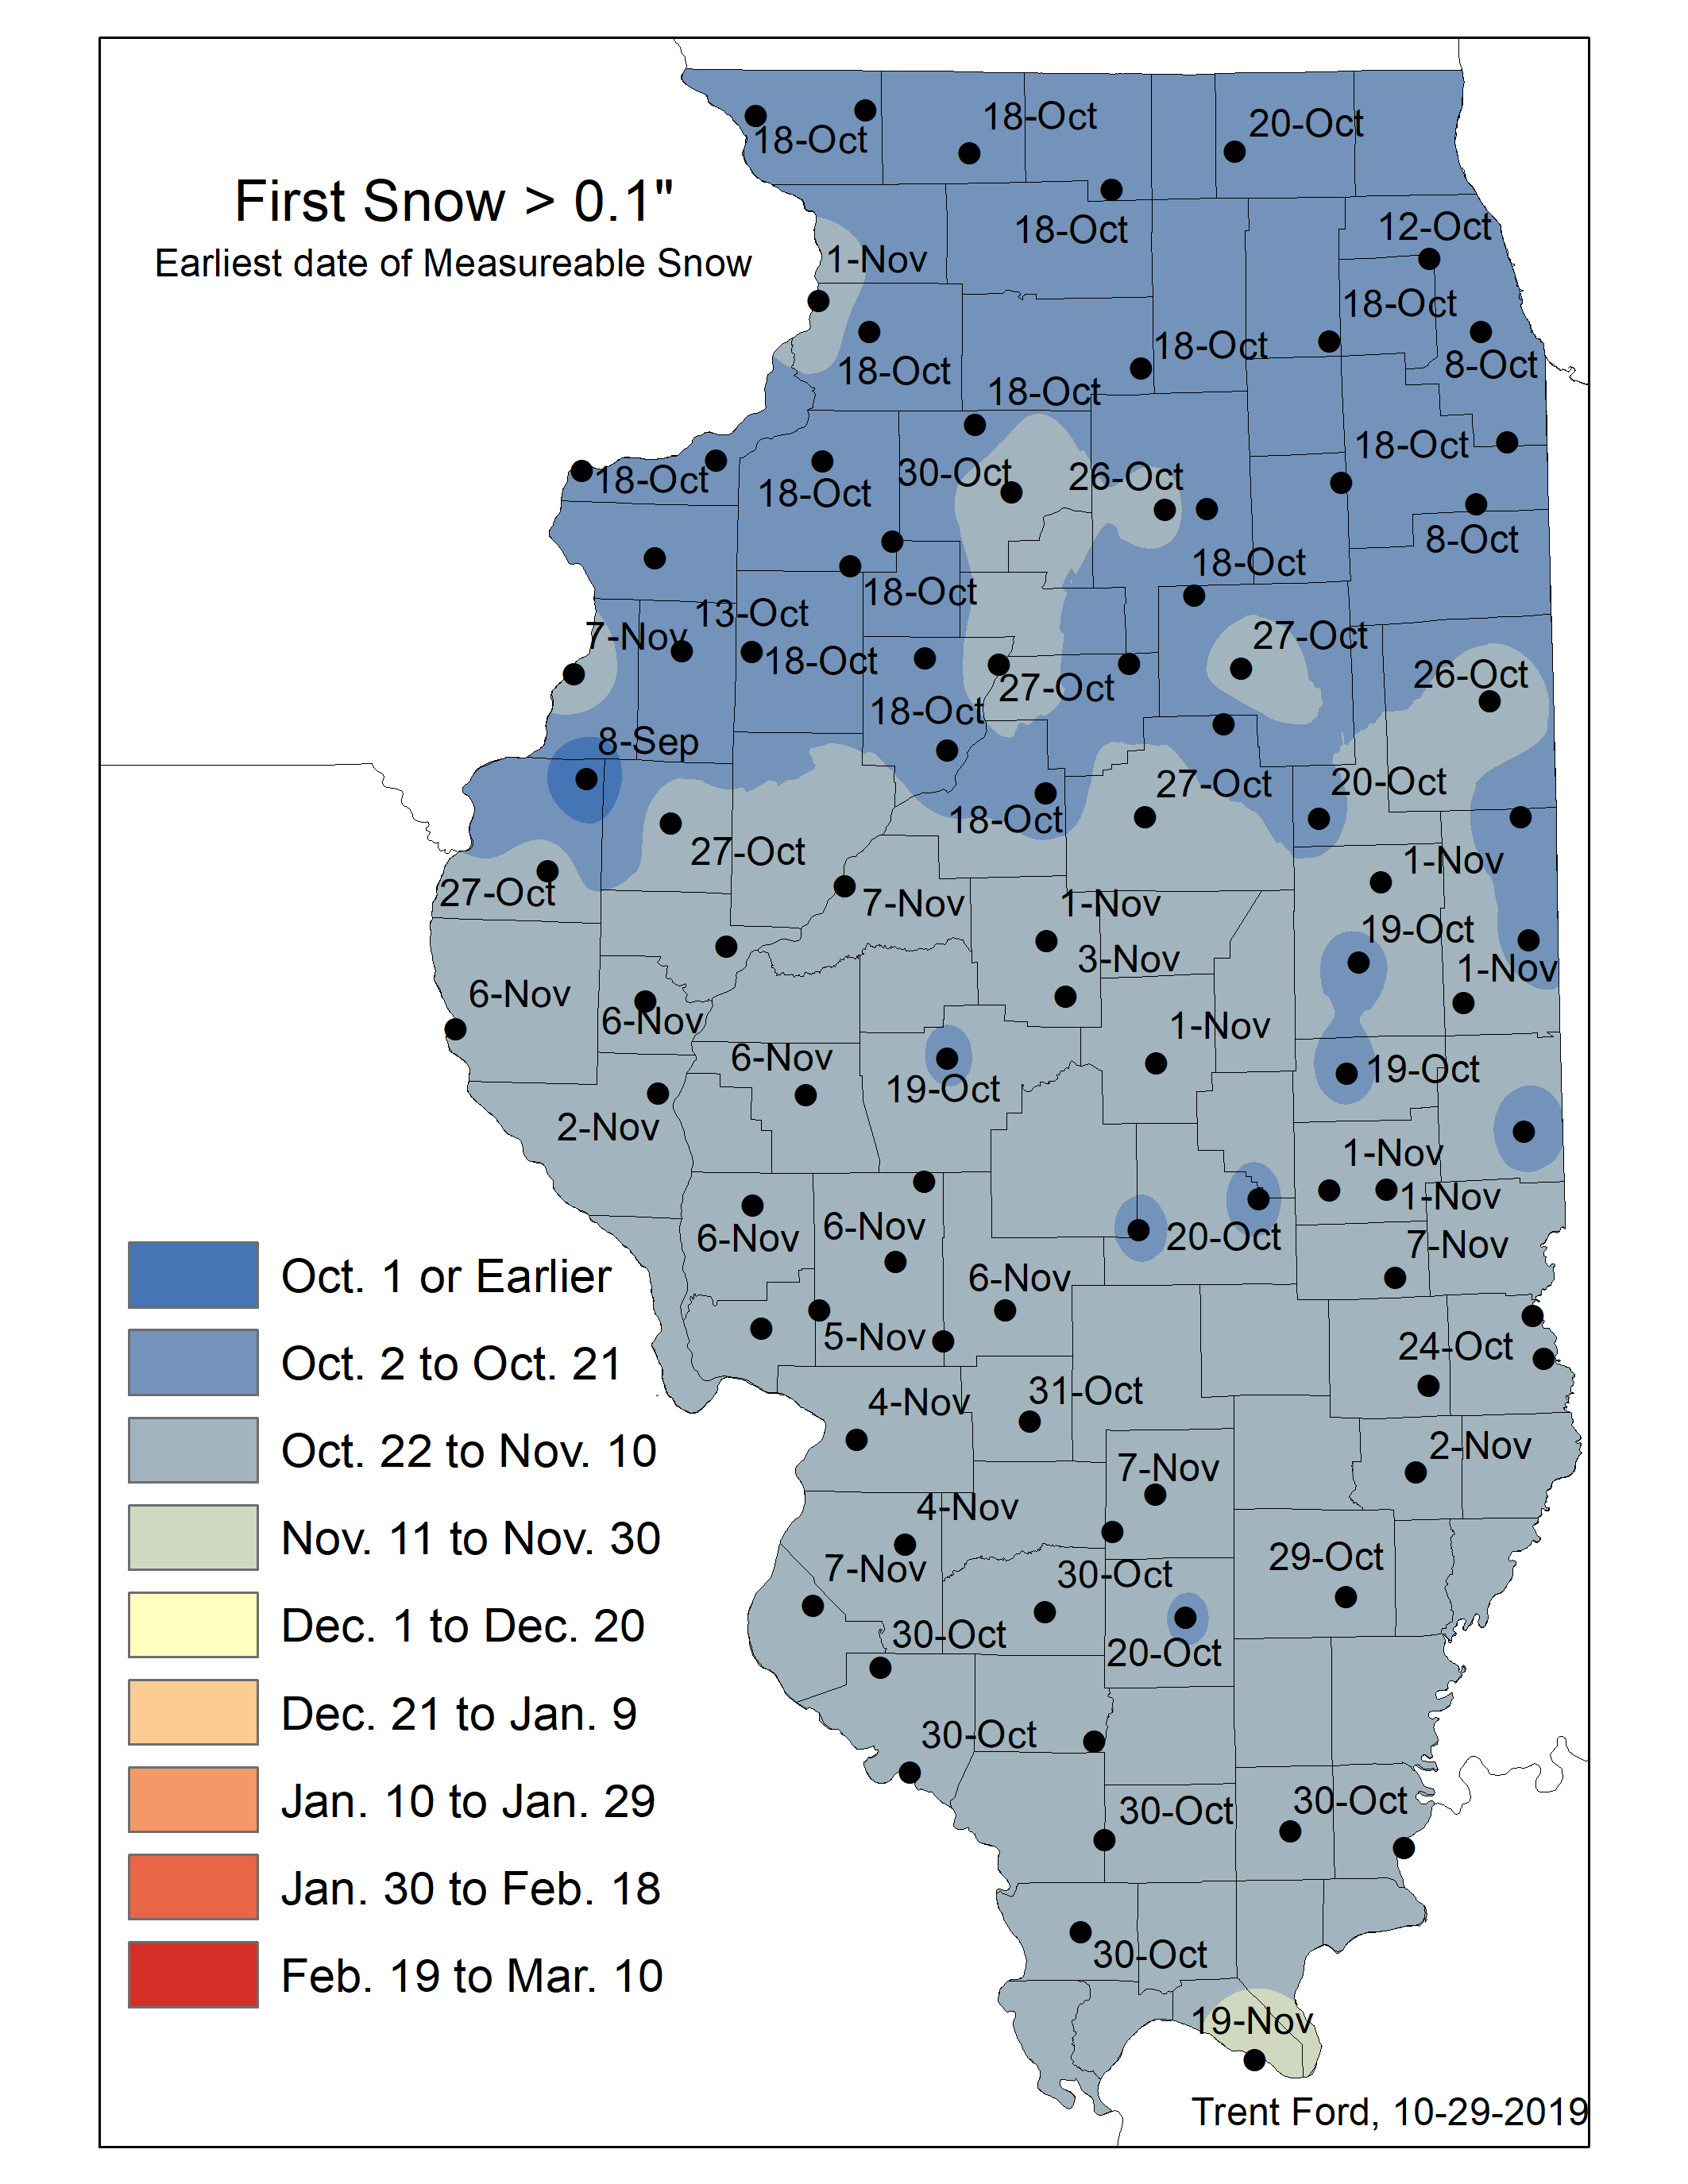
Figure 7. Maps of (left) temperature and (right) precipitation outlooks for winter (December–February).