The statewide average March temperature was 47.7°F, 6.3° above the 1991-2020 normal for March and the 7th warmest March on record statewide. The statewide average total March precipitation was 2.76 inches, 0.18 inches below normal and the 58th driest March on record statewide.
March Temperatures Start and End Like a Lamb
March temperatures had ebb and flow that is typical of spring in Illinois, yet most days last month were 5 to 25 degrees warmer than normal, as shown by daily temperatures and departures in Elgin (Figure 1). The middle part of the month featured a particularly large temperature swing as a powerful cold front moved through the region. Average temperatures in Elgin dropped from nearly 70 degrees on March 15 to 22 degrees on March 17.
Figure 1. Daily March average temperatures and departures in Elgin.
March average temperatures ranged from the low 40s in northern Illinois to the mid-50s in southern Illinois, between 2 and 7 degrees above normal (Figure 2). Multiple waves of late spring-like weather brought temperatures reaching well into the 80s across the state, including 83 in Quincy and Decatur. Very cold weather, while fleeting, did bring temperatures well below freezing across the state, including nighttime low temperatures of 10 degrees in Lincoln and 12 degrees in Rockford. The coldest place in the state last month was Elgin with an average of 40.9 degrees, while the warmest was Smithland Lock and Dam in Massac County with an average of 53.1 degrees.
The milder weather broke 71 daily high maximum temperature records in Illinois and 13 daily high minimum temperature records. Meanwhile, no daily low minimum or low maximum temperature records were broken in Illinois last month.
Figure 2. Maps of (left) March average temperature and (right) March average temperature departures from normal.
Active March with Plenty of Severe Weather
March is the transition month between the normally driest time of the year in the winter and the normally wettest time of the year between April and July. Consequently, we have experienced years where March was extremely dry (only 1.13 inches in 1981) and those that were very wet (6.30 inches in 1973). This year March was only slightly wetter than normal statewide, but with some large gradients across the state.
Total precipitation ranged from less than 1.5 inches in far southwest Illinois to over 8 inches in northeast Illinois. The northern half of the state was 1 to 4 inches wetter than normal last month, while most areas south of Interstate 64 were 1 to 3 inches drier than normal (Figure 3).
Figure 3. March total precipitation (left) and March precipitation departure from normal (right).
While severe weather, including thunderstorms, strong winds, hail, and tornadoes, occur every month in Illinois, they tend to be most common between March and July. An active storm track and abundant moist, warm air from the Gulf of Mexico produced multiple severe weather outbreaks in March across the Midwest. In all, there were 58 tornado warnings issued in Illinois, the most on record for March (Figure 4). The NOAA Storm Prediction Center lists 33 tornado reports in Illinois last month, which may be adjusted before a final number is released. Included in these reports is a confirmed EF-2 tornado that caused significant damage to Neoga High School in Cumberland County on March 15, and multiple tornadoes that damaged or destroyed buildings in Douglas County on March 30.
Figure 4. Tornado warning frequency in March by year across Illinois. Graph is courtesy of the Iowa Environmental Mesonet: https://mesonet.agron.iastate.edu/.
As is the case in most years, March precipitation came in many forms, including snow. However, measurable snowfall was mostly contained to the northern third of the state. Monthly snowfall totals in those places that were able to measure the snow ranged from around 2 inches in the Quad Cities region to over 7 inches in parts of Knox County and Boone County in western and northern Illinois, respectively.
April and Early Growing Season Outlooks
Climatological spring starts with March, but most folks associate spring more with April and May, as weather in Illinois begins to consistently feel springlike. The outlook for April through June shows best chances of warmer and wetter than normal weather for much of Illinois. Most noteworthy is the warm and dry signal that dominates the mountain west and western plains in the first half of the growing season.
Figure 5. Climate Prediction Center (left) temperature and (right) precipitation outlooks for April through June.
August was slightly cooler and much drier than average across Illinois. The preliminary statewide average August temperature was 72.7 degrees, 0.9 degrees below the 30-year normal and the 45th coolest on record. Preliminary statewide average total precipitation for August was 2.01 inches, 1.58 inches below than the 30-year normal and the 15th driest on record.
Data are provisional and may change slightly over time
August Temperatures
Following the warmer than average months of June and July, August began much cooler than average. The below average temperatures persisted through the third week of the month in response to a persistent atmospheric trough over the central U.S. The map below shows temperatures were between 1 and 4 degrees below average through the first three weeks of August.
Between August 1 and 21, 43 daily low maximum temperature and 6 daily low minimum temperature records were broken across the state. This included a 70-degree high temperature in Salem in Marion County, which broke the previous record by 10 degrees.
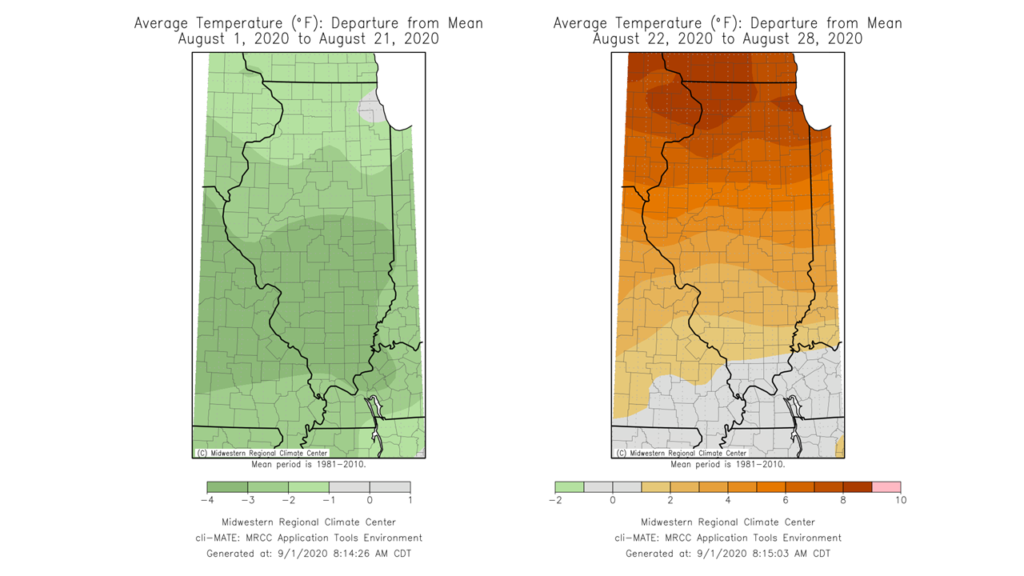
As the ridge in the western U.S. broke down in the third week of August, heat spread east, and Illinois temperatures switched to considerably above average. As the map below shows, temperatures in the week of August 22 were 1 to 10 degrees above average with the highest departures in northern Illinois.
During this fourth week of August, 10 daily high maximum temperature and 6 daily high minimum temperature records were broken. Mount Carroll in Carroll County broke or tied their daily high maximum temperature records on three consecutive days between August 25 and 27. Most stations observed daily high temperatures in the 90s this week, including five consecutive 90+-degree days in Rockford. This was the longest such streak in Rockford in August since 2011. The station at Chicago’s O’Hare Airport observed 10 days with a high temperature at or above 90 degrees last month. This is tied for the sixth most 90+-degree days at O’Hare, going back to 1959, and the most since 2012. The climatological average August frequency of 90+-degree days at O’Hare is 4. This is compared to the station in Carbondale that typically experiences 11 90+-degree days in August, but only observed 4 this last month.
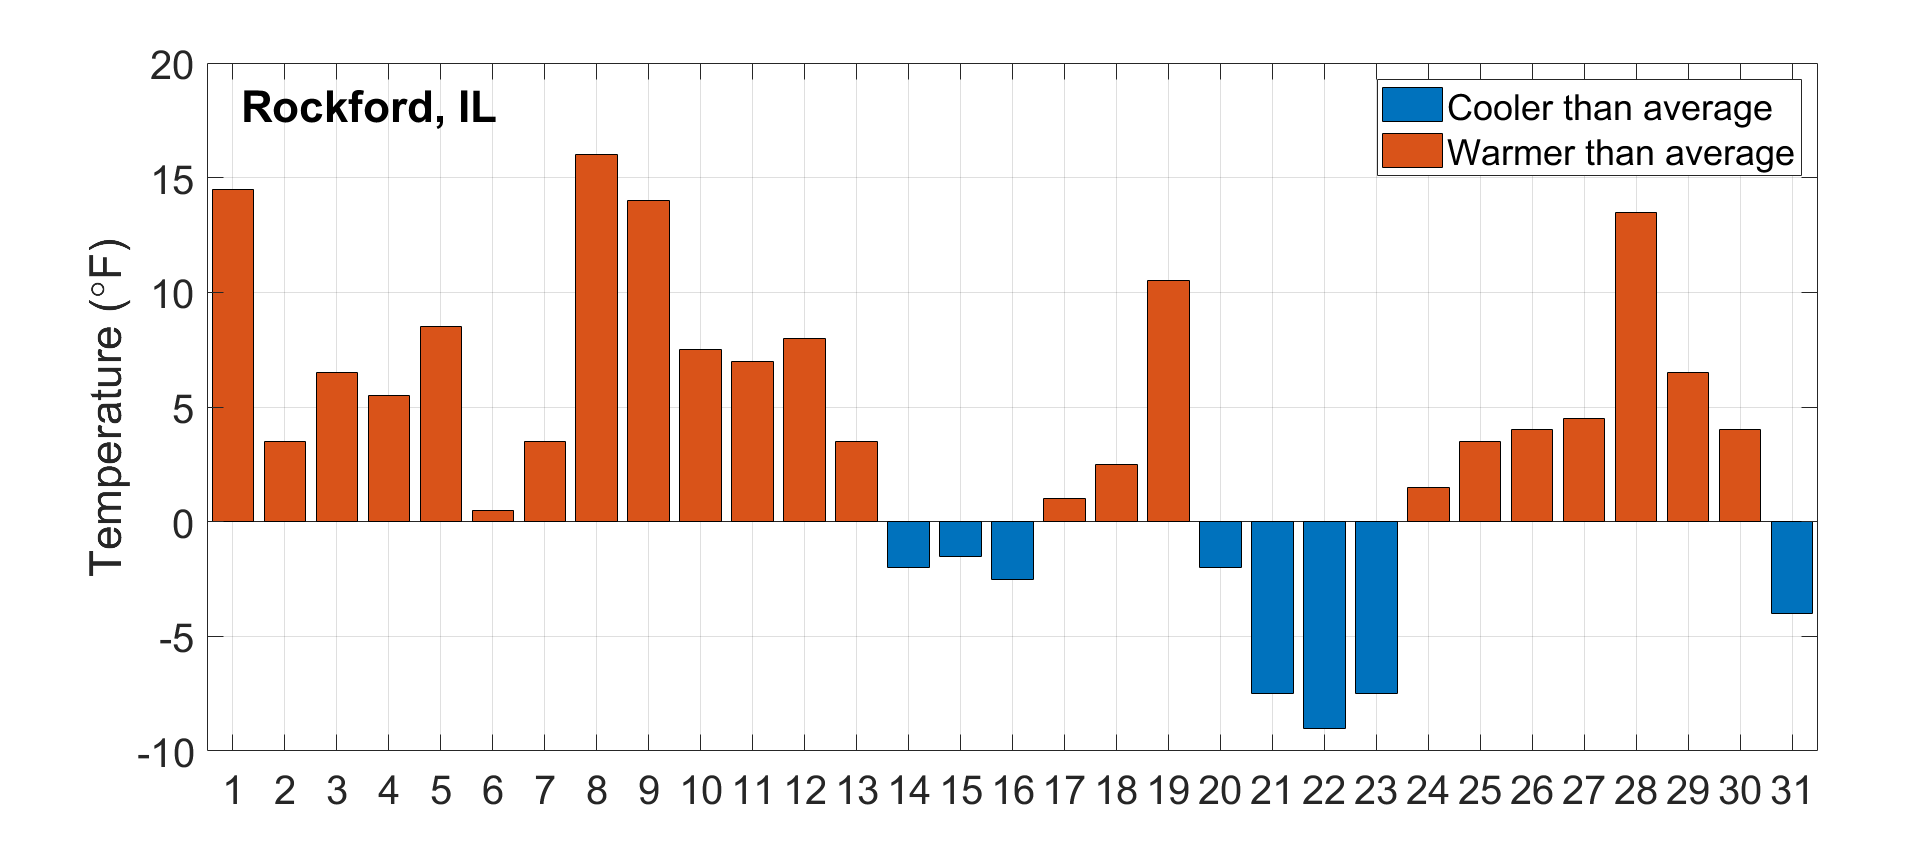
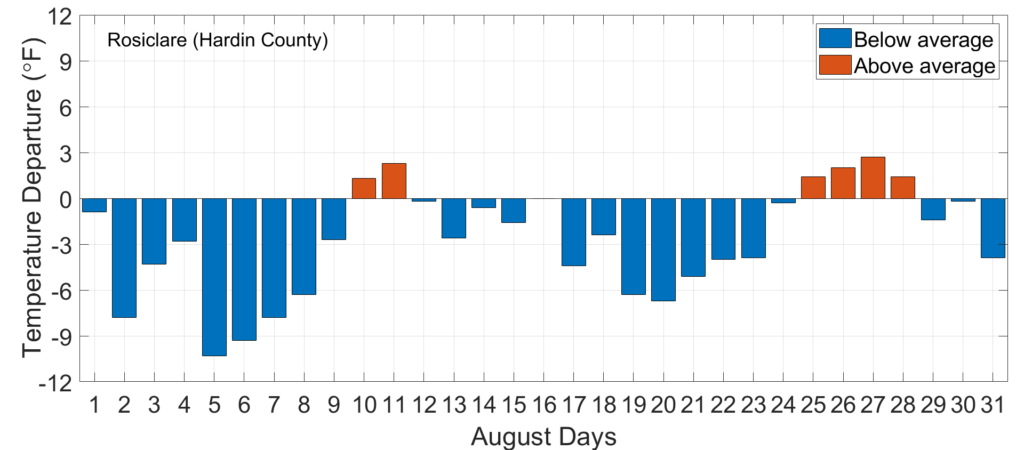
Although the fourth week of August was unusually warm in northern Illinois, temperatures were closer to average in southern Illinois. The plot below shows daily temperature departures in Rosiclare in Hardin County. The southeast Illinois climate division, containing Rosiclare, experienced its eighth coolest August on record.
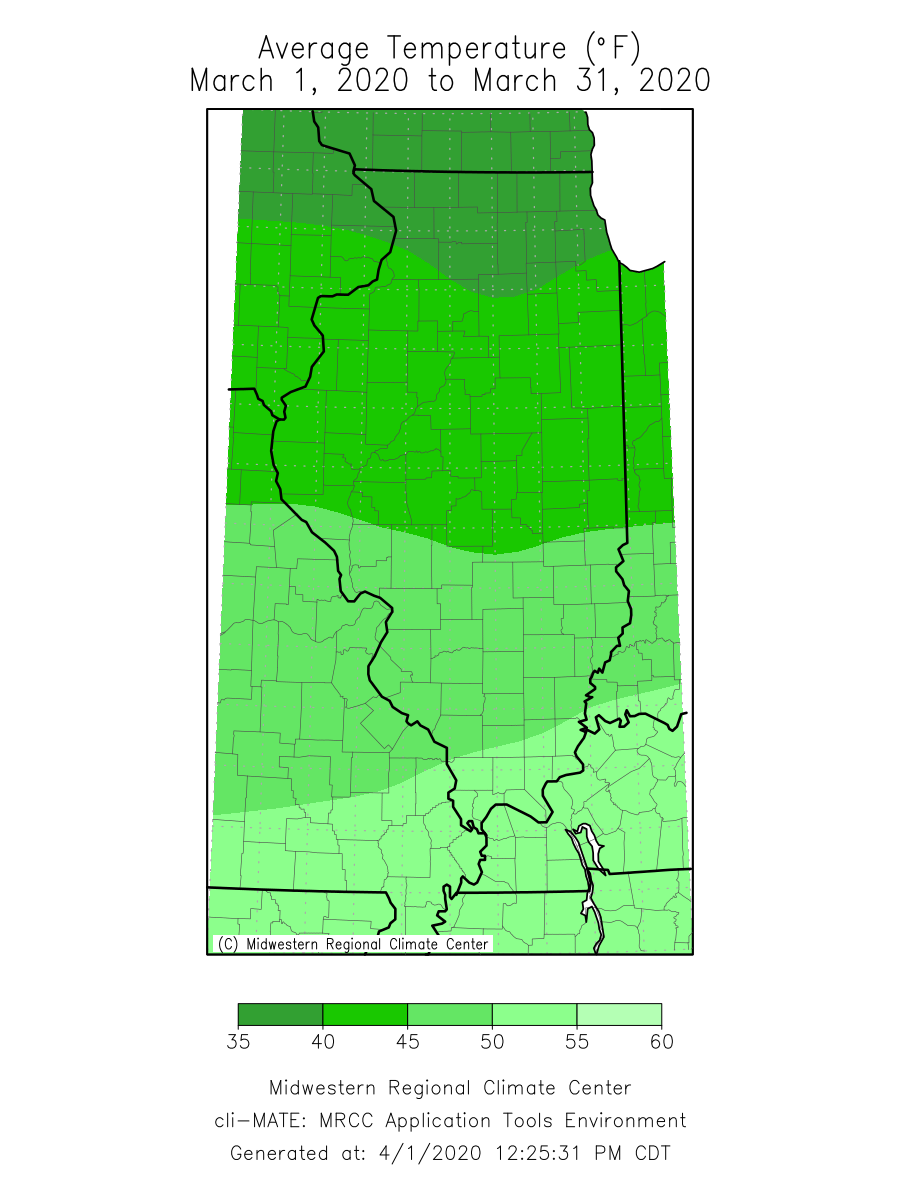
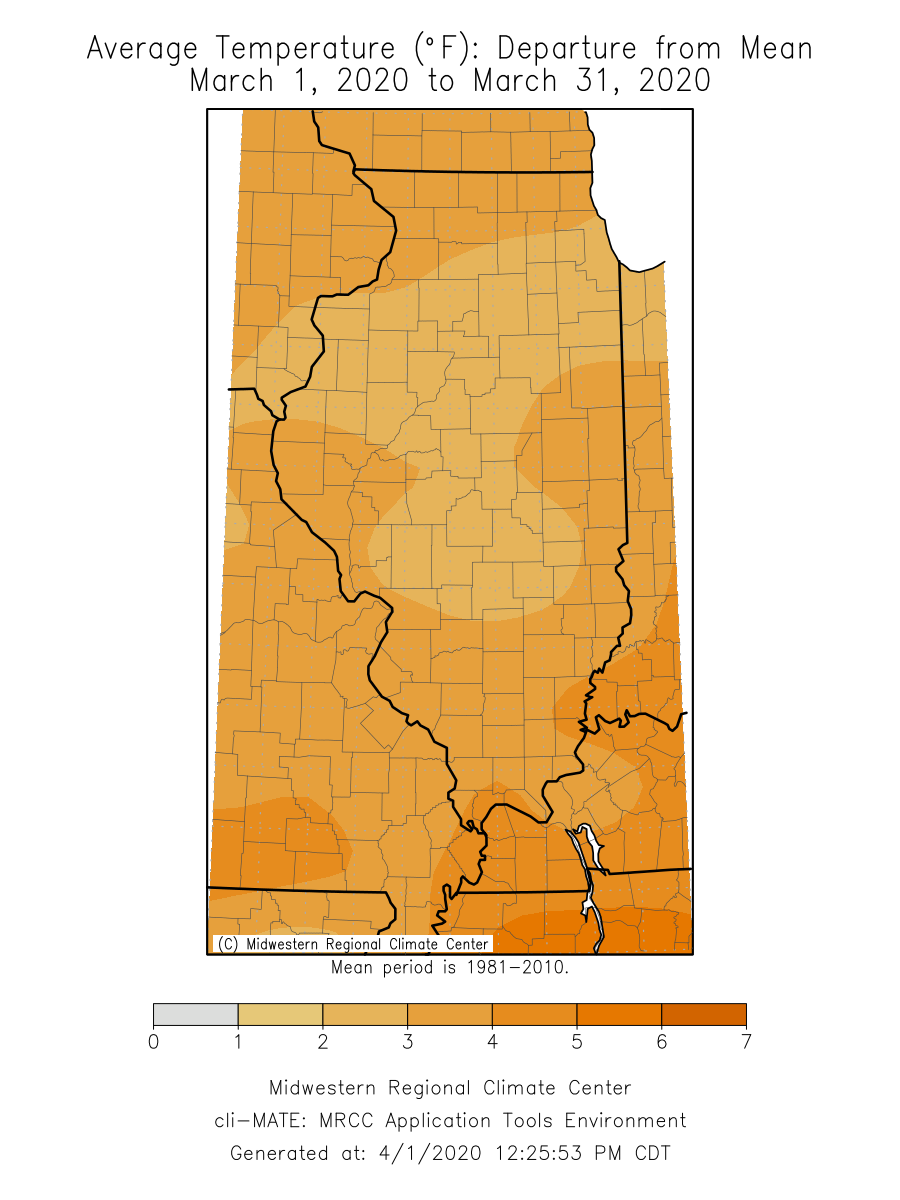
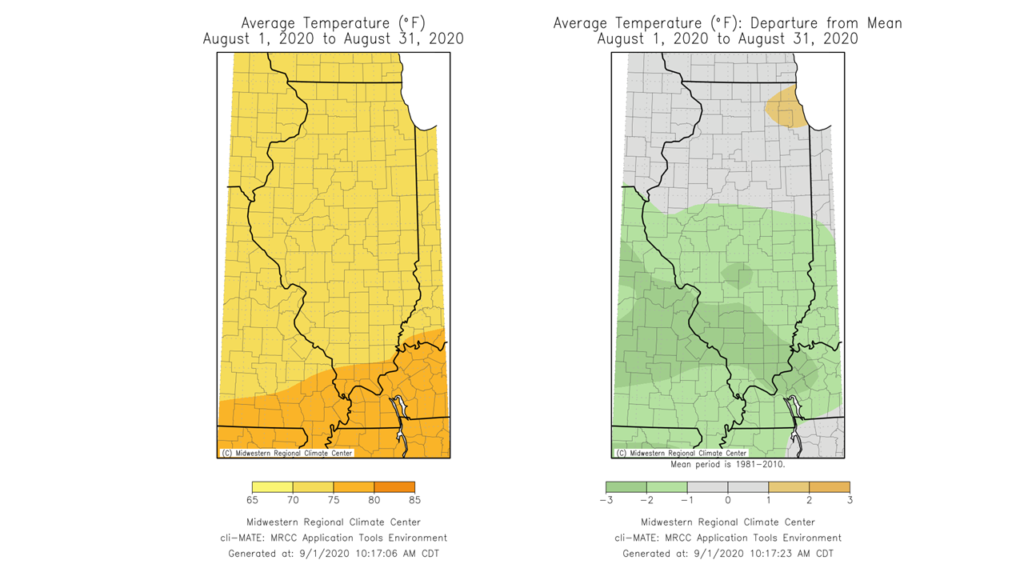
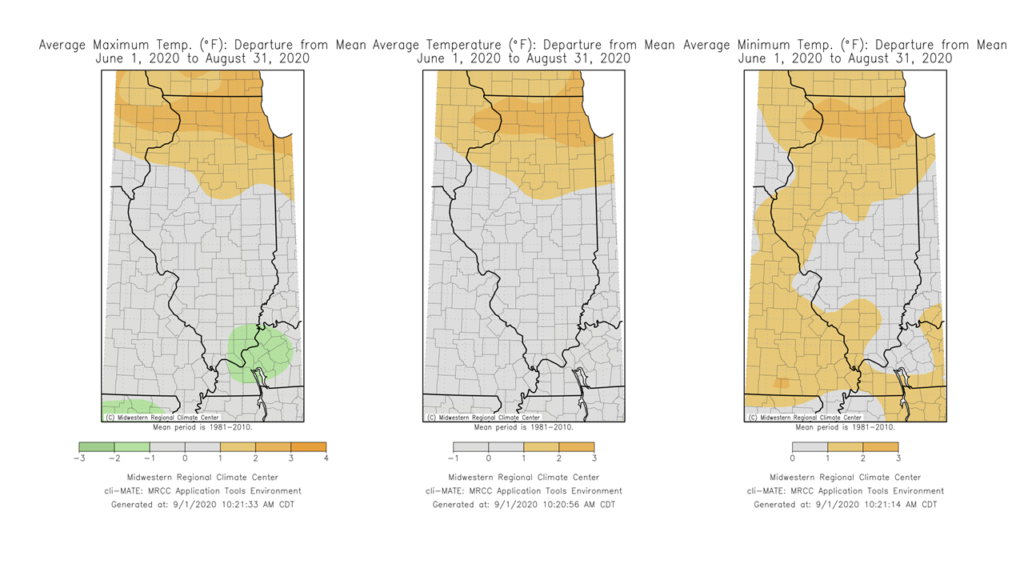
The statewide August temperature was 72.7 degrees, nearly 1 degree below the 30-year normal. The maps below show that average temperatures were in the mid- to high 70s across the state last month, very close to the long-term average in northern Illinois, and between 1 and 4 degrees below average in southern Illinois.
The maps below show the climatological summer (June–August) 2020 maximum, average, and minimum temperature departures from average. June and July this year were both in the top 30 warmest months on record, resulting in an overall warmer than average summer in northern Illinois. However, the cooler August pushed summer temperatures within a degree of the long-term average in most of southern and south-central Illinois.
August Derecho
August was not without its fair share of severe weather. On August 10, a strong mesoscale convective system moved across the Upper Midwest. The system intensified in the eastern Dakotas and caused a derecho–a widespread, long-lived windstorm–that impacted areas of Iowa, Illinois, Wisconsin, and Indiana. A derecho is characterized by strong straight-line winds that can exceed 75 mph and often affect areas between 250 and 500 miles. Dr. Marshall Shepherd at the University of Georgia provides an excellent description in his piece in Forbes: https://www.forbes.com/sites/marshallshepherd/2020/08/10/what-is-a-derecho/#44cb250c3b8e.
The derecho on August 10 produced observed winds exceeding 100 mph and estimated (from damage) wind gusts up to 140 mph across east-central Iowa. Based on initial reports, the derecho damaged between 6 and 10 million acres of crops across Iowa and northern Illinois. In addition, the winds caused significant damage and destruction in residential and urban areas. The city of Cedar Rapids, Iowa was hit particularly hard. The local newspaper reported estimates of over 20,000 trees downed in Cedar Rapids alone (https://www.thegazette.com/subject/news/derecho-by-the-digits-numbers-help-tell-the-story-of-the-storm-20200830), causing hundreds of thousands to lose power and remain without power for several days. The storm also resulted in four fatalities, three in Iowa and one in Indiana.
Along with the derecho, the storm produced 15 confirmed tornadoes in the Chicagoland area. The figure below is from the Chicago National Weather Service, showing the tracks of these tornadoes, including a couple that moved through the city of Chicago.
More research is necessary to better understand the environment that produces a derecho, and the corresponding warning of these events and risks they pose. One paper by Guastini and Bosart in Monthly Weather Review (https://journals.ametsoc.org/mwr/article/144/4/1363/72372) found northern Illinois experiences a derecho once every two years. However, not all derecho events are as large, long-lived, and intense as the event earlier last month.
Southern Illinois Remains Wet
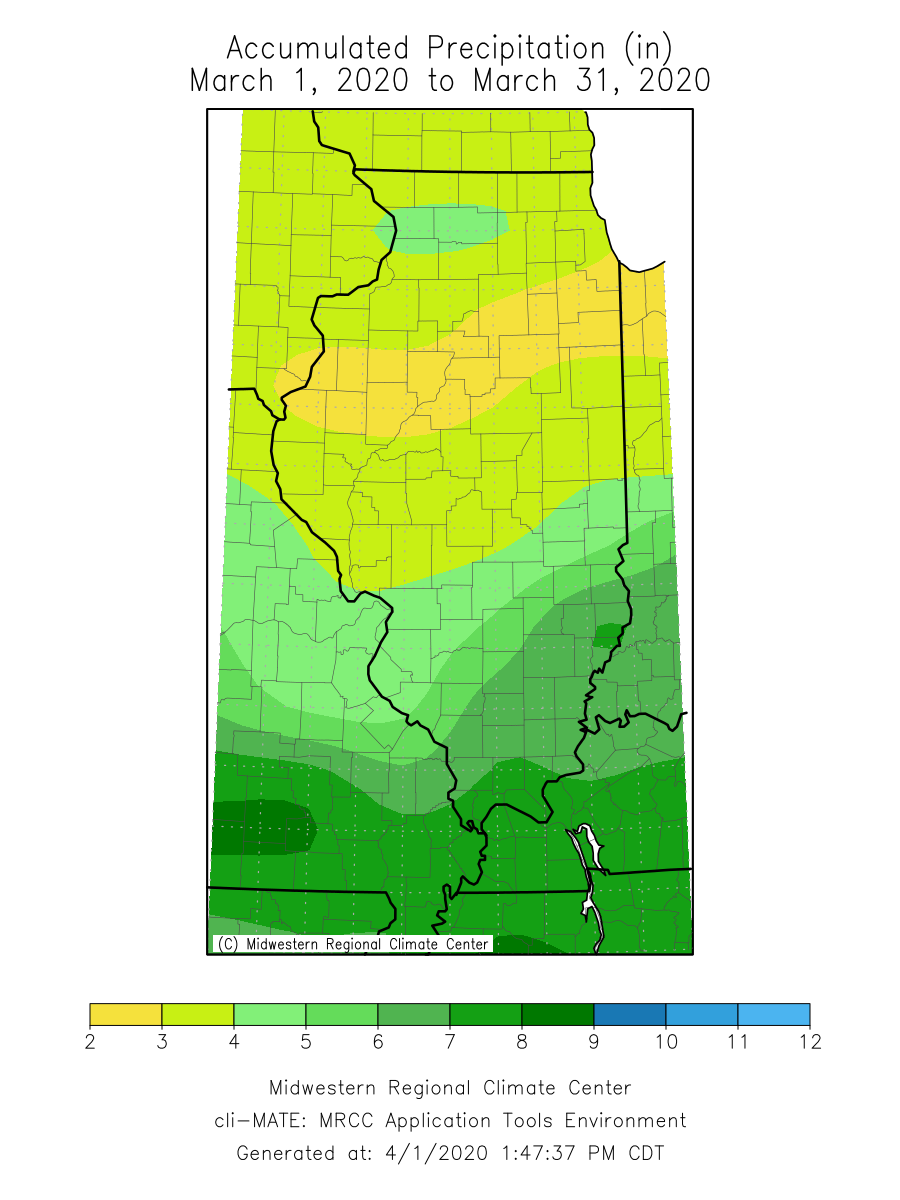
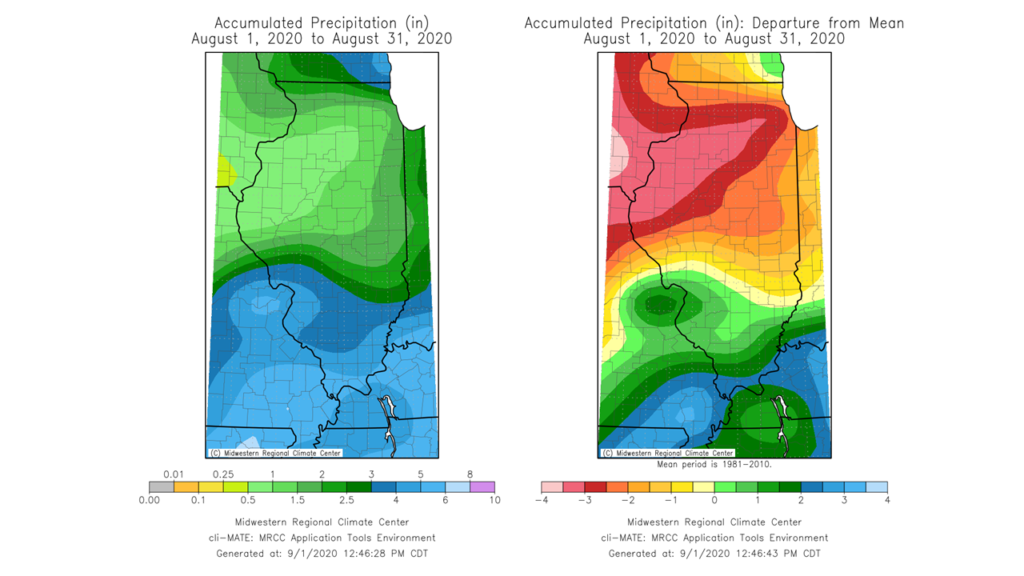
Statewide August total precipitation was 2.01 inches, 1.58 inches below the 30-year normal and the 15th driest on record. However, like the varying temperatures, the southern and northern halves of the state experienced two very different August precipitation patterns. The maps below show August total precipitation and departures from average across the state. August totals ranged from less than a quarter of an inch in northwest Illinois to over 8 inches in southwest Illinois. In general, the northern half of the state experienced 1 to 4 inches below average, while most of southern Illinois experienced a 1 to 3 inches above average rainfall last month.
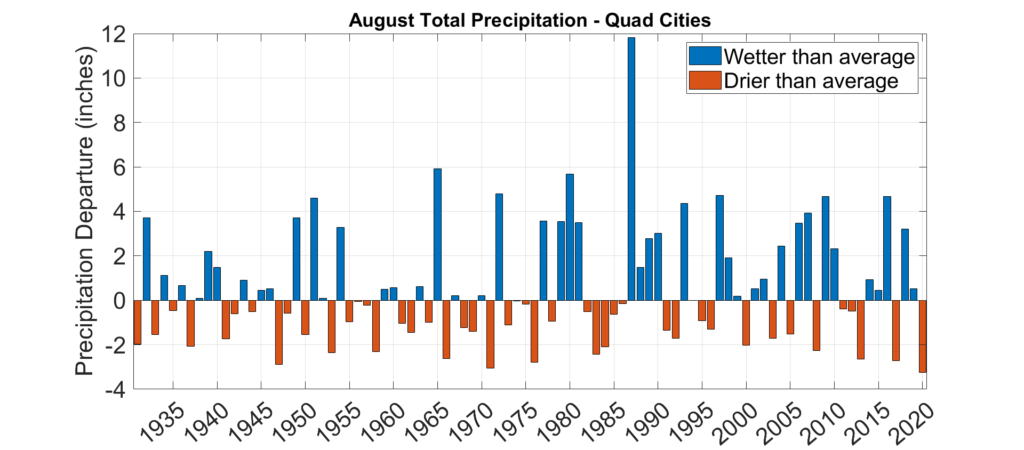
We can contrast the two halves of the state by comparing total rainfall in the Quad Cites with that in the St. Louis Metro East. The station at the Quad Cities Airport in Moline observed just 0.15 inches of total rain in August, which was less than half the previous low August total record of 0.35 inches in 1971 (see plot below).
As the Quad Cities experienced their driest August on record, the station at the SIU Research Farm in Belleville observed their wettest at over 10 inches of total rainfall last month. Of particular note was a strong thunderstorm that moved through the St. Louis area on August 12, producing heavy rainfall for the Metro East area. The station at Scott Air Force Base near Belleville recorded 5.36 inches in only three hours from this storm. The heavy rain produced flash flooding across the area, including multiple hangars on the base that were flooded. According to new estimates from the Illinois State Water Survey’s Bulletin 75 (https://www.ideals.illinois.edu/handle/2142/106653), this was approximately a 125-year rainfall event.
Northern Illinois Drought
July was slightly drier than average across most of northern Illinois. The first week of August was somewhat wet across the state; however, for most areas of northern and central Illinois, more rain fell in the first week of August than in the last three weeks of the month. The rainfall deficit was somewhat offset by below average temperatures during the first few weeks of the month. However, as heat began to set in and the northern half of the state experienced multiple, consecutive 90-degree days, the lack of moisture became quite apparent.
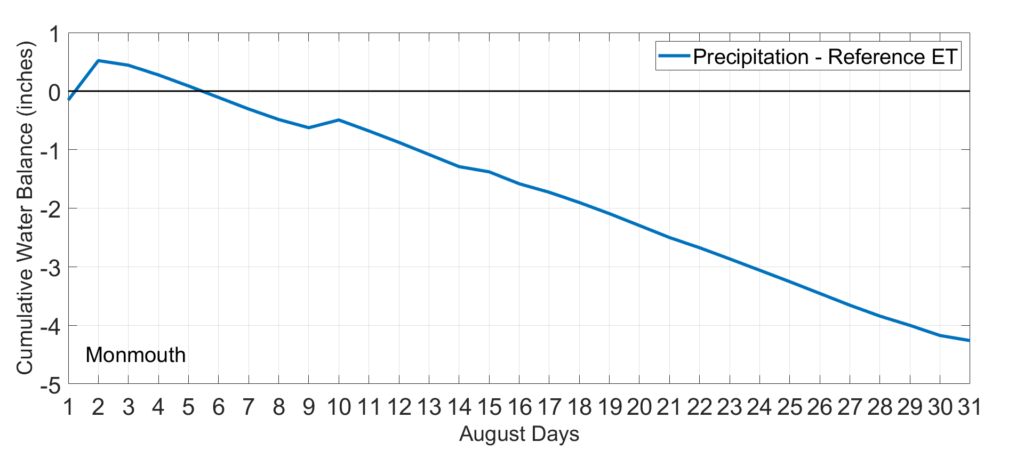
The plot below shows the daily accumulated difference between precipitation and reference evapotranspiration–an indicator of atmospheric evaporative demand–at the Illinois Climate Network Monmouth station. Looking at dry conditions through this lens provides a water balance perspective. The Monmouth record shows a positive water balance at the beginning of the month due to precipitation. However, the subsequent lack of rainfall after August 5 results in a negative water balance that is accelerated in the final weeks of the month. The station in Monmouth ended the month with an over 4-inch moisture deficit.
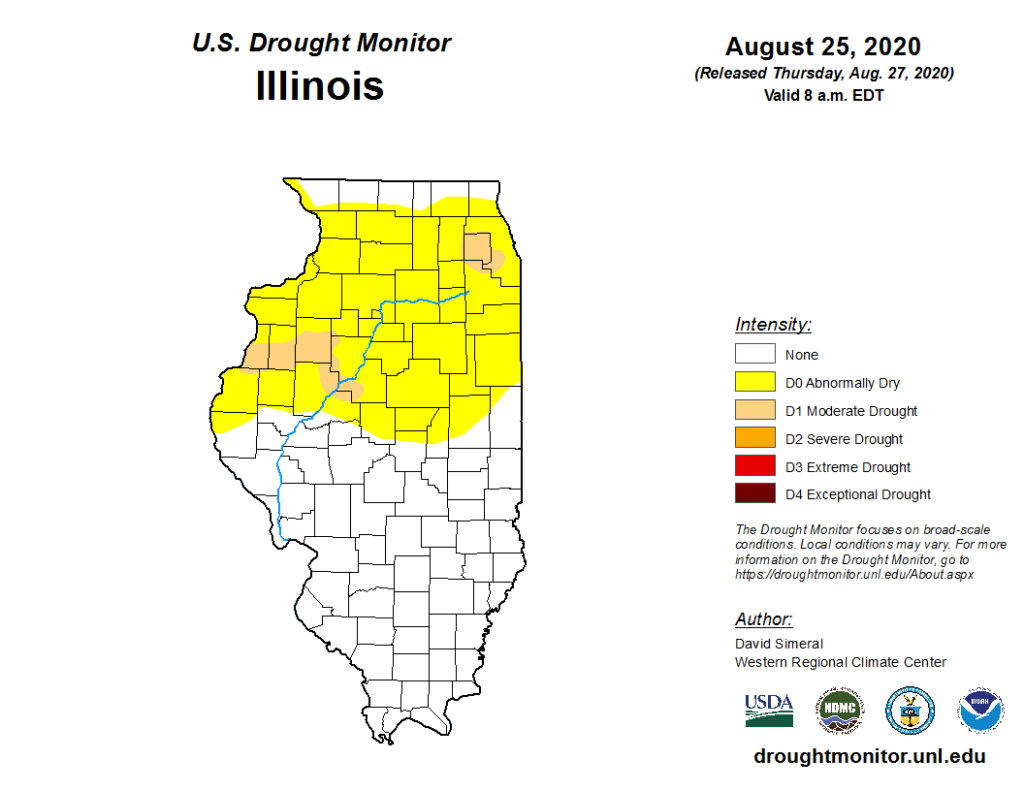
In response to pervasive dry conditions in northern Illinois, most of the area is considered abnormally dry in the August 25 edition of the U.S. Drought Monitor (below). There are also pockets of moderate drought in western and northeast Illinois in response to agricultural and ecological impacts of the dryness.
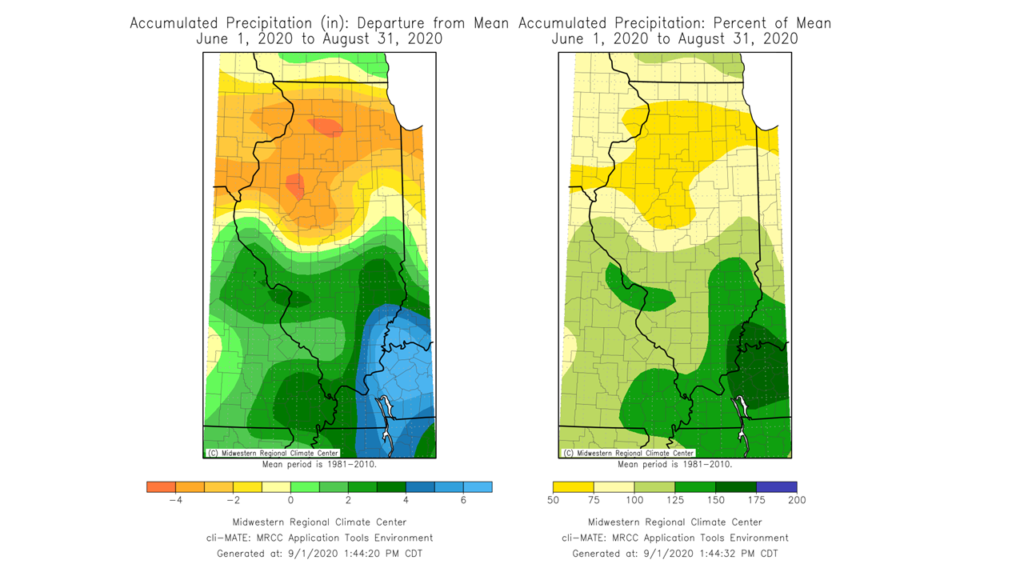
Climatological summer (June–August) precipitation patterns are like those in August, with contrasting conditions in northern and southern Illinois. The northern half of the state finished summer with between 1 and 4 inches below average precipitation, while southern Illinois was 1 to 6 inches wetter than average this last season. The official summer season rankings will be released later this month, but it is worth mentioning that statewide total summer precipitation has only been below the 30-year normal 3 out of the last 10 years (2017, 2013, and 2012).
Outlooks
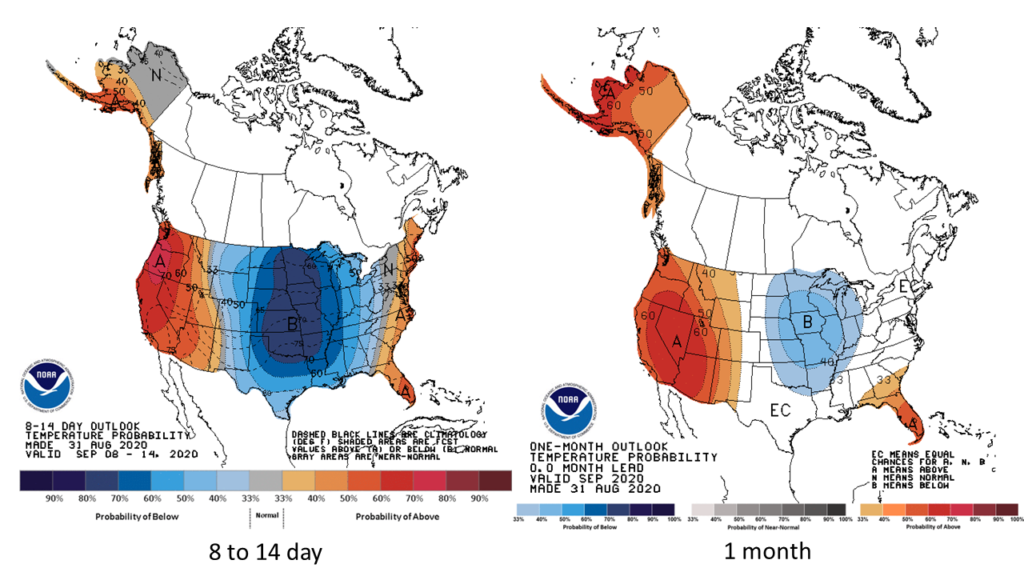
The late August heat will likely be replaced by cooler than average conditions throughout September. The Climate Prediction Center’s 8- to 14-day outlook and 1-month outlook both indicate strongly elevated odds of below normal temperatures.
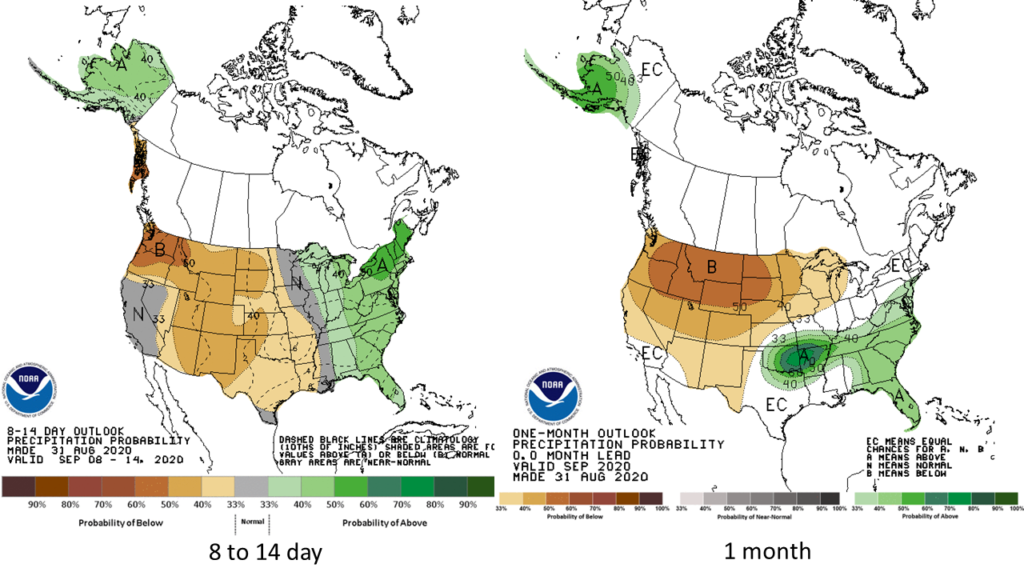
Precipitation outlooks are mixed. The 8- to 14-day outlook indicates weakly elevated odds of wetter than normal conditions in the eastern half of the state to start September, with near normal precipitation elsewhere. The one-month September outlook indicates weakly elevated odds of drier than normal conditions in northern Illinois, but equal odds of above and below normal precipitation elsewhere.
Cooler weather in September will help to temper ongoing drought in northern and central Illinois. However, September is one of the drier months in Illinois, and given the outlooks, it is unlikely that dry conditions will be completely alleviated.
March was warmer and wetter than average across the state, continuing the pattern from winter. The preliminary statewide average March temperature was 43.5 degrees, 2.20 degrees above the 30-year normal and the 28th warmest on record going back to 1895. Preliminary statewide average total March precipitation was 3.96 inches, 1 inch wetter than the 30-year normal and tied for the 34th wettest on record.
Data are provisional and may change slightly over time
Persistent Warmth in March
Much like the first two months of 2020, March temperatures were consistently above the long-term average.
The first two months of the climatological winter season were much warmer than average, with very few cold air incursions. The plot below shows the March daily average temperature as a departure from average in Rockford. Since the start of 2020, over 70 percent of days in Rockford have been warmer than the long-term average. This has caused 2-inch and 4-inch soil temperatures to generally remain above freezing over this time, according to observations from the Illinois Climate Network (https://www.isws.illinois.edu/warm/soil/).
Average temperatures in March ranged from the high 30s in northern Illinois to the low 50s in southern Illinois. Temperatures ranged between 1 and 5 degrees above the long-term average. The statewide average March temperature was 43.5 degrees, which is 2.20 degrees above the 30-year normal and tied for the 28th warmest on record. March marked the fourth consecutive month with statewide average temperatures above the 30-year normal. By comparison, the first three months of 2019 were all 1 to 3 degrees below the 30-year normal, considerably cooler than 2020 so far.
The warm weather in March resulted in three daily high maximum temperature records and seven daily high minimum temperature records being broken across the state. The few cold, cloudy days we had in March also resulted in six daily low maximum temperature records and one daily low minimum temperature record being broken across the state. The long-running station in Carbondale was only 1 degree away from its all-time March high minimum temperature record on March 28, thanks to a strong mid-latitude warm sector bringing warm air from the south. Multiple stations in southern Illinois recorded daily maximum temperatures at or over 80 degrees during the last week in March. At one of these stations, Fairfield in Wayne County, this was two weeks before the average first 80-degree day based on the long-term record.
The highest temperature recorded in the state in March was 81 degrees in Alexander, Pope, and Hardin Counties, while the lowest temperature was 8 degrees in Jo Daviess, Knox, and Whiteside Counties.
Storms Bring Heavy Rain to Northern and Southern Illinois
Frequent precipitation persisted from February into March for the southern part of the state. Most areas south of Interstate 64 received over 6 inches of total precipitation in March, and some areas received over 8 inches. This represents between 150 percent and 200 percent of normal March precipitation in southern Illinois (see map below). Most stations in southern Illinois received 50 percent or more of their total March precipitation in one 24-hour period between March 20 and 21, thanks to a series of storms that tracked across the region.
One-day precipitation totals reached 4.50 inches in Clay County, which set the all-time March one-day precipitation record at the station in Clay City and broke the previous record by over three-quarters of an inch. Other large one-day totals from the March 20 storms included 3.85 inches in Mt. Vernon in Jefferson County and 3.55 inches in Olney in Richland County. With these one-day totals subtracted, March 2020 was very close to March 2019 total precipitation in southern Illinois; however, because of this event, most areas in southeast Illinois received between 1.5 and 2.5 times the amount of March 2019 precipitation this month.
Although March precipitation totals in northern Illinois were not as generous as those in the south, northern Illinois was not averse to very large one-day precipitation totals. A series of storms that moved through on March 28 generated between 3 and 4 inches of precipitation in a less than 24-hour period for a stretch of Illinois between the Quad Cities and the western suburbs. One CoCoRaHS observer in Prophetstown in Whiteside County recorded 5.34 inches on this day. Unfortunately, the heaviest precipitation missed the longer-term COOP stations in the region, but the storm did manage to break the all-time March one-day precipitation total in DeKalb.
Total March precipitation ranged from over 8 inches in far southern and southeast Illinois to just over 2 inches in central Illinois. These totals ranged from over 200 percent of average March precipitation in southeastern and northern Illinois to just over 75 percent of average March precipitation in western Illinois. Most of central Illinois received between 75 percent and 125 percent of average March precipitation. This combined with above average temperatures allowed soils to dry a bit across central and western Illinois.
Last month was the wettest March on record at Rock Island Lock & Dam 15, with 6.17 inches recorded. The wettest place in the state last month was Clay City with 8.31 inches.
Overall, the preliminary statewide average total March precipitation was 3.96 inches, exactly 1 inch more than the 30-year normal and the 34th wettest on record. Although the March average does not reflect the 5- to 6-inch differences in precipitation between central and northern/southern Illinois.
Most of the northern half of the state experienced measurable snowfall last month. March totals ranged from around 6 inches in northeast Illinois to just over one-tenth of an inch along the Interstate 70 corridor. A winter storm on March 22 and 23 accounted for the vast majority of snowfall in the northern part of the state, with one-day totals exceeding 6 inches in Grundy County. Morris in Grundy County was the snowiest point in the state in March, with just over 7 inches of total snowfall.
March total snowfall departures mimic the spatial patterns for the entire winter season. Most areas of western, northwest, and west-central Illinois had totals within 5 inches of the long-term average, whereas most counties south of Interstate 70 as well as counties in the Chicagoland metro area have experienced 5 to 10 inches below average snowfall since the first snow of the season.
Severe Weather
Illinois experiences severe weather and storms in all calendar months, but March often begins the unofficial severe weather season. This last month we had numerous severe weather and storm reports, ranging from snowstorms to large hail and a few tornadoes. Trained spotters reported 2-inch hail in both Williamson and Vermilion Counties last month, with many more reports of 1.5- to 1.75-inch hail across southern and central Illinois. The AWOS station in Hyde Park in Cook County recorded a 61 mph non-thunderstorm wind gust on March 29. Finally, multiple tornadoes were reported in Illinois last month in southern and west-central Illinois, including three tornadoes between Peoria and the Quad Cities on March 28. One of these, an EF-1 tornado, developed just a quarter mile east of the Peoria International Airport, according to the Lincoln National Weather Service https://www.weather.gov/ilx/032820Tornadoes).
Outlooks
Short-term 8-14-day outlooks from the NOAA Climate Prediction Center show strongly elevated odds of both above normal precipitation and above normal temperatures across the state.
Longer-term 30-day outlooks are similar to the 8-14 day outlooks, with continued elevated chances of warmer and wetter conditions across the state for April.
Heavy precipitation in northwest and southern Illinois, combined with continual snowmelt in the Upper Midwest has continued the threat of flooding along most major rivers in Illinois. Currently, gauges along the Mississippi, Ohio, Illinois, and Wabash Rivers are at or above minor flood stage, with nine gauges in moderate flooding, according to the National Weather Service River Forecast Center.
As of April 25, the statewide average precipitation for Illinois is 2.8 inches, which is 94% of normal. However, we have several opportunities for widespread rains this week and into the weekend, according to the NWS precipitation forecast.
The first round of rain on Wednesday and Thursday has potential rainfall amounts of 1 to 2 inches across most of Illinois, along with the chance for severe weather. Continue reading “Widespread, heavy rains possible over next week in Illinois”