October: Heat to Snow

We saw highly variable temperatures across the state this month, with record-breaking heat in the early part of October, and record-breaking cold in the latter part. The preliminary statewide October average temperature was 53.7 degrees, less than 1 degree below our 30-year normal. Temperatures were near normal in eastern Illinois, and between 2 and 6 degrees below normal across western Illinois. Preliminary data suggest October was considerably wetter than normal for the entire state. The statewide average October precipitation total was 5.20 inches, approximately 2 inches above the 30-year normal. The wet deviations were particularly large in the northern and southern reaches of the state.

Data are provisional and may change slightly over time

Temperature Variability

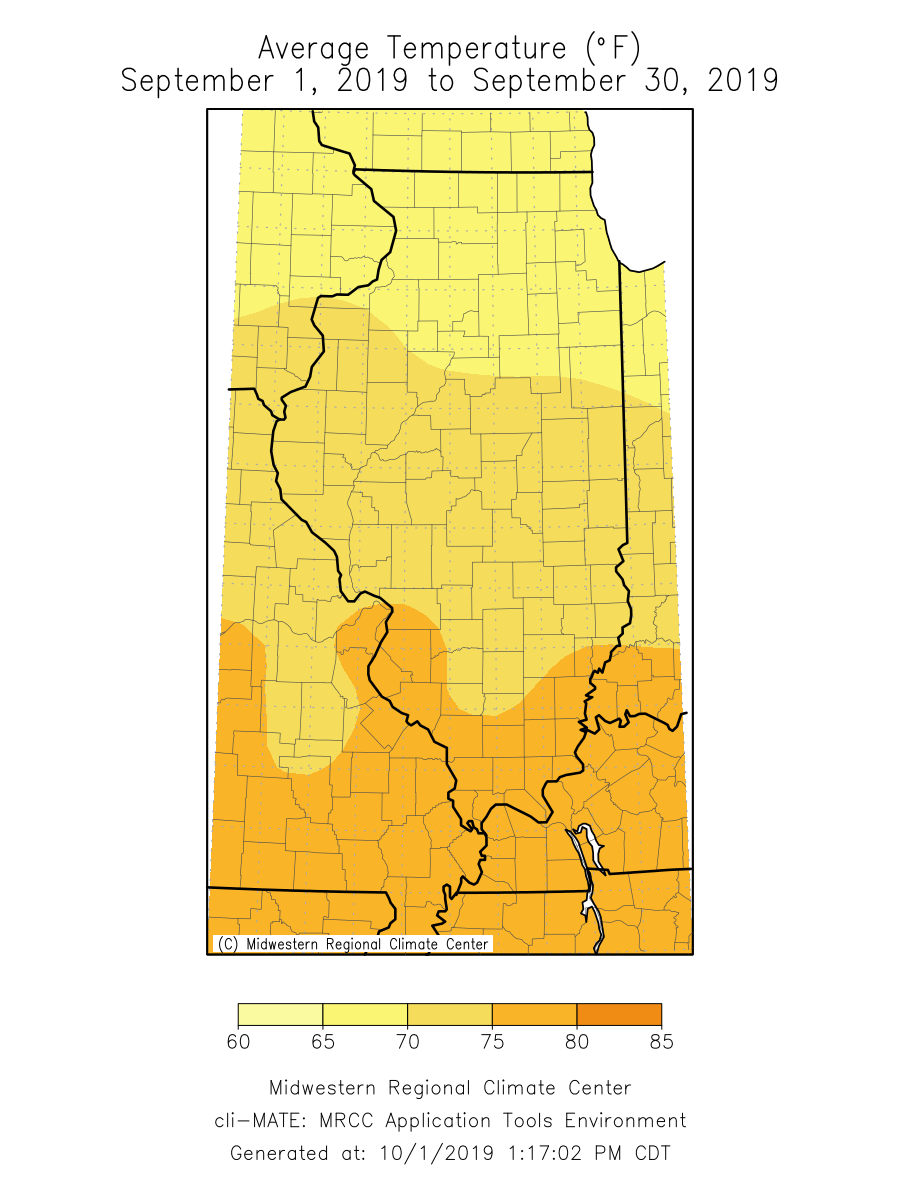
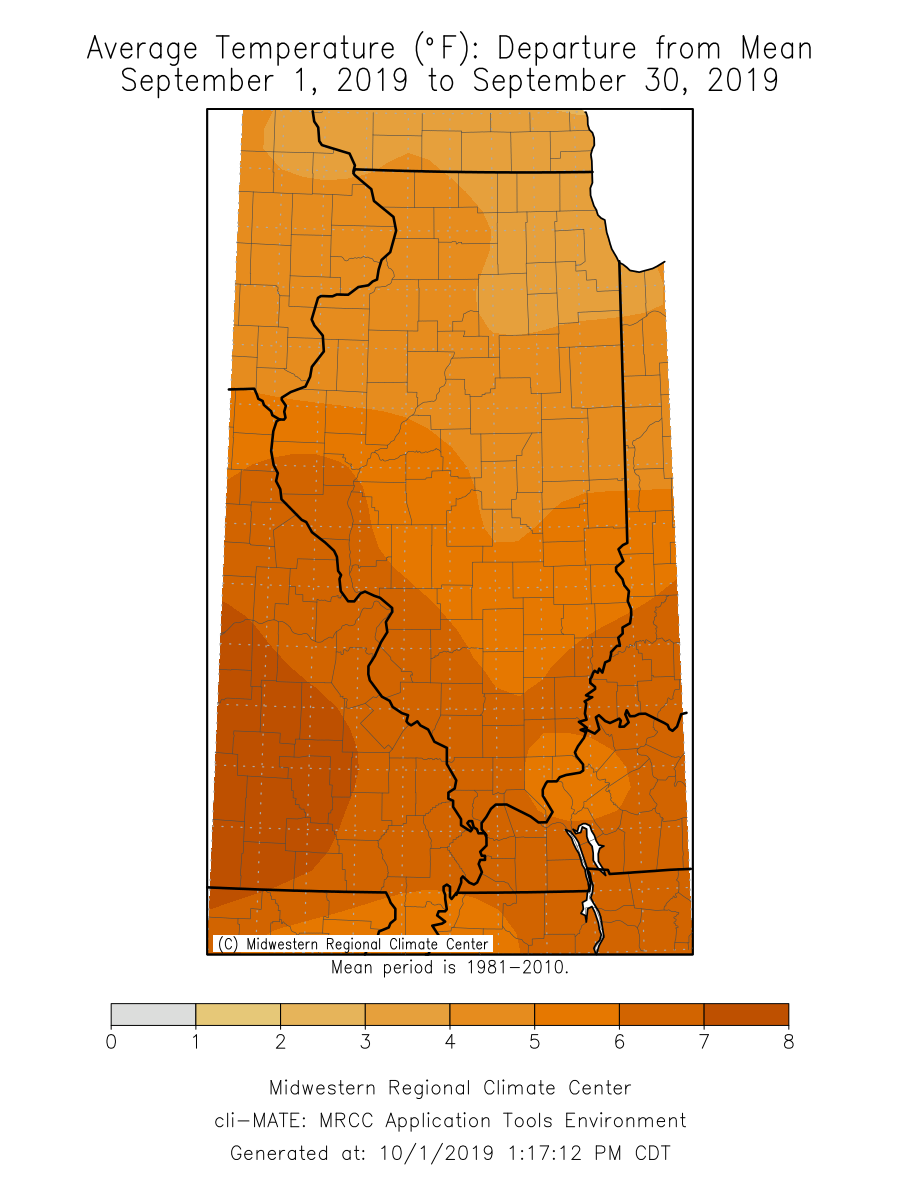
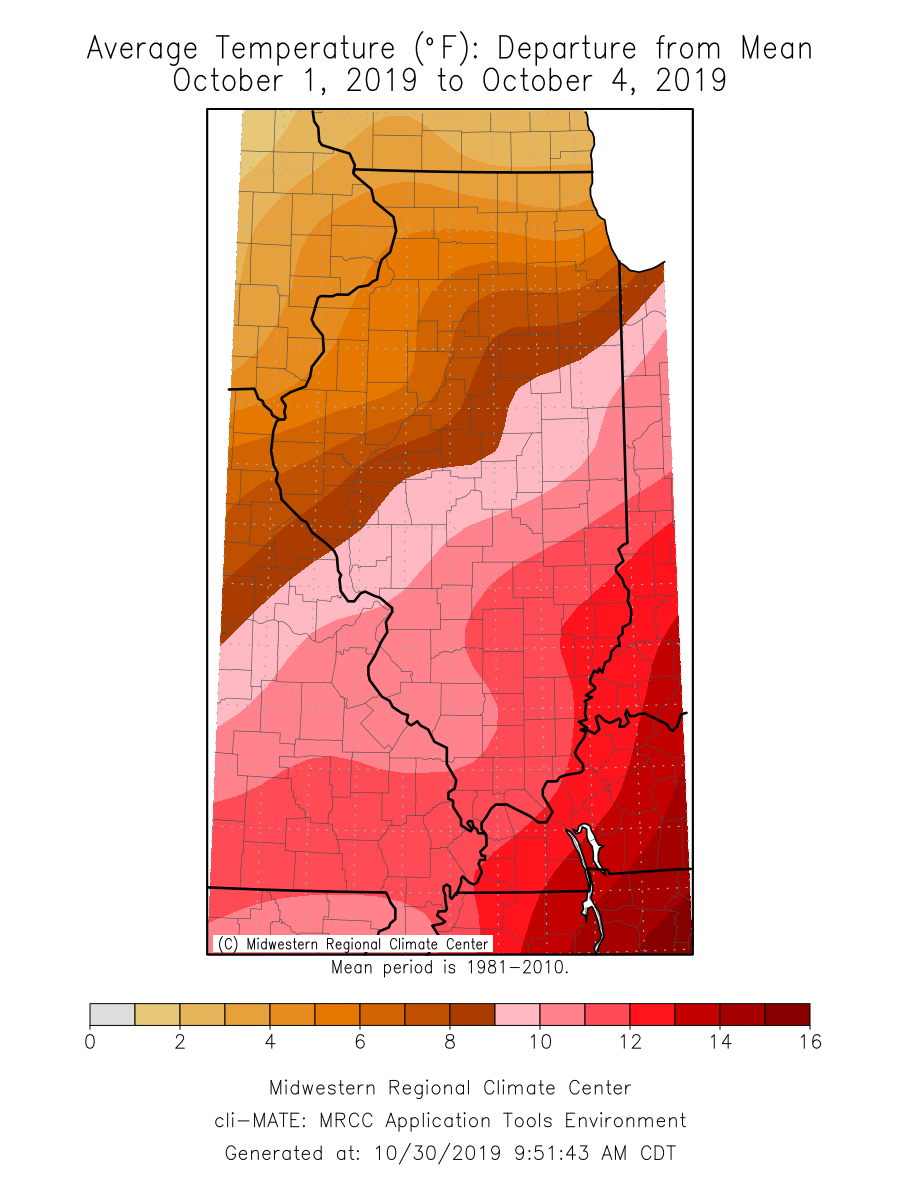
Record-breaking high temperatures persisted from September into early October. Average temperatures during the first four days of October were 10 to 14 degrees above normal in the southeast part of the state, and 3 to 8 degrees above normal for the northwest part (see map below). Maximum temperatures broke 90 degrees and minimum temperatures remained in the 70s for several days in southern Illinois. Stations in Saint Clair and White Counties reached 96 degrees on October 2.  Between October 1 and October 4, 46 daily high maximum temperature records and 73 daily high minimum temperature records were broken across Illinois, according to the NOAA National Centers for Environmental Information (NCEI). Additionally, 9 stations broke their all-time October high maximum temperature records, and 13 stations broke their all-time October high minimum temperature records. In one particularly extreme event, the October 1 nighttime minimum temperature at Kaskaskia Lock and Dam in Randolph County was 72 degrees, 10 degrees above the previous daily record and 2 degrees above the all-time October minimum temperature record at that station.

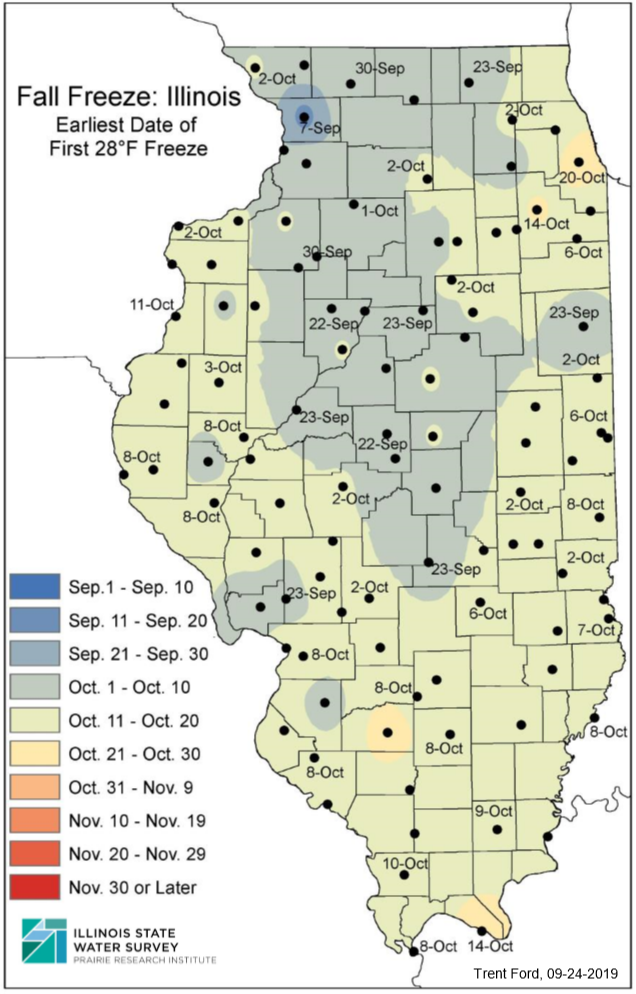
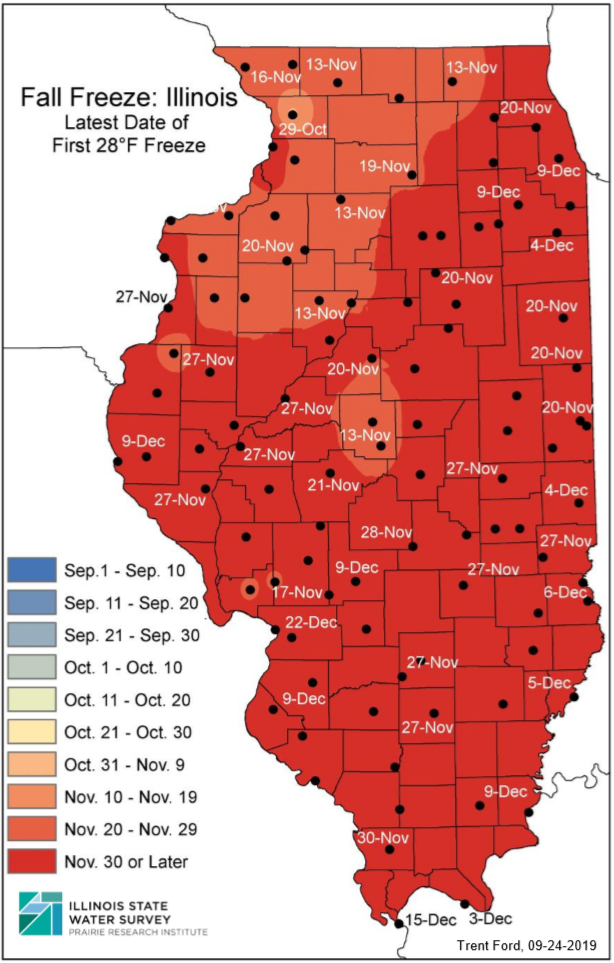
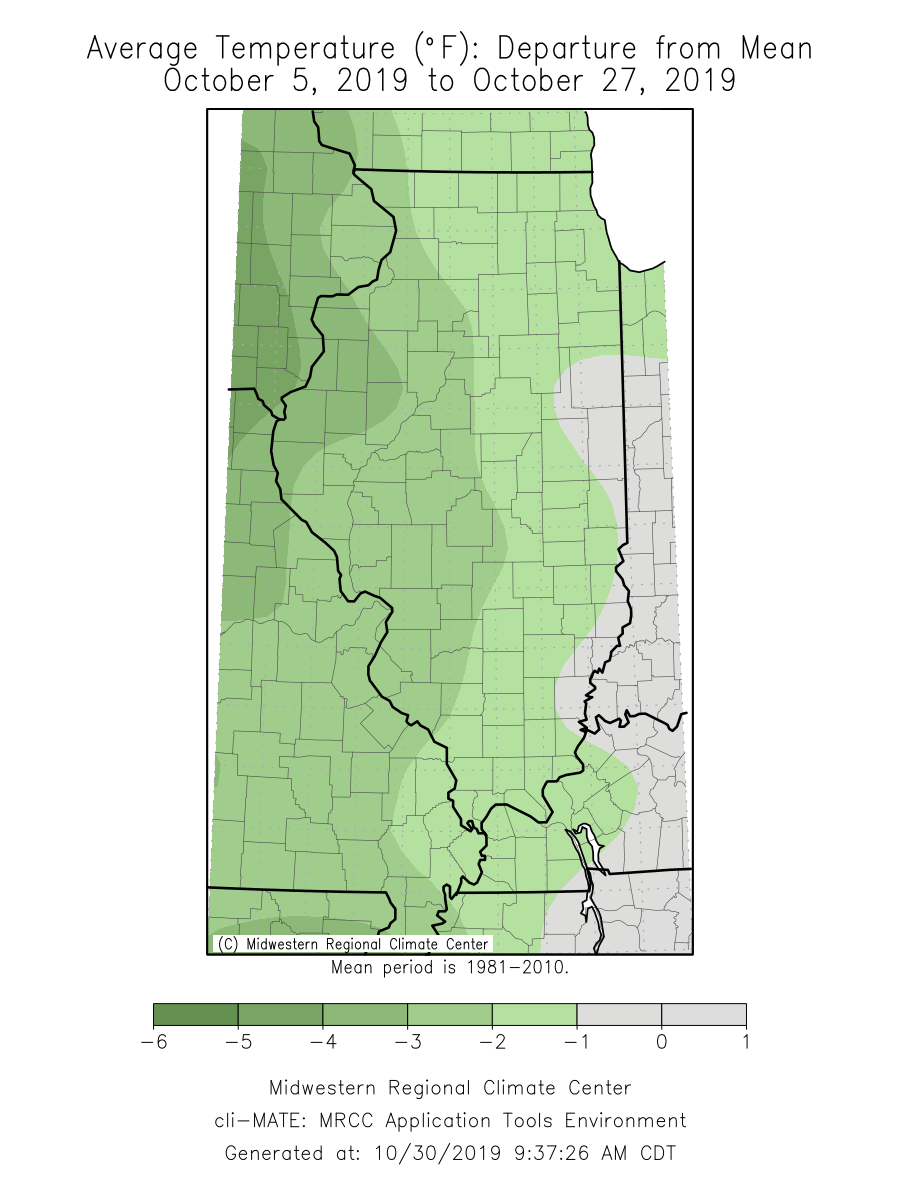
Seasonable temperatures ensued after the heat was broken toward the end of the first week of October. Temperatures from October 5 to October 27 were near normal in eastern Illinois and between 3 and 6 degrees below normal for western Illinois (see map below). Nearly all the state experienced the first fall frost event in the second week of October. Nighttime minimum temperatures dipped below 32 degrees as far south as Pope County and below 28 degrees in Warren and Jo Daviess Counties.

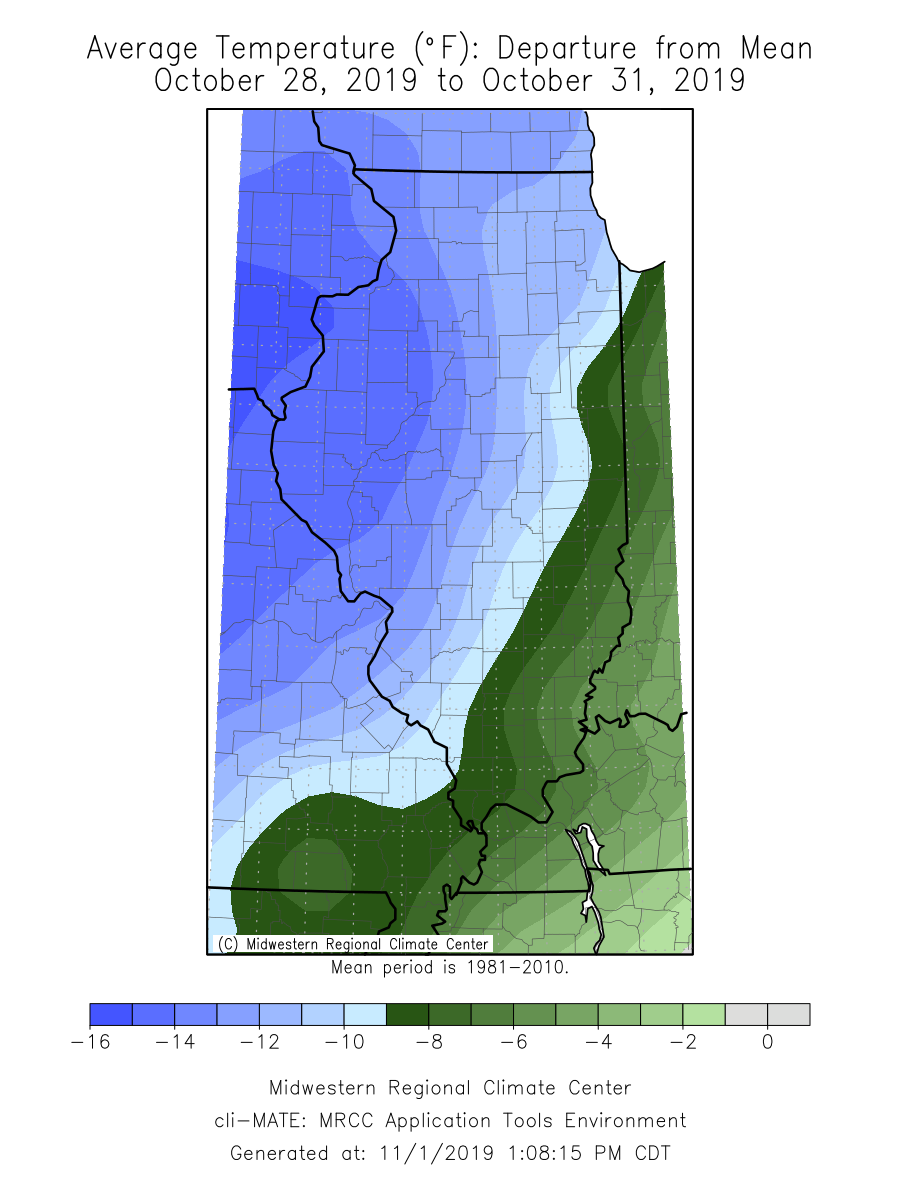
The heat wave that started the month was matched by a strong burst of cold air to close out the month. Temperatures between October 28 and October 31 were 8 to 16 degrees below normal. Similarly, 48 daily low maximum temperature records and 12 daily low minimum temperature records were broken across Illinois over the last four days of the month. Nighttime minimum temperatures dropped below 30 degrees as far south as Pulaski County. The lowest minimum temperature observed in October was 14 degrees in both Carroll and Lee Counties on Halloween night. Halloween was also the coldest on record for 51 stations across Illinois.

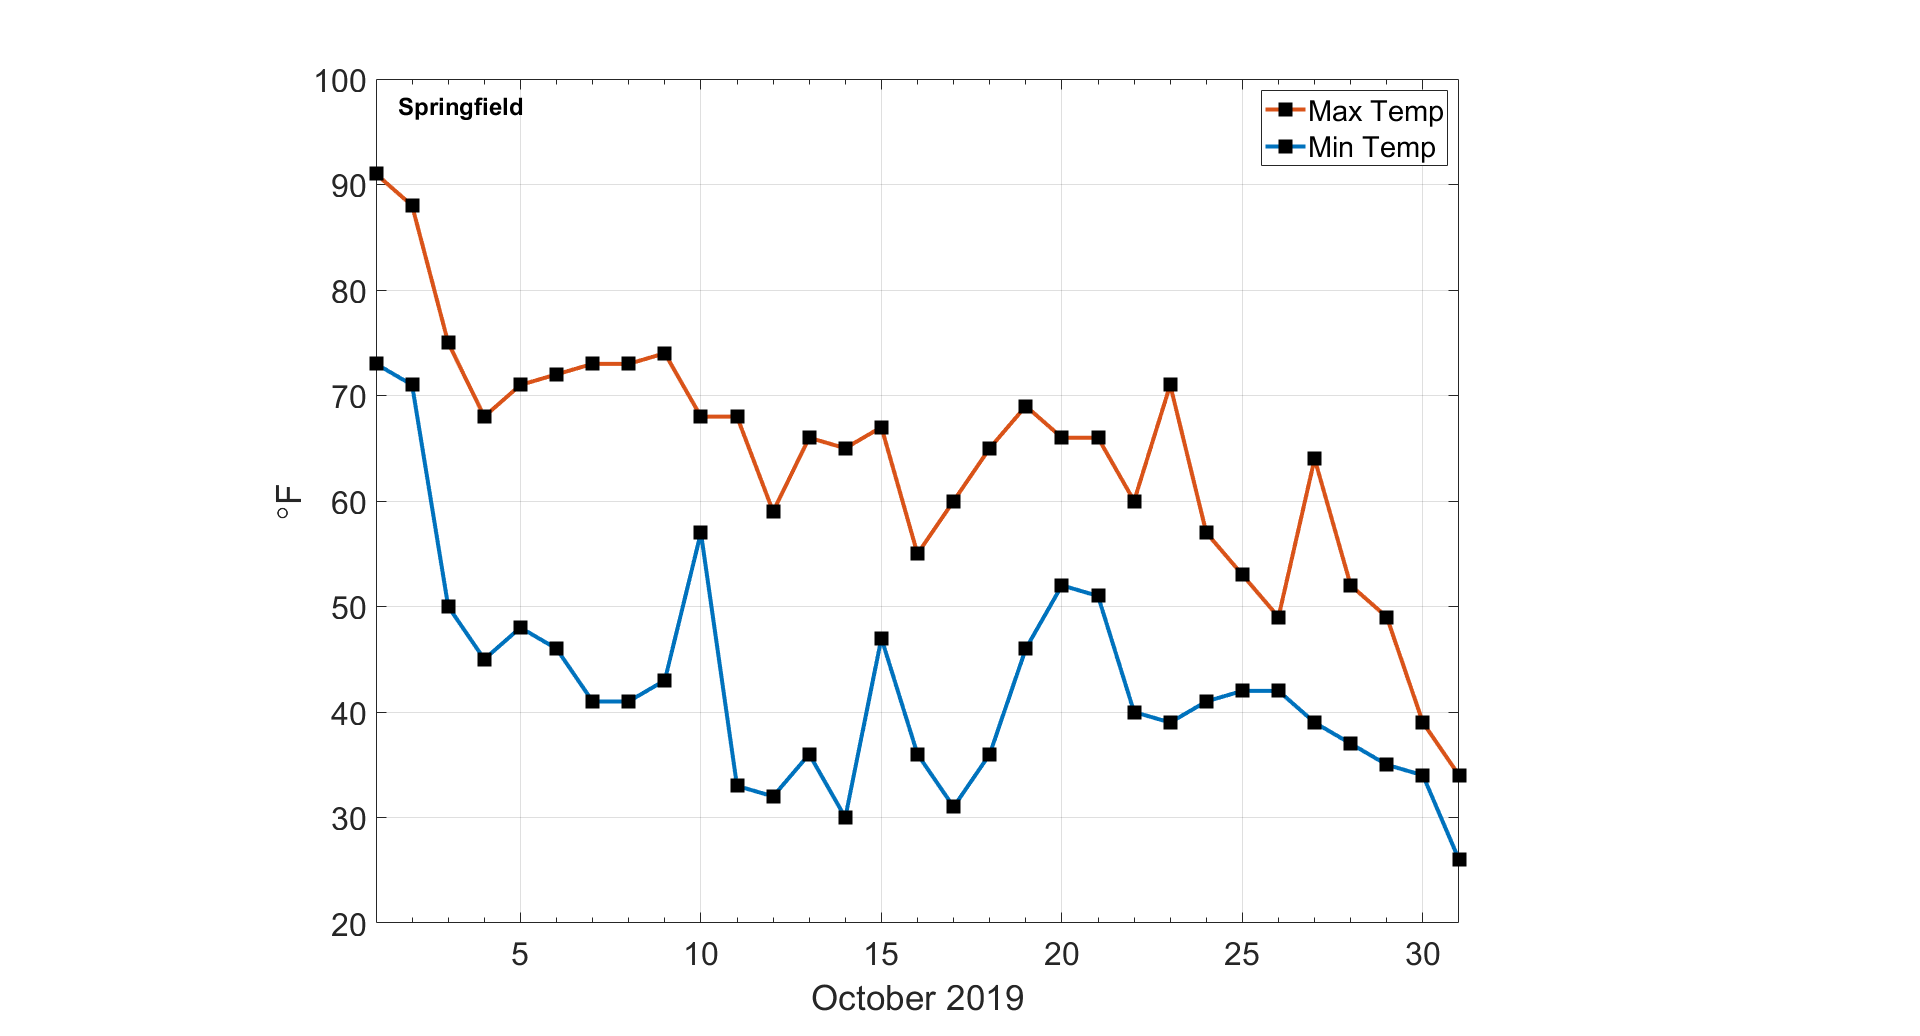
The temperature contrast between the start and end of this month may be best summarized in the graph below, which shows daily maximum and minimum temperatures at Springfield Abraham Lincoln Capital Airport this last month. There was a 57° difference between daily maximum temperatures on October 1st and October 31st in Springfield, both of which broke daily records. In fact, 10 Illinois COOP stations broke their daily high maximum temperature record on October 1st and their daily low maximum temperature record on October 31st.

Precipitation

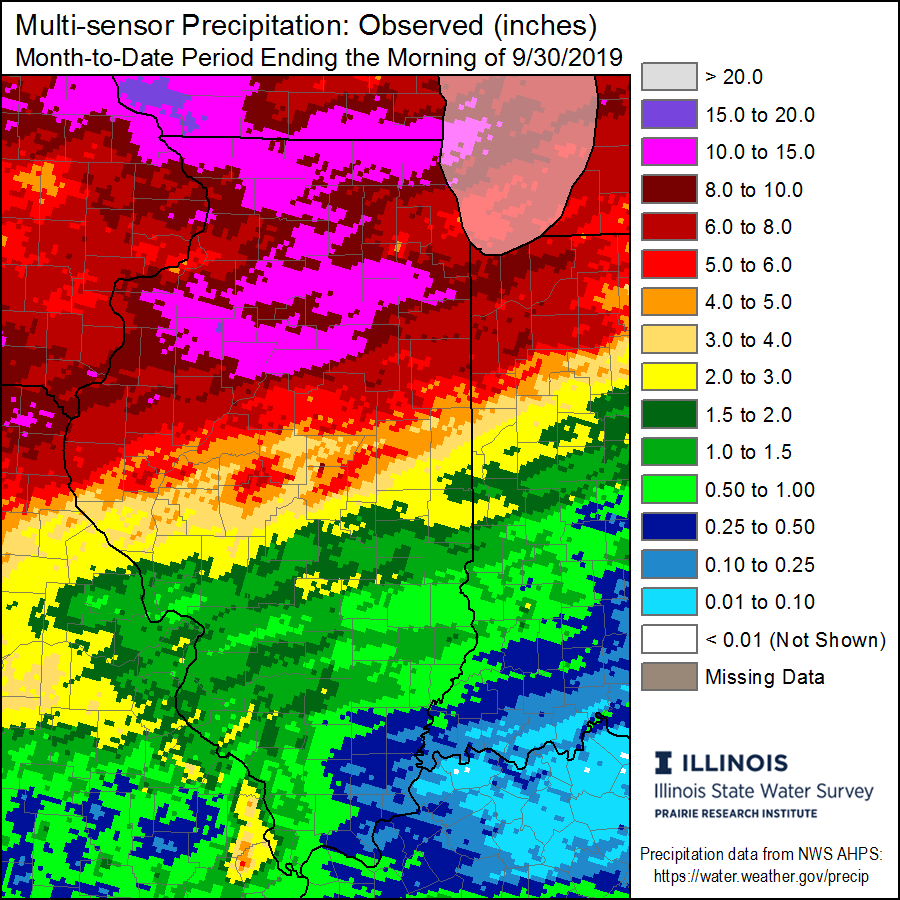
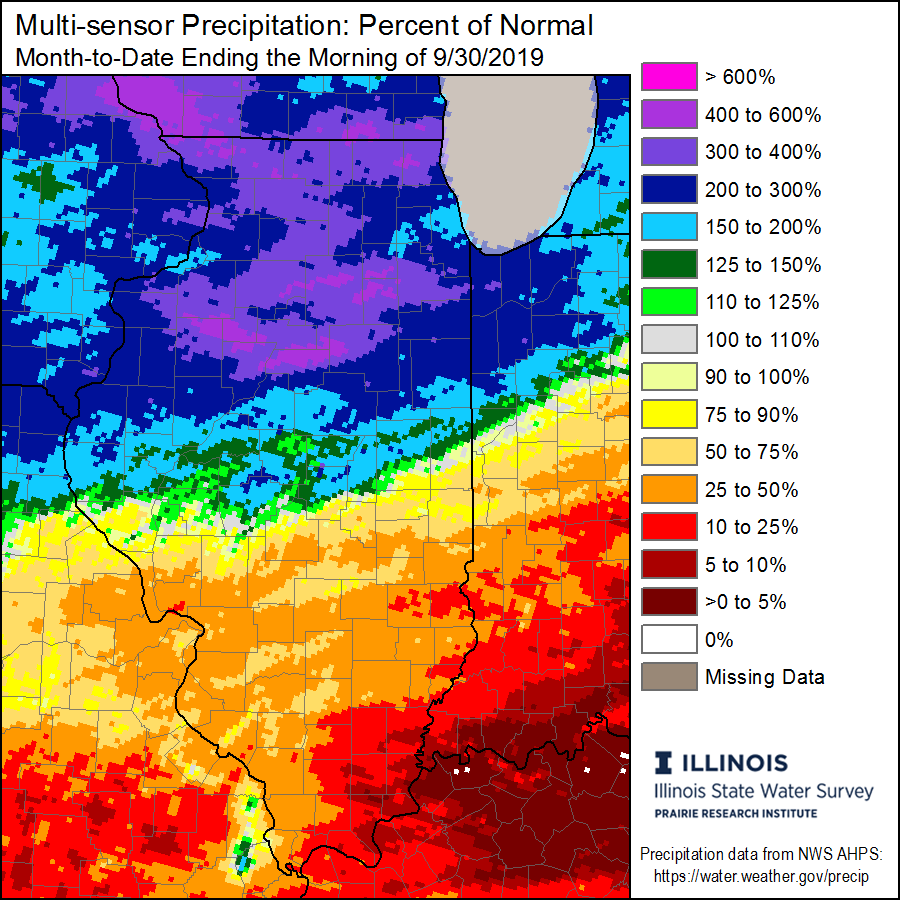
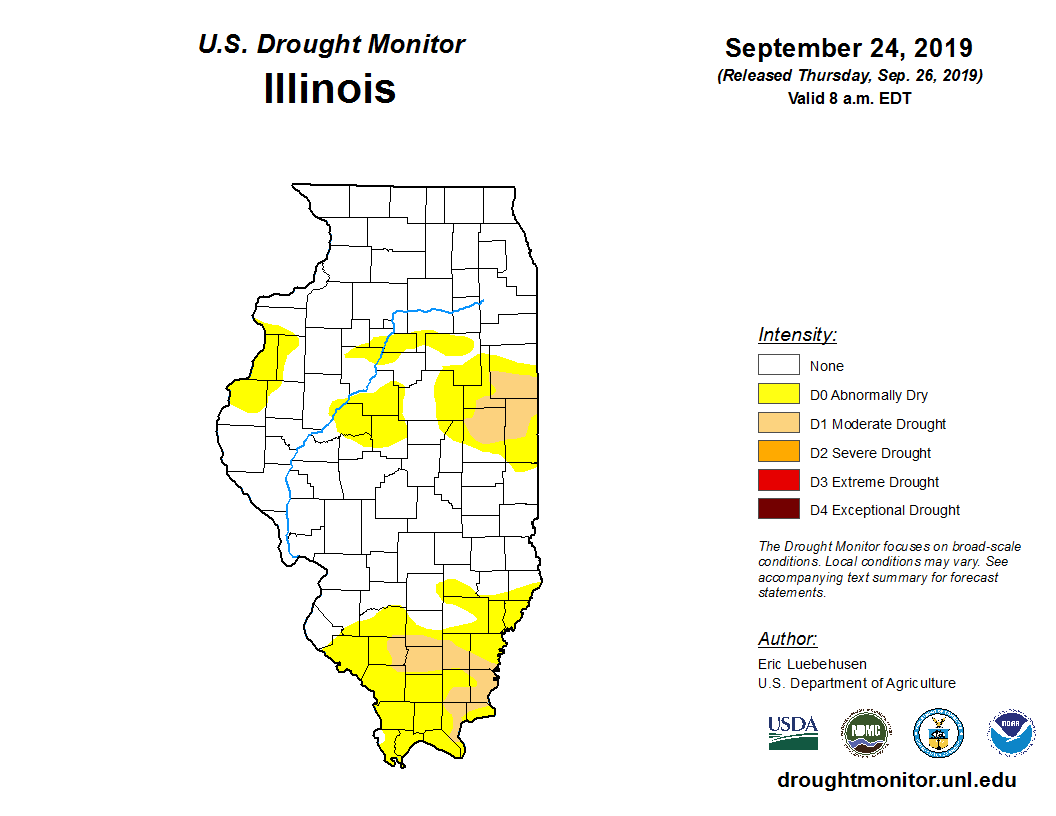
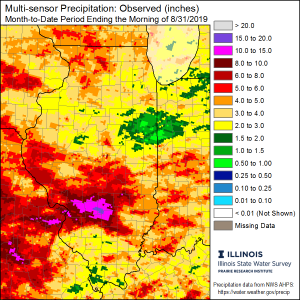
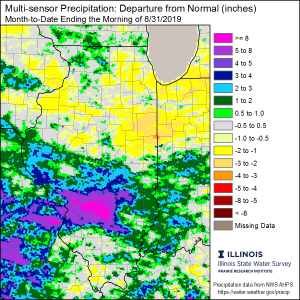
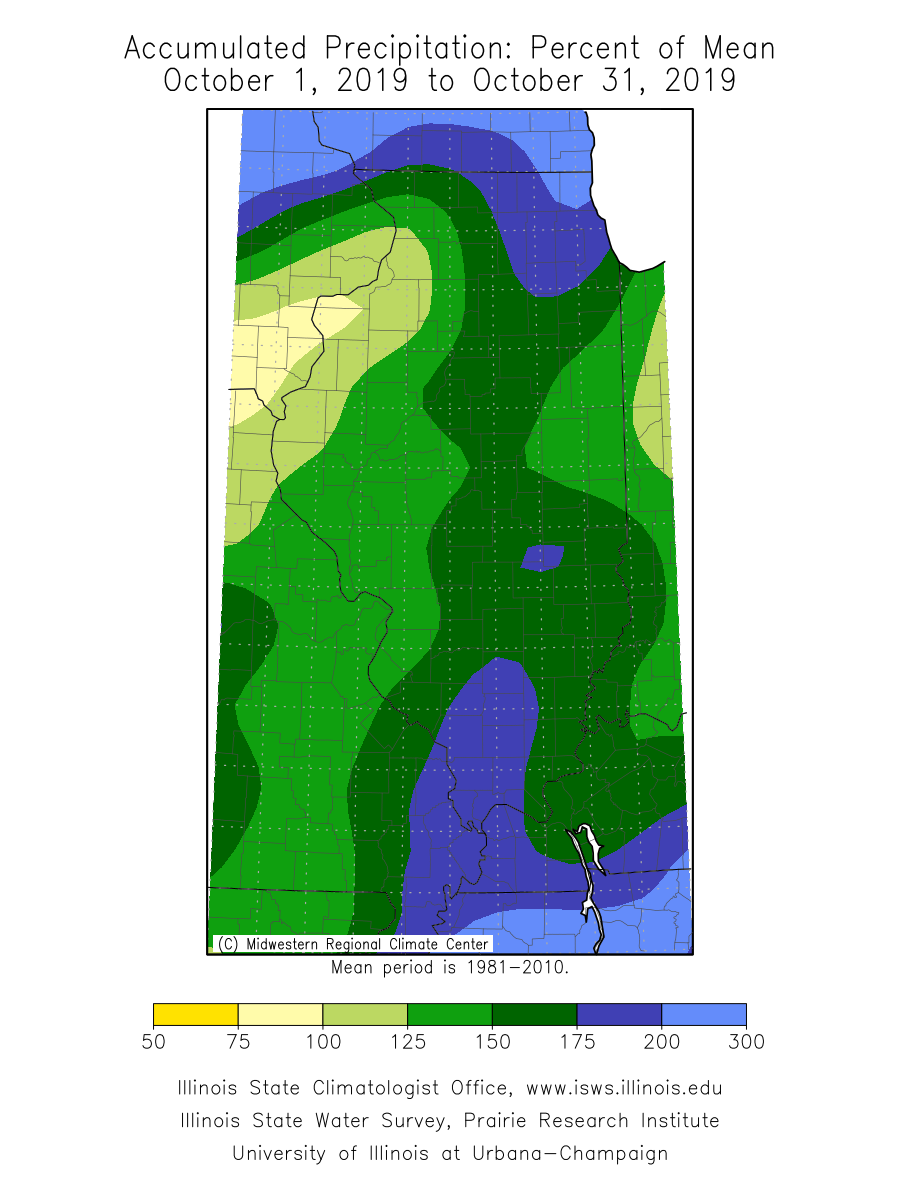
October precipitation was above normal for virtually all of Illinois. The statewide total precipitation in October was 5.20 inches, approximately 2 inches more than the 30-year normal. Areas of far northern and southern Illinois received over 7 inches of rainfall in October. CoCoRaHS observers in New Lenox in Will County and Riverwoods in Lake County recorded over 12 inches of precipitation in October. Expressed as a percent of the long-term mean, areas of northeastern Illinois received more than 200 percent of mean October precipitation, and a broad swath of southern Illinois received over 150 percent of mean October precipitation (see maps below). Significant rainfall helped improve drought conditions in southern Illinois. The latest U.S. Drought Monitor map – current as of October 29 – shows no drought in Illinois for the first time since early August.

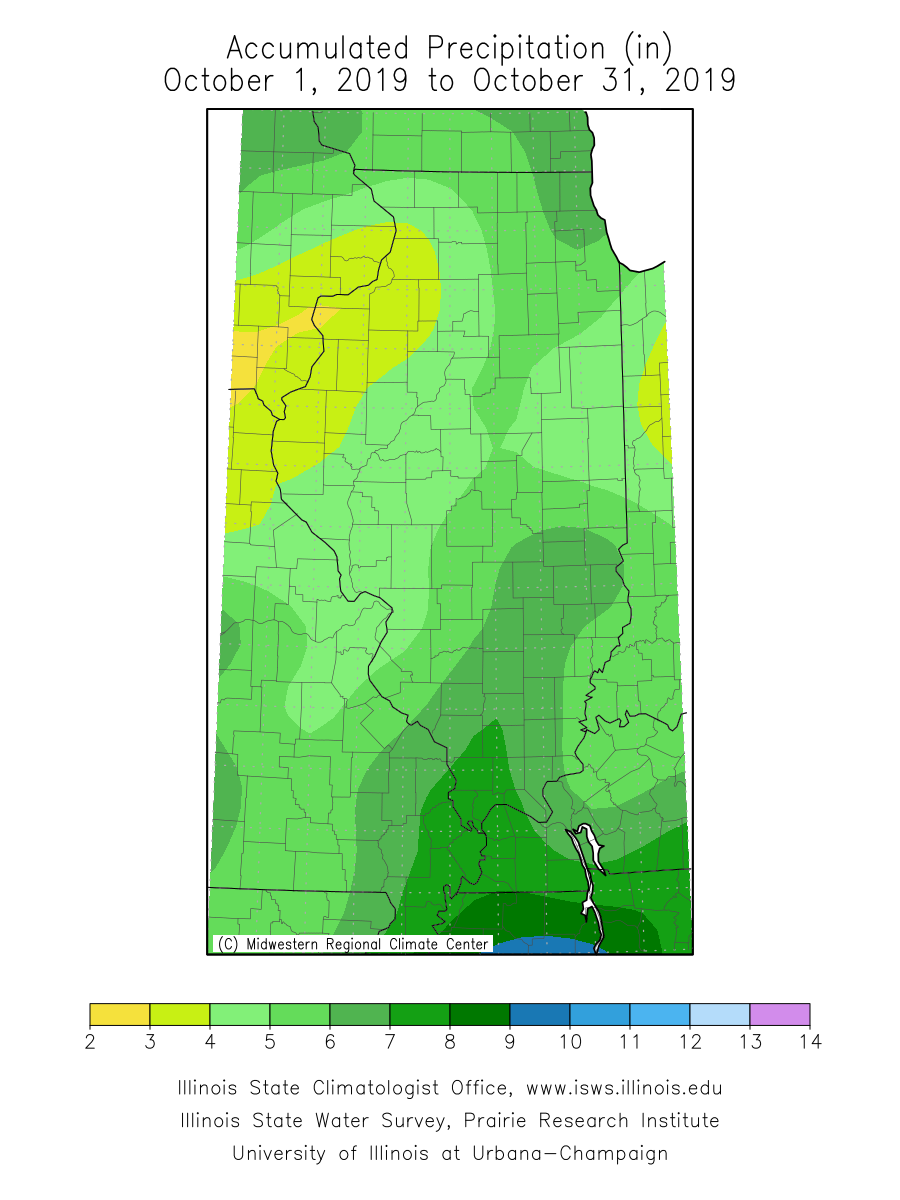
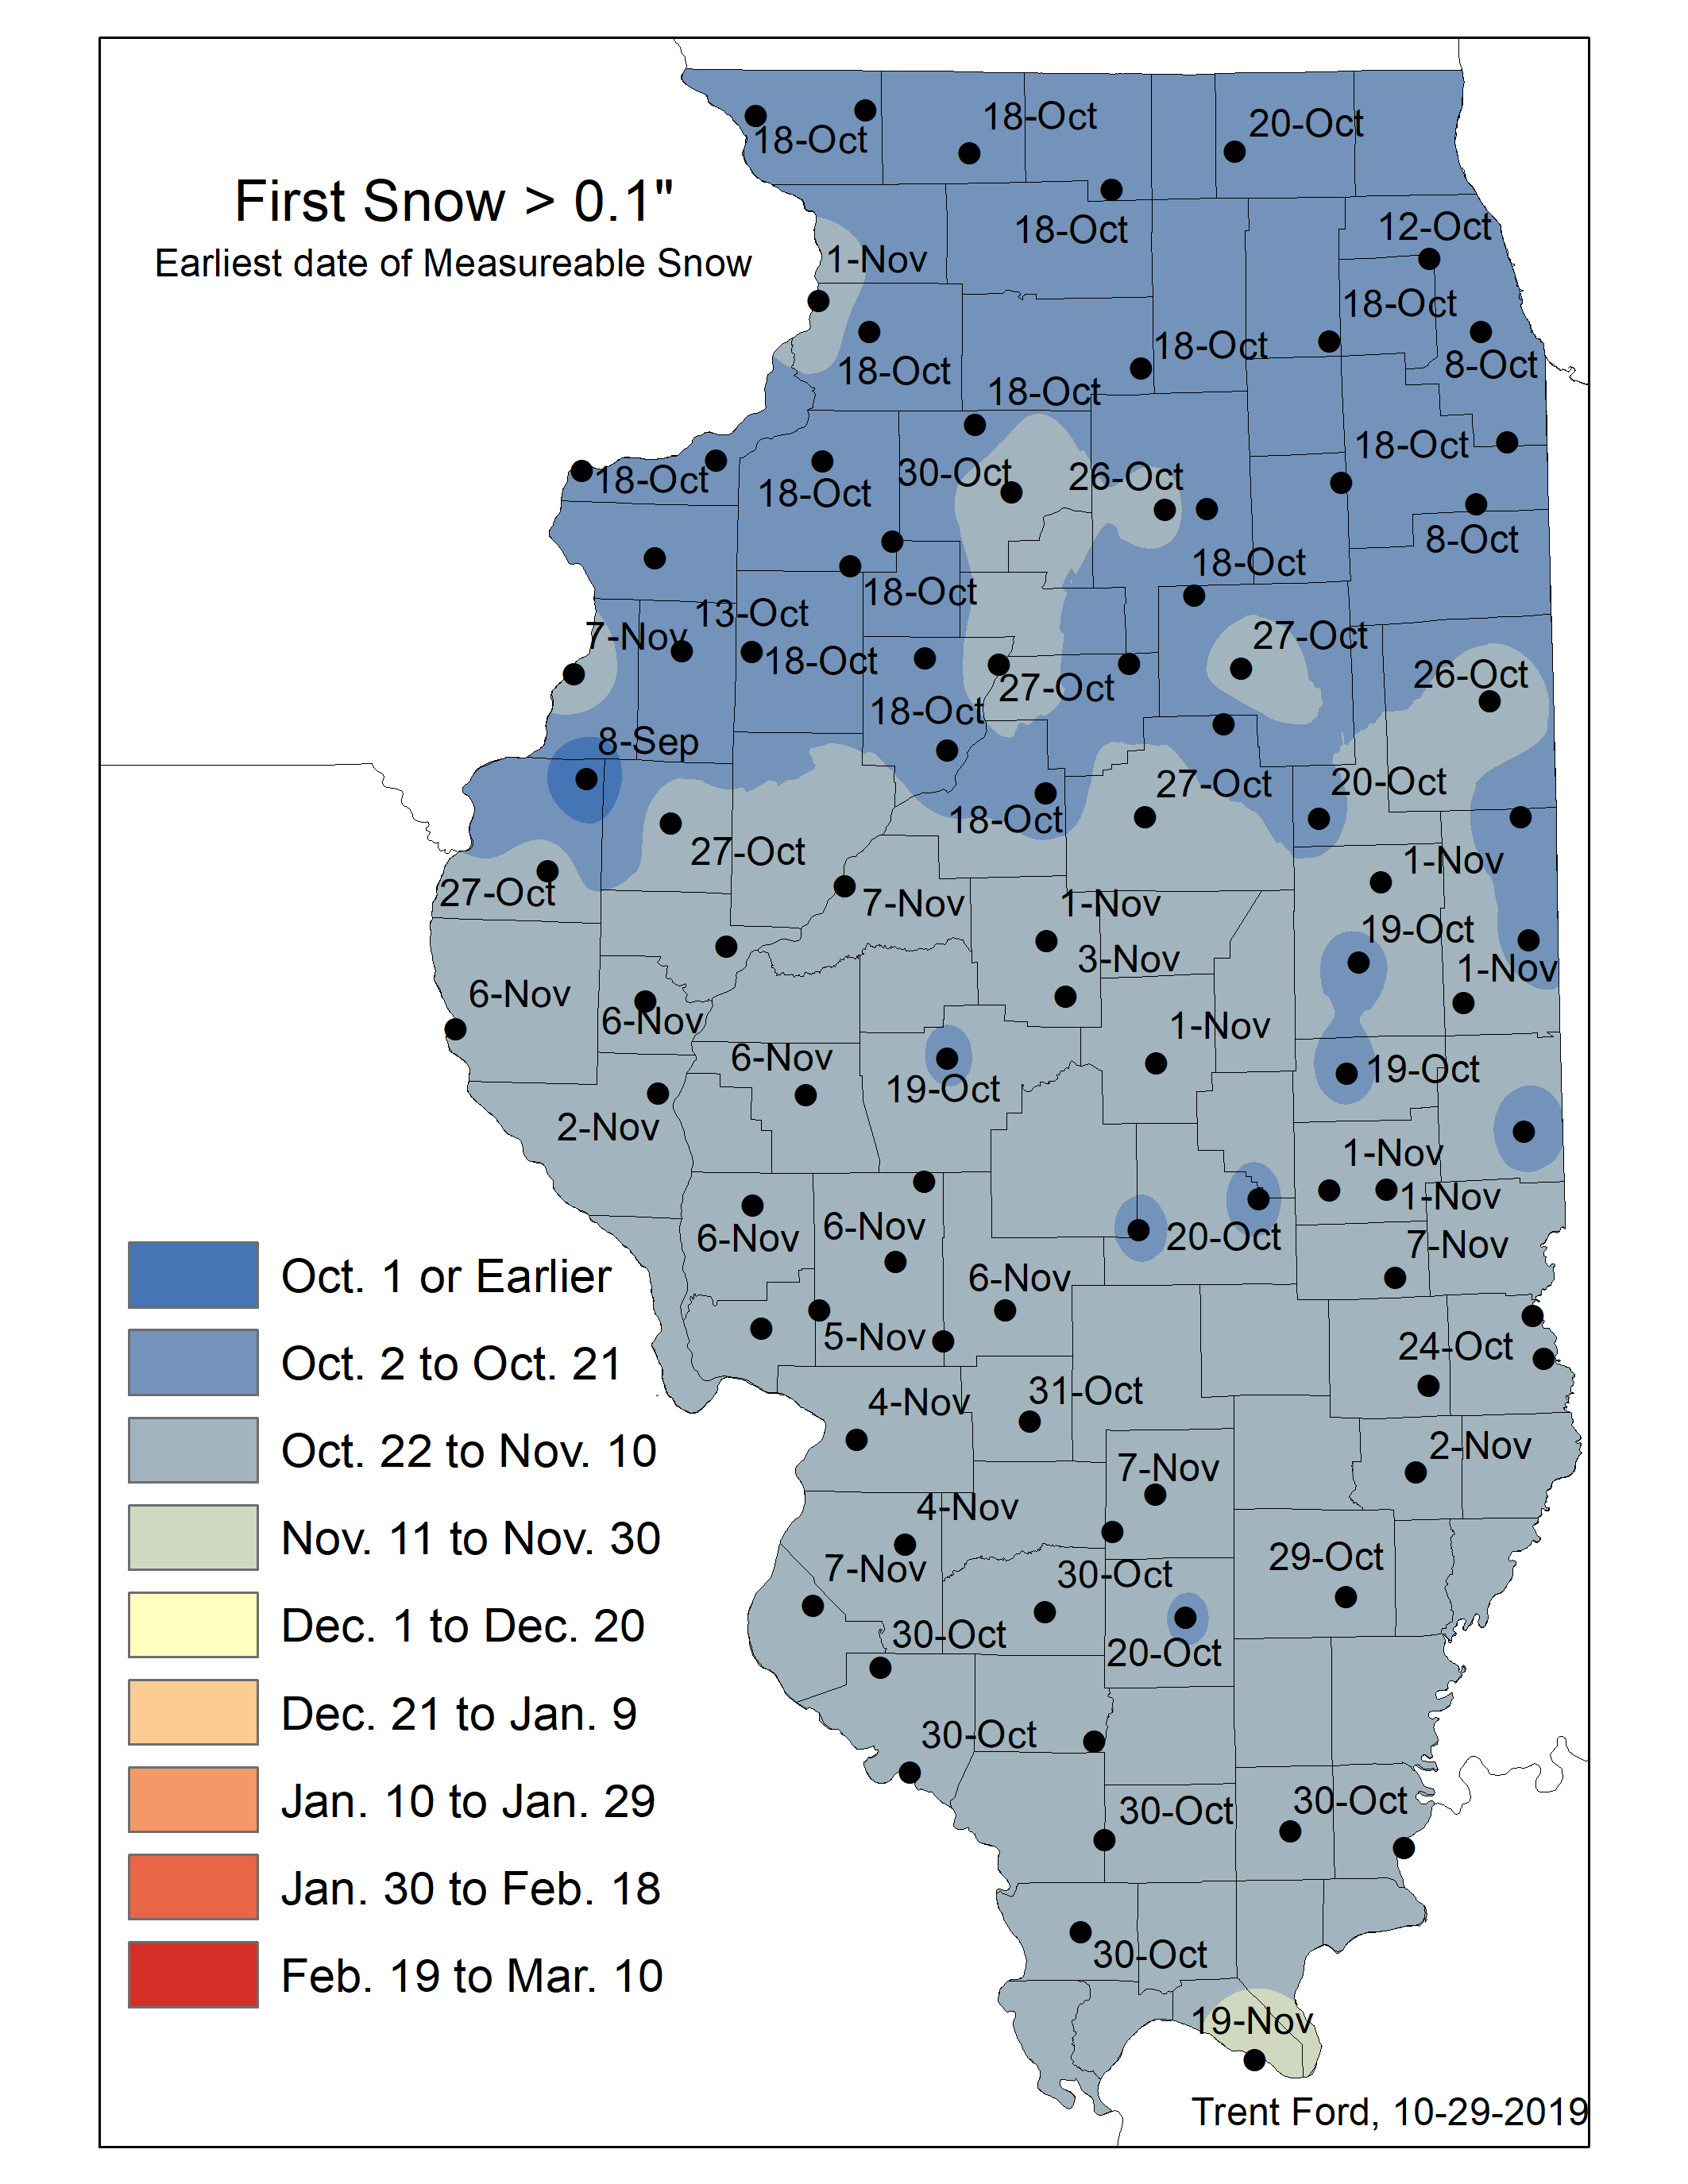
The cool down that came at the end of this month brought a variety of precipitation, including snowfall and some snow accumulation in northern and western Illinois. Total snowfall accumulation over the last week of October ranged from over 8 inches in northwestern Illinois to just over a tenth of an inch as far south as Nokomis in Montgomery County. The highest October snowfall total, 8.5 inches, was in Orangeville in Stephenson County. Although late October is early for the first snowfall in Illinois, it is certainly precedented. The map below shows the date of the earliest recorded snowfall (> 0.1 inch) at COOP stations across the state.

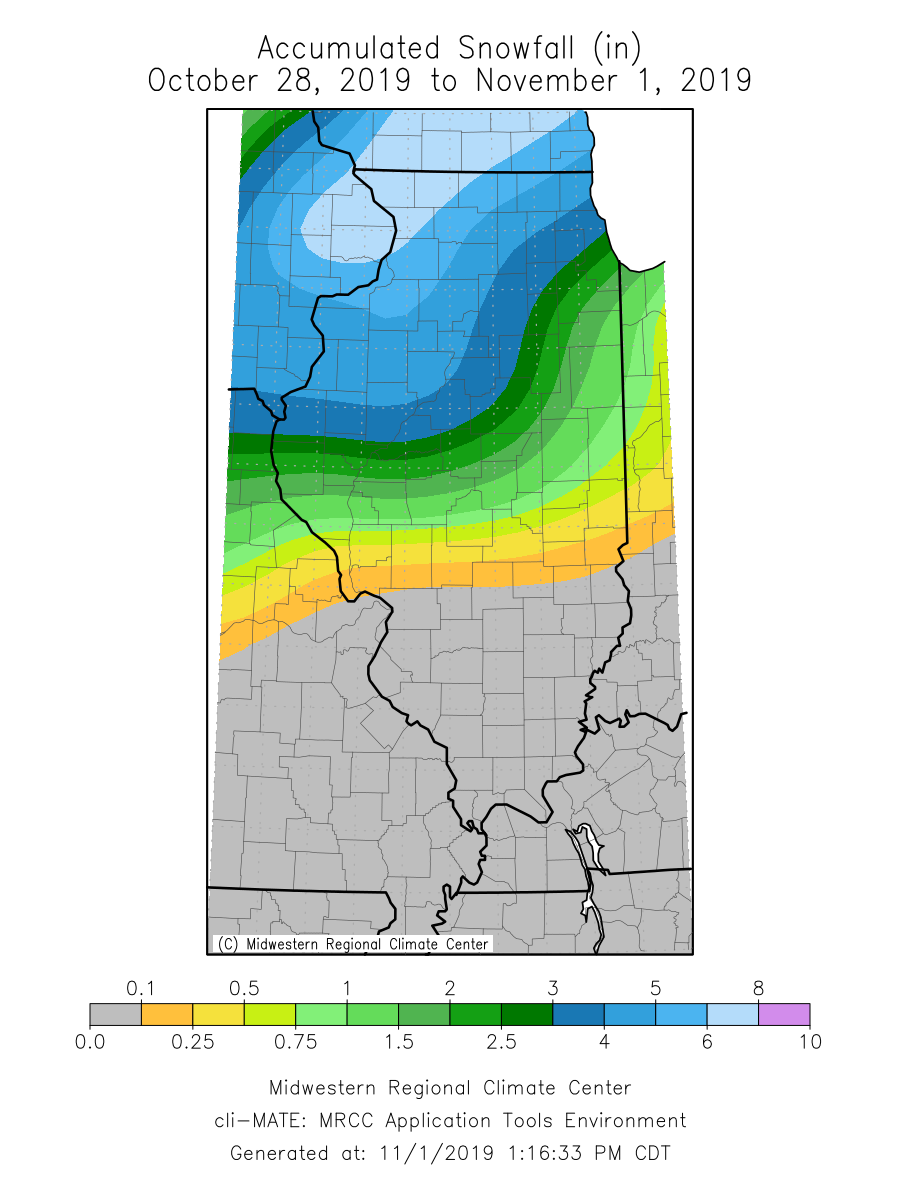
Short- and Long-Term Outlooks

Short-term 8- to 14-day outlooks from the Climate Prediction Center show strongly elevated odds of below normal temperatures persisting into the first couple of weeks of November. Concurrently, probabilities are elevated for below normal precipitation out to 14 days, as drier weather is likely to prevail following the first winter storm of the season in Illinois.

Longer-term outlooks for November also show increased odds of below normal temperatures and increased odds of above below normal precipitation. Winter (December–February) outlooks show greater odds of a wetter than normal winter.


September Heat, Flooding, & Drought

This past month was tied for the 4th warmest September for Illinois (state average temperatures back to 1895), and the warmest September since 1933. Precipitation varied tremendously from north to south across the state.

Preliminary data suggest that September was tied for the 4th warmest on record for Illinois. The preliminary average statewide September temperature was 71.3 degrees, which is 4.9 degrees above the long-term average. Monthly temperatures ranged from 2 to 4 degrees warmer than normal in northeast Illinois to over 6 degrees warmer than normal in southwest Illinois. The preliminary average statewide precipitation was 5.34 inches, which is 1.9 inches above the long-term September average. However, the data also show large differences in September precipitation totals across the state, with northern Illinois receiving much more than average precipitation, and southern Illinois receiving much less than average.

Data are provisional and may change slightly over time. 

Precipitation, Flooding, & Drought

September precipitation totals reveal a strong north-to-south gradient. Areas of northern and north-central Illinois received in excess of 12 inches of rainfall in September, while areas of southeast Illinois received less than 0.25 inches over the same time period (see maps below). Expressed as a percent of normal September precipitation, these totals ranged from 300 percent of normal in northern Illinois to less than 5 percent of normal in southeast Illinois. Locally, a station near Stockton (Jo Daviess County) observed 16.62 inches in September (nearly 13 inches more than normal), while the station at Smithland Lock & Dam (Pope County) recorded only 0.02 inches (3.5 inches less than normal).

August 2019 was the first months since September 2018 during which the U.S. Drought Monitor identified drought in the state. In September, dryness in east-central Illinois persisted but did not intensify. The latest U.S. Drought Monitor map (September 24) shows a pocket of moderate drought covering parts of Champaign, Ford, Iroquois, and Vermilion counties (see map below). Concurrently, below normal rainfall and above normal temperatures in the southern part of the state produced dryness in September. The latest U.S. Drought Monitor depicts abnormally dry conditions for most of Illinois south of I-64, and a pocket of moderate drought from Pope and Hardin counties in the southeast to Perry and Franklin counties in south-central Illinois. Conditions in southern Illinois have shown some signals of a flash drought, which is a rapidly intensifying drought event, often provoked by existing precipitation deficit combined with intense heat.

Reports from Illinois Farm Bureau CropWatchers regarding drought in east-central and southern Illinois are mixed. Some report the dryness and heat have helped late-planted crops reach maturity, while at the same time possibly sacrificing yield. The recent National Weather Service 7-day precipitation forecast calls for 1 to 4 inches of rain in the northern half of the state, with 7-day forecasted totals less than 0.5 inches in southern Illinois (see map below).

In contrast to the ongoing drought in southern and east-central Illinois, September was abnormally wet for most of northern and north-central Illinois. Persistent, heavy rains led to flooding impacts in parts of northern Illinois, including the closure of several state parks and significant flooding along the Fox and Des Plaines Rivers, among others. Areas in northern and north-central Illinois received in excess of 12 inches of rainfall in September. In most parts of Peoria, Woodford, Marshall, and Livingston Counties, most of the rainfall totals came in a 24-hour period between September 27 and 28. This event created dangerous flash flooding from Peoria into the southwest Chicago suburbs.

The COOP station in Minonk, Illinois (Woodford County) recorded 9.09 inches of rainfall over that 24-hour period, although that likely fell over a less than 12-hour window. This total approached the 24-hour, 500-year storm total of 9.53 inches and surpassed the 12-hour, 500-year storm total of 8.29 inches. A 500-year storm total refers to a precipitation accumulation over a given time period (e.g., 12, 24, 48 hours, etc.) and has a 0.2 percent chance of occurring in a given year. Impressively, the 9.09-inch total in Minonk broke, and nearly doubled, the all-time 24-hour precipitation total record at that station, which was just over 5 inches (data going back to 1895). Images of flooded fields in Woodford and Marshall Counties suggest this most recent heavy precipitation event may delay harvest.

Temperature


The September temperature was much more consistent across the state than precipitation, as the entire state experienced above normal temperatures this month (see maps below). Apart from the last full week in September, most of the state has been under the influence of a large high-pressure system this month, centered to our southeast. This system has allowed warm air to intrude from the south/southwest, generating warmer than normal conditions for this time of the year. In fact, the statewide September average temperature was 71.3 degrees, tying it for the 4th warmest September on record in Illinois (back to 1895). September average temperatures across the state ranged from 65 degrees in Jo Daviess County to 78 degrees in Lawrence County. The lowest minimum temperature reported in Illinois in September was 45 degrees in Jo Daviess County on September 5, and the highest maximum temperature reported in Illinois was 97 degrees in both Alexander and Pope Counties on September 16. Well over 100 local daily climate records were broken in Illinois in September, most of which were high daily minimum temperature records. This is attributed to several very warm nights, including the night of September 22, when the nighttime minimum temperature remained above 70 degrees as far north as Elizabeth (Jo Daviess County) and Freeport (Stephenson County). On the night of September 10, the station in Rock Island reported a nighttime minimum temperature of 77 degrees, besting the previous daily record by 3 degrees.

Short-term temperature forecasts call for continued above average temperatures for the first few days of October and then a regression to cooler, more seasonal conditions. Longer term Climate Forecast System (CFS) forecasts from the National Centers for Environmental Protection show probabilities of a 32-degree freeze in Illinois remain below 30 percent into the third week of October. The map below shows the probability of a daily minimum temperature below 32 degrees between October 14th and October 21st.

October 2019 Outlook


Looking into October, the 8 to14-day outlook from the Climate Prediction Center (CPC) shows elevated probabilities of above normal temperatures and elevated probabilities of above normal precipitation across the state.

The CPC monthly outlook for October still shows elevated probabilities for below normal temperatures across the northern half of the state, with equal chances (above normal, normal, below normal precipitation) for all but the very northwest corner of Illinois (see maps below).


Illinois First Fall Freeze Climatology

Due to significant planting delays across most of the Midwest this year, I have heard many concerns about an early fall freeze and its potential effects on immature crops. Most plants experience damage from a hard freeze or “killing freeze”, which is typically designated by a daily minimum air temperature at or below 28°F. Even in normal growing seasons, an early fall freeze can cause considerable impacts and yield losses for crops. Delayed planting, as was the case this season, increases the risk of freeze damage because crops are less mature going into our normal fall freeze time.

The maps and summary below show first fall freeze dates across Illinois using temperature observations over the period 1979 to 2018. The maps show the earliest and latest fall freeze dates over this 40-year period, as well as the median date, which represents the middle value in the range of dates. The median is preferred over the mean or average, as it is less sensitive to very early or very late freeze dates. Also shown are the 10th (1 in 10 years) and 90th (9 in 10 years) fall freeze dates. All station temperature data were provided by the Midwest Regional Climate Center (https://mrcc.illinois.edu); the shaded areas between stations on the map were interpolated and do not represent actual observations.

The earliest fall freeze dates over the past 40 years range from late September in northwest and central Illinois, to early October in southern and eastern Illinois. An early freeze anomaly can be seen at the Mt. Carroll station (Carroll County), which experienced a minimum temperature of 27°F on September 7, 1988. Interestingly, the observed all-season Illinois minimum temperature record was broken earlier this year at the Mt. Carroll station (-38°F).

Tenth percentile first fall freeze dates (i.e., 1 in 10 years) range from early October in northwest and central Illinois to mid- to late October in southern and eastern Illinois.

Median first fall freeze dates range from mid- to late October in northwest and central Illinois to late October/early November in southern and northeastern Illinois. Approximately half the years between 1979 and 2018 experienced the first fall freeze before the median dates. Also, the median dates map clearly shows the effects of the developed Chicagoland area on nighttime minimum temperatures. The median first fall freeze date at Chicago Midway is 10 to 15 days later than in some of the collar counties.

Ninetieth percentile first fall freeze dates (i.e., 9 in 10 years) range from early November in northwest and central Illinois to mid- to late November in southern Illinois. Based on the 40-year climatology, one could say that there is a 90% chance that the first fall freeze on any given year will occur on or before the dates in the 90th percentile map.

Finally, the latest first fall freeze dates across the state range from mid- to late November in northwest Illinois to early to mid-December in southern Illinois.

Note that air temperatures can vary considerably on smaller or micro-scales. For example, plants near heated buildings or other development can be spared when minimum temperatures dip below the 28°F threshold in the countryside. More information and useful freeze products are provided by the Midwestern Regional Climate Center as part of their Vegetation Impact Program (https://mrcc.illinois.edu/VIP/indexFFG.html).  Higher quality, full-page maps can be accessed by clicking the following links:

10th_Percentile 90th_Percentile Earliest Latest Median

Unequal August Precipitation Leads to Drought in Illinois

August 2019 will be remembered for remarkable differences in monthly precipitation totals across Illinois, as well as the first appearance of drought in the state since September 2018.

It would be inappropriate to summarize August 2019 precipitation across the state using only one adjective. Preliminary data suggest that August was drier than average across much of the state north of I-72 and south of I-64, while much wetter than average conditions prevailed between the two interstates. The preliminary average statewide precipitation was 4.21 inches, which is 0.61 inches below the long-term August average. The preliminary average statewide August temperature was 72.8 degrees, which is 0.7 degrees below the long-term average.

Data are provisional and may change slightly over time

Precipitation & Drought

July 2019 was the first month since November 2018 that ended with below average statewide precipitation. Dryness in the northwest and east-central parts of the state that began in July persisted in August.

Areas in the south-central part of the state, particularly in the western extent of the St. Louis metro east, have received precipitation totals in August between 5 inches and 8 inches above normal, with a station near Patoka (Marion County) reporting the highest August rainfall total of 14.19 inches. Most areas of the state north of I-72 and south of I-64, in contrast, received below normal rainfall in August, in some cases up to 4 inches below normal. The driest area in August covered parts of Ford, Iroquois, and Vermilion counties in east-central Illinois, where precipitation totals were less than 50 percent of their August normal (see maps below).


The continued dry conditions from July to August led the U.S. Drought Monitor to identify moderate drought (D1) in northwest and east-central Illinois in their August 13 map. This was the first time the Drought Monitor identified drought in Illinois since September 2018, which represents the largest number of consecutive, drought-free weeks (48) since the Drought Monitor began 20 years ago. The latest Drought Monitor map, from August 29, shows moderate drought persistence in northwest and east-central Illinois (see figure below).

The combination of late planting, due to flooding, and multi-week drought has stressed crops and farmers across central Illinois. Reports from Illinois Farm Bureau CropWatchers discuss corn dropping ears and beans dropping leaves in parts of Champaign County. The recent National Weather Service precipitation forecast calls for between 0.75 inches and 2 inches over the next 7 days for most of the northern half of the state, with little to no precipitation in southern Illinois.

Temperature

Much of the state experienced near normal to slightly below normal temperatures in August. A strong cold front in the early part of the month and the last week of the month resulted in cooler conditions, with minimum temperatures ranging from the high 40s to high 50s across the state. This was particularly the case for the northwest quadrant of Illinois. However, all of the state experienced August temperatures within 2 degrees of the long-term August mean (see maps below). August average temperatures ranged from 79 degrees in Pulaski County to 68 degrees in Jo Davies County. The lowest minimum temperature reported in Illinois in August was 48 degrees in DeKalb County on August 2nd, and the highest maximum temperature reported in Illinois was 98 degrees in Pulaski County on August 20th.

September 2019 Outlook

Looking into September, the monthly outlook from the Climate Prediction Center (CPC) issued on August 31 shows slightly elevated probabilities of below normal temperatures across the northern half of the state, with equal chances of above normal, normal, and below normal temperatures in the southern half.

September precipitation probabilities slightly favor above normal precipitation in the northwest corner of the state, but are equal (above normal, normal, below normal) for the rest of Illinois (see maps below).

September 2019 Temperature Outlook

September 2019 Precipitation Outlook