The preliminary statewide average February temperature was 39.4 degrees, 8.3 degrees above the 1991–2020 average and the 3rd warmest on record going back to 1895. The preliminary statewide average total February precipitation was 0.53 inches, 1.58 inches below the 1991–2020 average and the 4th driest on record statewide.
Data are provisional and may change slightly over time
Extremely Mild February
Climatologically, February is the second coldest month statewide after January. February 2023 was very mild, about 4 degrees above normal. However, last month made February 2023 look like an Arctic blast.
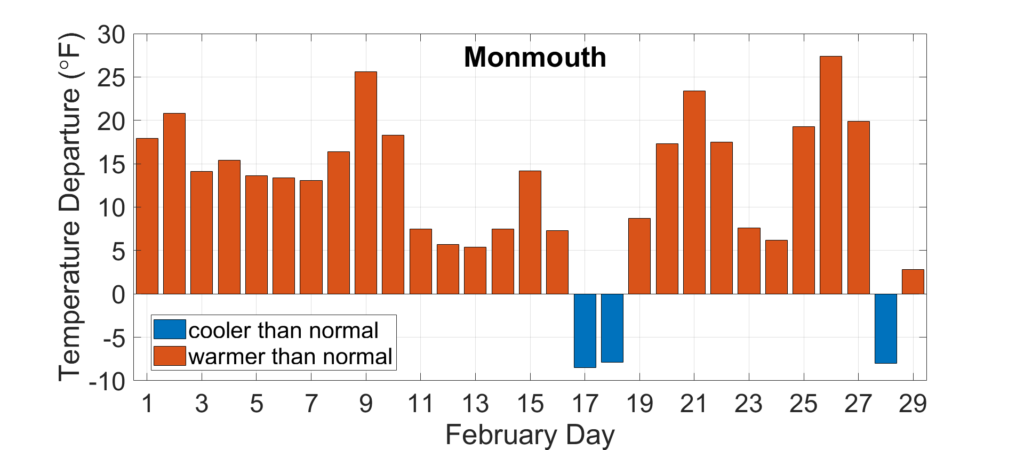
Figure 1 shows daily temperature departures from normal in Monmouth in February. Only three days in our 29-day month were colder than normal, while most days were 10 to 30 degrees warmer than normal.
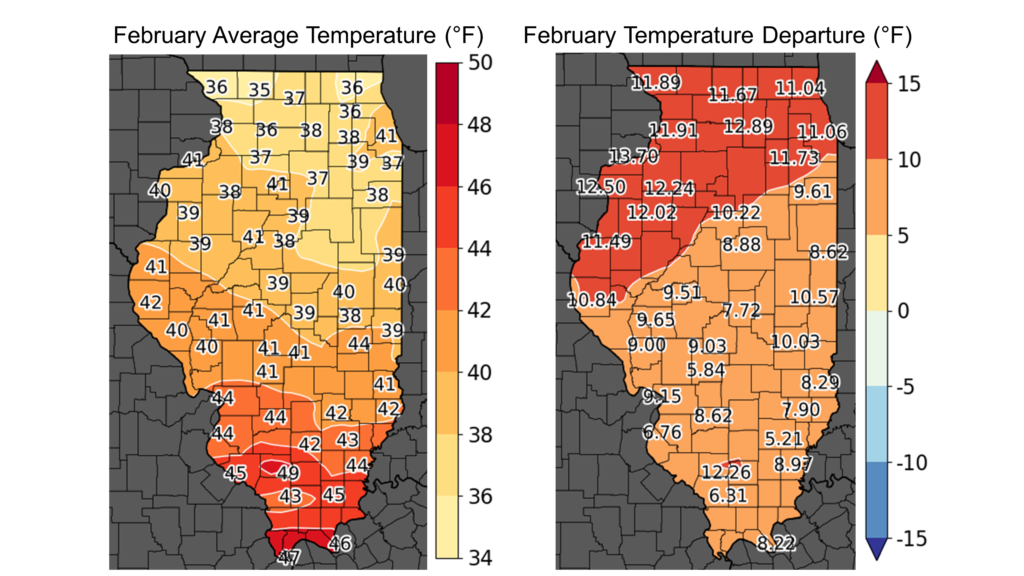
February average temperatures ranged from the mid-30s in northern Illinois to the high 40s in southern Illinois, between 6 and 12 degrees above normal (Figure 2). Several stations saw daily high temperatures in the 80s last month, including 83 degrees in Belleville and 80 in Springfield. A strong cold front in the last week of the month dropped temperatures from the 70s and 80s into the teens and 20s. Several places saw 50- to 60-degree declines in less than 24 hours. Overall, the warmest place in the state last month was Du Quoin, with an average temperature of 49.1 degrees, and the coldest place in the state was Stockton in Jo Daviess County with an average temperature of 34.8 degrees.
The mild weather in February broke 186 daily high maximum temperature records. These included a 75-degree high in DeKalb on February 28, which beat the previous daily high record by a full 12 degrees. There were also 43 daily high minimum temperature records broken last month. Twenty-two locations in Illinois set new all-time February high temperature records, including 77 degrees in Peoria, 77 in Charleston, 76 in Moline, and 73 in Rockford. Last month was the warmest February on record in Chicago, Rockford, Moline, and Peoria. It was a top 5 warmest February virtually everywhere in the state.
Overall, the preliminary statewide average February temperature was 39.4 degrees, 8.3 degrees above the 1991–2020 average and the 3rd warmest on record going back to 1895.
The Winter That Mostly Was Not
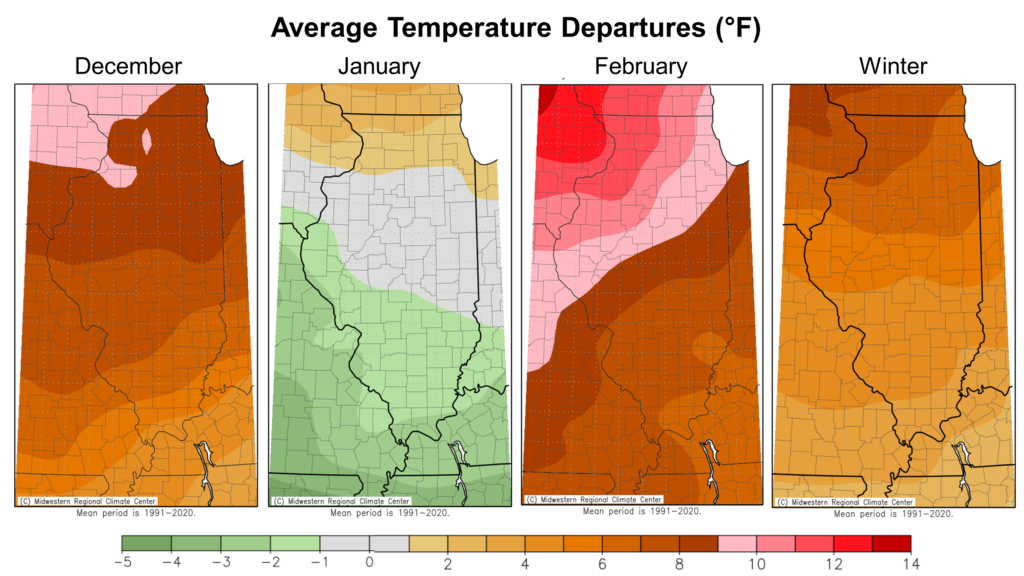
February ended yet another very mild climatological winter season that featured only one truly cold air outbreak. The season began with the 3rd warmest December on record statewide, followed by a mostly mild January split in two by extreme cold. An incredibly mild February put a cap on a winter with average temperatures that were 4 to 8 degrees above normal in Illinois (Figure 3).
Overall, the preliminary statewide average winter temperature was 34.8 degrees, 5.1 degrees above the 1991–2020 normal and, if confirmed, would be the 3rd warmest winter on record in Illinois.
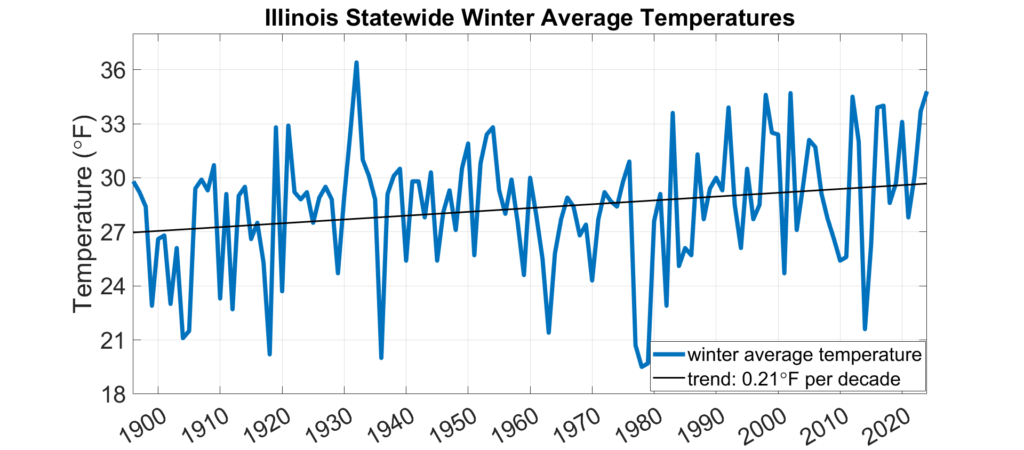
This is the part of the summary where I, once again, lament the long-term winter warming trend in Illinois. Winter is warming faster than any other season and is one of the most consistent impacts of human-caused climate change in the Midwest.
With respect to the long-term historical record, the 2022–2023 winter season was unusually warm. However, the season is part of a long-term warming trend that is larger in winter than in any other season across Illinois. Winter warming is one of the most consistent impacts of anthropogenic climate change in Illinois, driven by human greenhouse gas emissions. As Figure 4 shows, the statewide average winter temperature has increased by about 0.20 degrees per decade since 1895, and the average winter temperature over the past 30 seasons is about 2 degrees warmer than the 20th century average. One of the consequences of this long-term warming trend is a higher chance of warm winters that would be considered unusual based on the 20th century numbers. For example, six of the top 10 warmest winters on record in Illinois have occurred since 2001–2002.
Very Dry February
February is one of the climatological driest months of the year, and the last month fit that mold. Total February precipitation ranged less than half an inch in parts of western Illinois to around 3 inches in parts of northern Illinois (Figure 5). Most of the state was 1 to 3 inches drier than normal last month, while only a narrow stretch of northern Illinois caught more than normal precipitation.
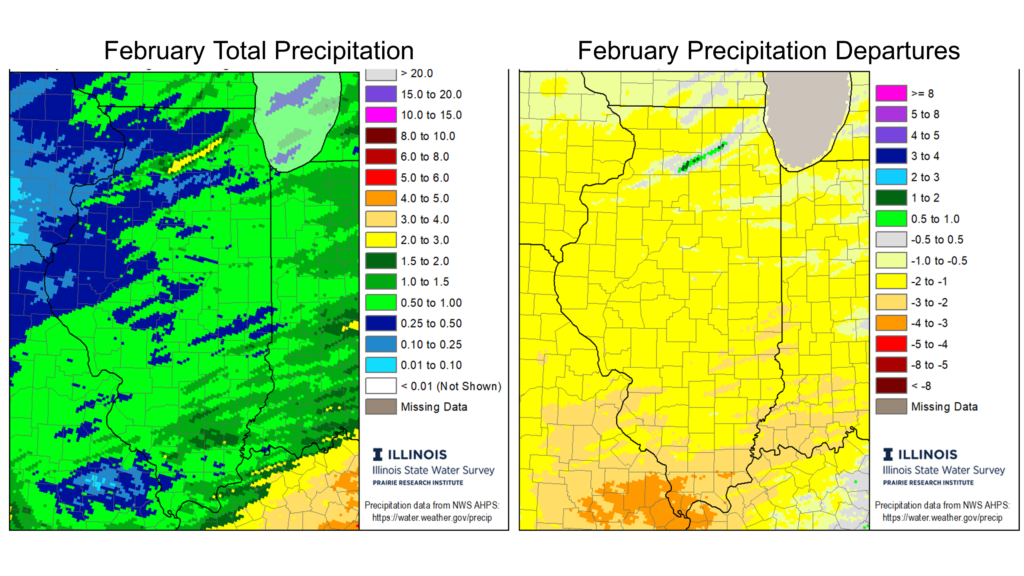
Last month was the 7th driest on record in Rockford (0.29 inches total), the 8th driest in Moline (0.26 inches total), the 6th driest in Springfield (0.51 inches total), the 3rd driest in Normal (0.14 inches total), the 3rd driest in Quincy (0.07 inches), and 4th driest in Carbondale (0.74 inches). In fact, February tied for the 7th driest month on record (for any month) in Quincy, whose record stretches back to 1901. Overall, the preliminary statewide average total February precipitation was 0.53 inches, 1.58 inches below the 1991–2020 average and the 4th driest on record statewide.
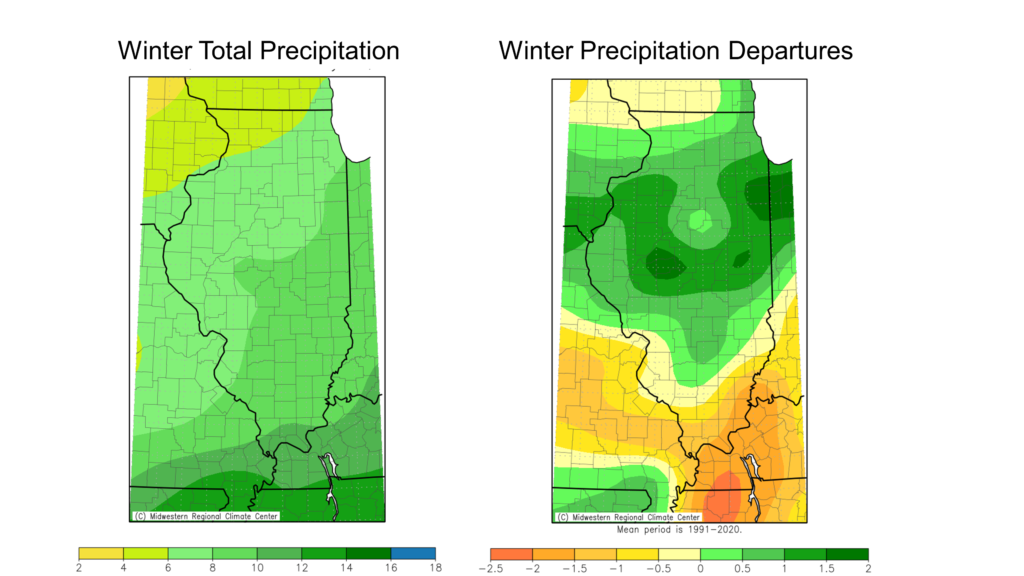
The very dry February in Illinois followed a very wet January and a mixed bag of wetter and drier than normal conditions in December. Overall, winter total precipitation ranged from less than 5 inches in northwest Illinois to over 10 inches in far southern Illinois. Most areas north of Interstate 64 were near to 1 to 2 inches wetter than normal last season, while far southern Illinois was 1 to 2 inches drier than normal in winter (Figure 6).
I Remember Snow…
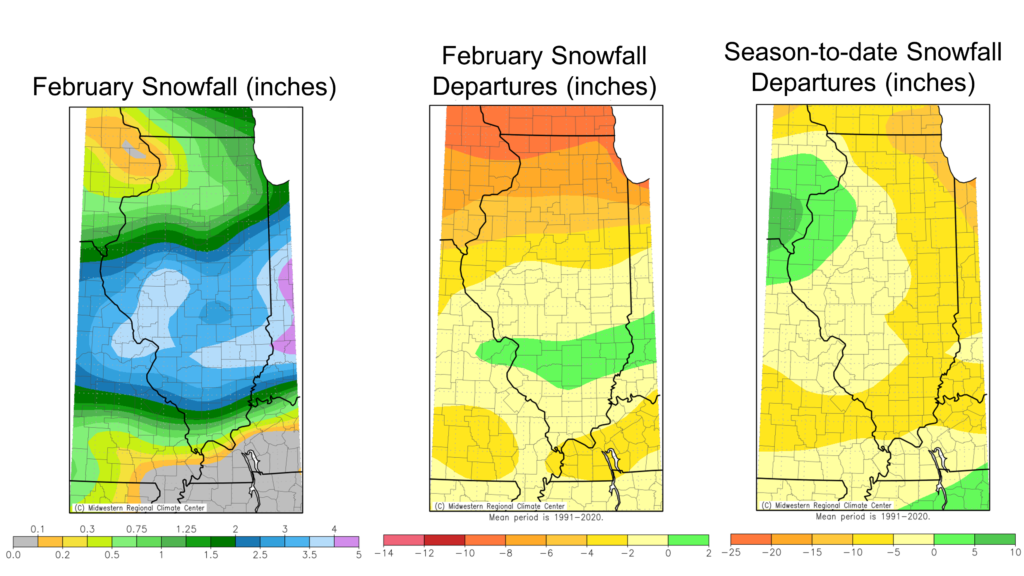
I am contractually obligated to remind everyone that Illinois often – if not normally – gets some measurable snowfall in March and occasionally in April. So, the “snowfall season” is not yet complete; however, January and February almost always contain the most snowfall in the state. The first two months of 2024 underproduced in the snowfall category for virtually everyone outside of the Quad Cities and the northwest corner of the state.
February total snowfall ranged from less than two-tenths of an inch in northwest Illinois to just over 5 inches in central Illinois. Only the Interstate 70 corridor was above normal on February snowfall, while most of northern Illinois was 4 to 10 inches below normal (Figure 7). The big January snowstorm in the Quad Cities area keeps that region above normal on season-to-date snowfall, while most of the rest of the state is 5 to 15 inches behind normal snowfall by March 1.
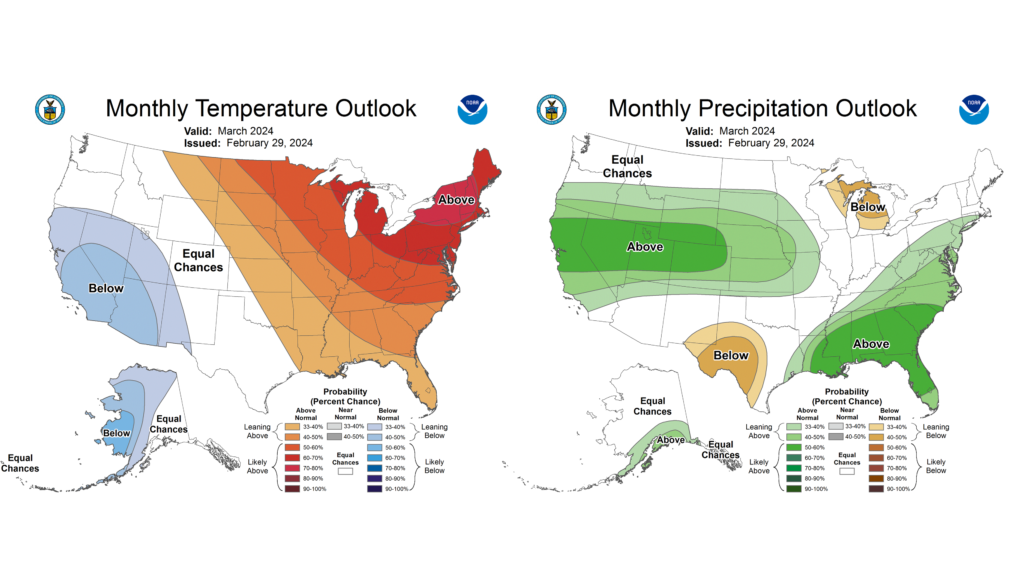
March & Spring Outlooks
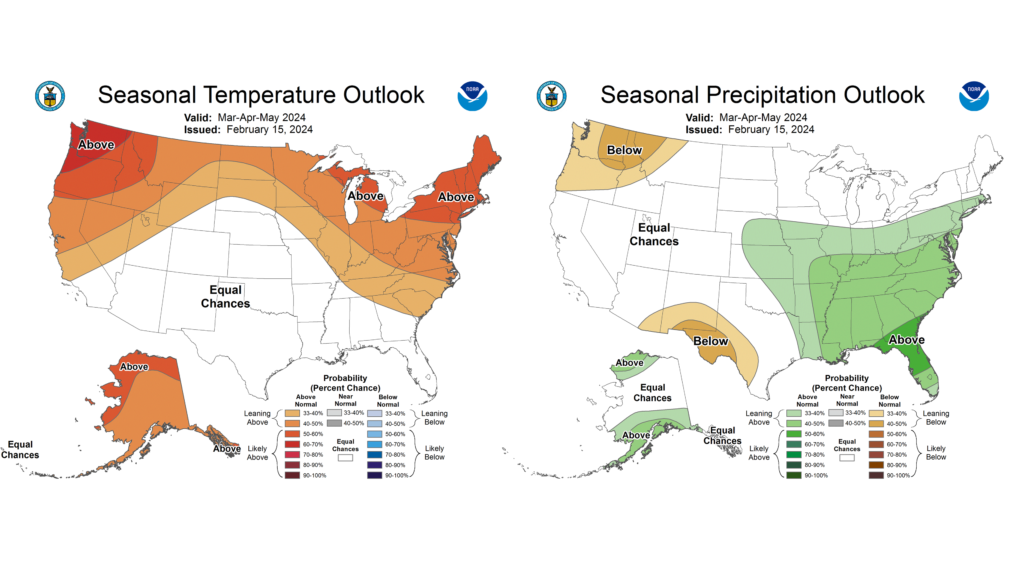
March is the first month of climatological spring, and the first month we typically begin to see signs of spring. Of course, spring started weeks ago this year. The Climate Prediction Center temperature outlooks lean warmer than normal across the state. A warmer March will continue our sprint to an early spring, for good or for bad. Precipitation outlooks indicate equal chances of wetter and drier than normal conditions in March. As much as dry soils can help facilitate spring fieldwork, we could use a wetter March to help improve slowly worsening drought conditions, especially in southern Illinois.
The spring season outlooks (March–May) also show slightly higher chances of above normal temperatures. Meanwhile, the higher chances of wetter spring conditions in the southeast US reaches up and grabs part of Illinois.