2021 was Warmer and Wetter than Normal

Illinois was both warmer and wetter than the 1991–2020 normal in 2021. The statewide average annual temperature was 53.7 degrees, 1.1 degrees above normal and tied for the 10th warmest year on record. Statewide total precipitation in 2021 was 41.06 inches, 0.31 inches above normal and the 37th wettest year on record.

2021 Temperatures

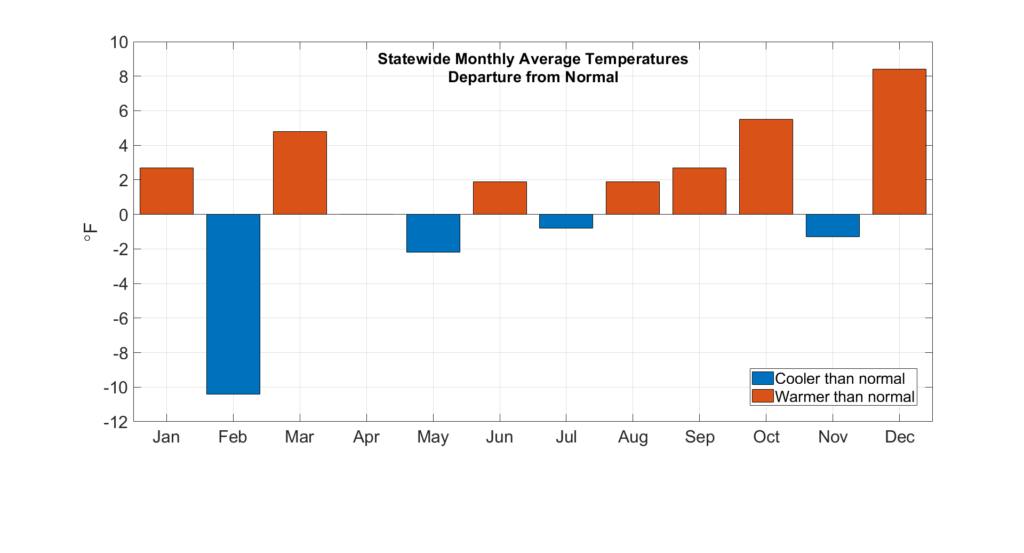
The mild start to the 2020-2021 winter spilled over into the first month of the year. January average temperatures were nearly 3 degrees above the 1991–2020 normal. This was followed by an extremely cold February that was 10 degrees below the 1991–2020 normal and the 11th coldest on record statewide. March was nearly 5 degrees warmer than normal, followed by April and May, which were both slightly cooler than normal. Although July was slightly cooler than normal, it was outweighed by June and August that were both nearly 2 degrees warmer than normal. September and October were 2.7 and 5.4 degrees above normal, respectively. October was the sixth warmest on record statewide and the warmest since 1971. The year ended with a slightly cooler than normal month of November and an extremely warm December that was 8 degrees above normal. The final month of 2021 was the second warmest December on record statewide.

Figure 1. 2021 monthly average temperature departures from the 1991–2020 normal

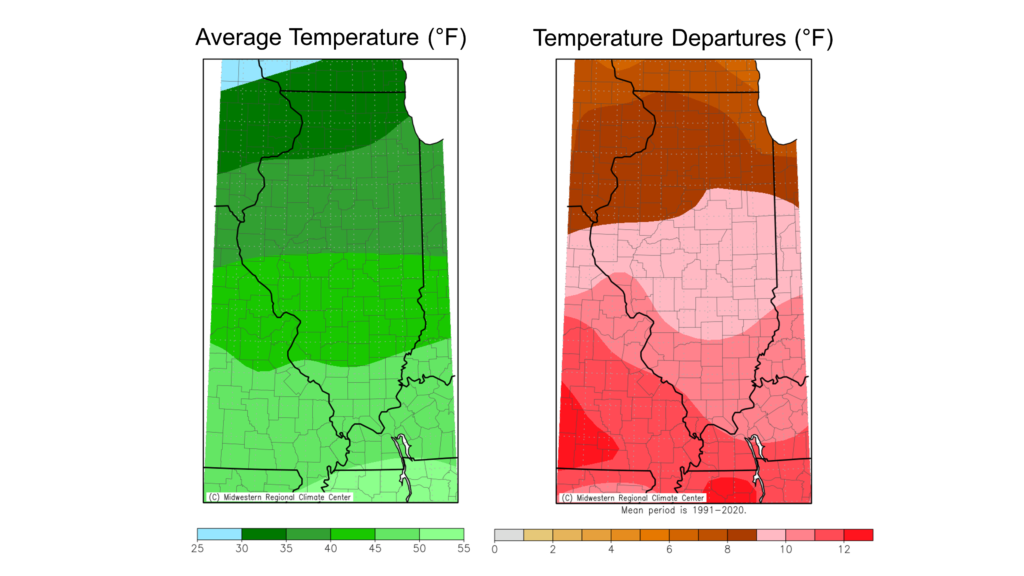
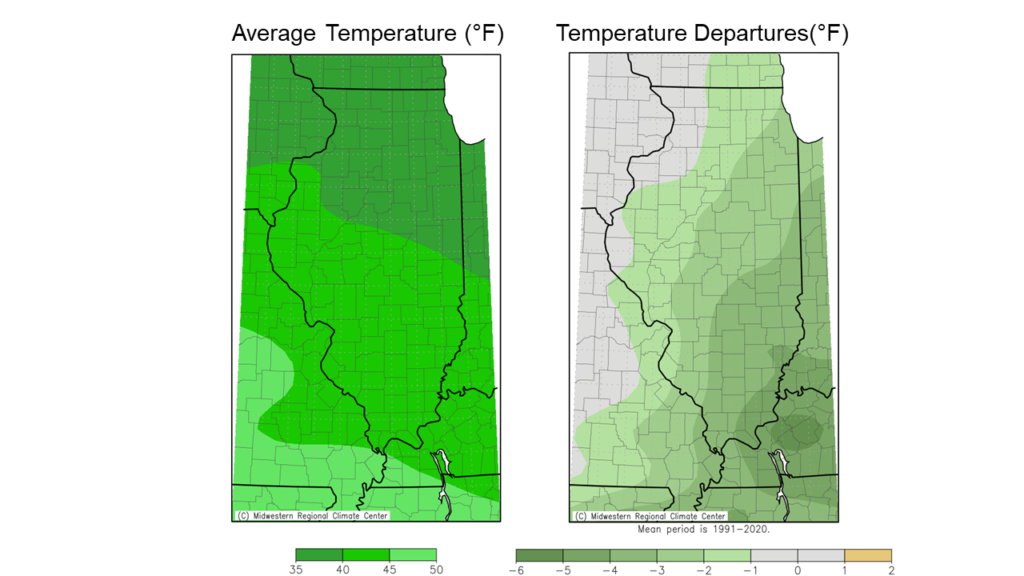
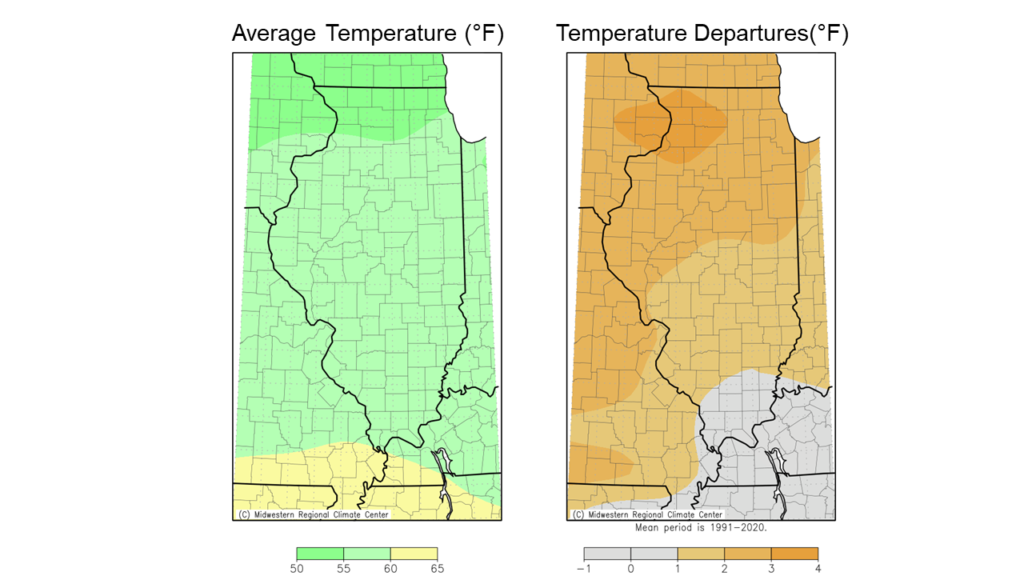
The maps below show 2021 average temperatures and departures from normal across the state. Average temperatures ranged from the high 40s in far northern Illinois to the high 50s in the southern half of the state. Most of the state was 1 to 2 degrees warmer than the 30-year normal, whereas the southern two-thirds of the state was within 1 degree of normal, and northeast Illinois was 2 to 3 degrees warmer than normal.


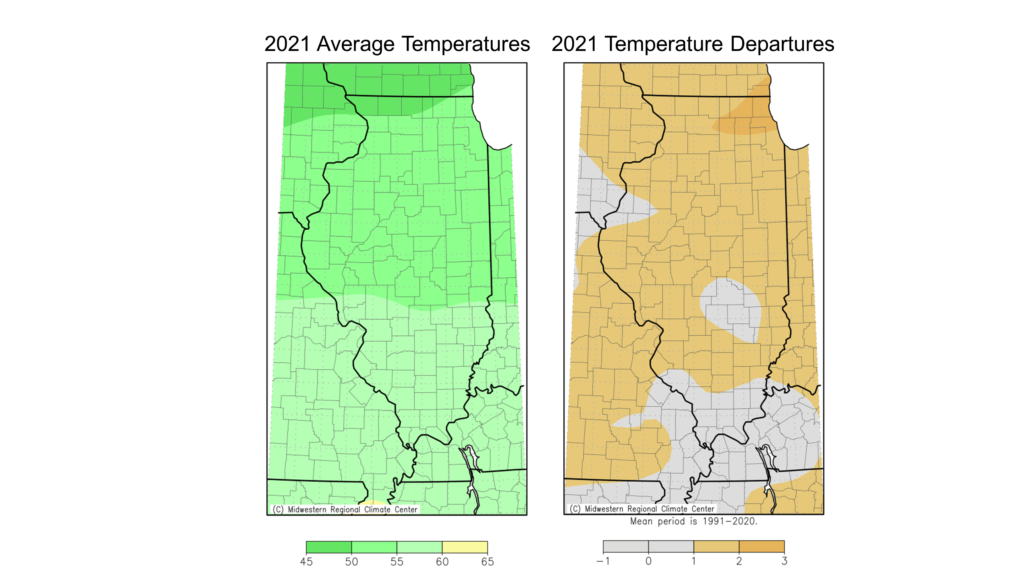
Figure 2. Maps show 2021 annual average temperature (left) and average temperature departures from the 1991–2020 normal (right).

The year 2021 tied with 1998 as the 4th warmest year on record in Chicago and was the 4th warmest year in Rockford, the 7th warmest year in Moline, the 6th warmest in St. Louis, and the 13th warmest in Peoria. Statewide, 10 of the top 20 warmest years on record have occurred since 1990.

The table below shows the number of daily weather records broken at Illinois Cooperative Observer stations in each month of 2021.

December led with the most number of high daily maximum temperature records with 116, and October led with the most high daily minimum temperature records with 60. Fifteen stations in Illinois also broke the all-time December high maximum temperature records in 2021, including a 72-degree high in Galesburg on December 16.

Last year’s intense February broke 243 daily low maximum temperature records and 92 daily low minimum temperature records, the highest of all months. Over the entire year, more than twice as many low maximum temperature records were broken as low minimum temperature records. Illinois’ climate has warmed over the past 100 years, but daily minimum temperatures have increased at a larger rate than daily maximum temperatures. This disproportionate change resulted in fewer daily low minimum temperature records broken.

DailyHigh Maximum TemperatureHigh Minimum TemperatureLow Maximum TemperatureLow Minimum TemperatureHigh Precipitation
January010059
February002439246
March20180076
April1341342141
May624544440
June322111251
July1151378
August73617454
September2560019
October146000157
November00021
December116590044
Total234267400178666
Table 1. Table shows the number of daily local weather records in 2021 by month and variable.

There were also 666 daily total precipitation records broken across Illinois in 2021. This included 157 daily precipitation records from a very wet October. In fact, nine stations broke the all-time October daily precipitation records, including 4.32 inches on October 24 in Rantoul in Champaign County.
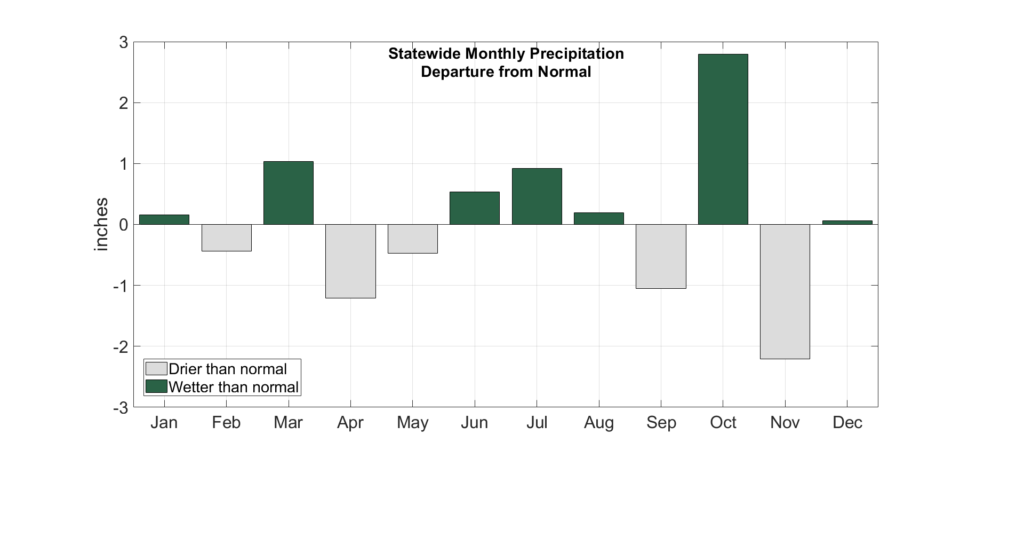
2021 Precipitation

Calendar year 2021 began with a slightly wetter than normal January and slightly drier than normal February. March was more than 1 inch wetter than normal statewide, but the onset of drought in northern Illinois in spring resulted in drier than normal months in April and May. All three months of climatological summer were wetter than normal, July was nearly 1 inch wetter than normal. Fall was a roller coaster, as September was about 1 inch drier than normal, followed by the fifth wettest October on record statewide and the ninth driest November on record statewide.

Figure 3. 2021 monthly total precipitation as a departure from the 1991–2020 normal.

In 2021, perhaps more than most years, the statewide precipitation numbers do not properly reflect the variability of precipitation between different parts of the state. Figure 4 shows the 2021 monthly precipitation departure from normal in Rockford, Springfield, and Carbondale. While only three months of 2021 were wetter than normal in Rockford and four months were wetter than normal in Carbondale, eight months in Springfield were wetter than normal. In fact, Springfield observed five months in 2021 with more than 5 inches of precipitation, only the third time in its 120+ year record (other years were 1898 and 1977).


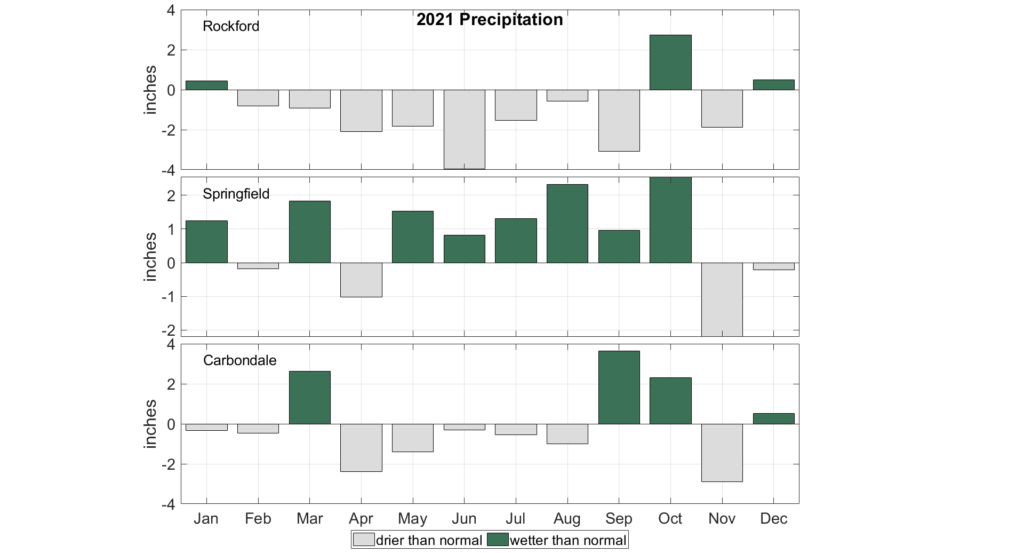
Figure 4. 2021 monthly total precipitation departure from the 1991–2020 normal in (top) Rockford, (middle) Springfield, and (bottom) Carbondale.

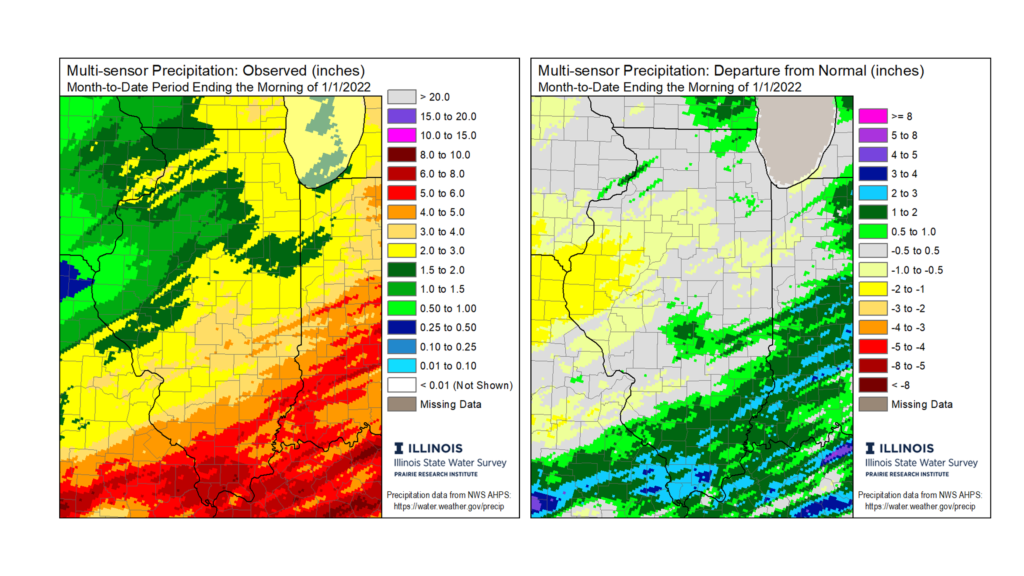
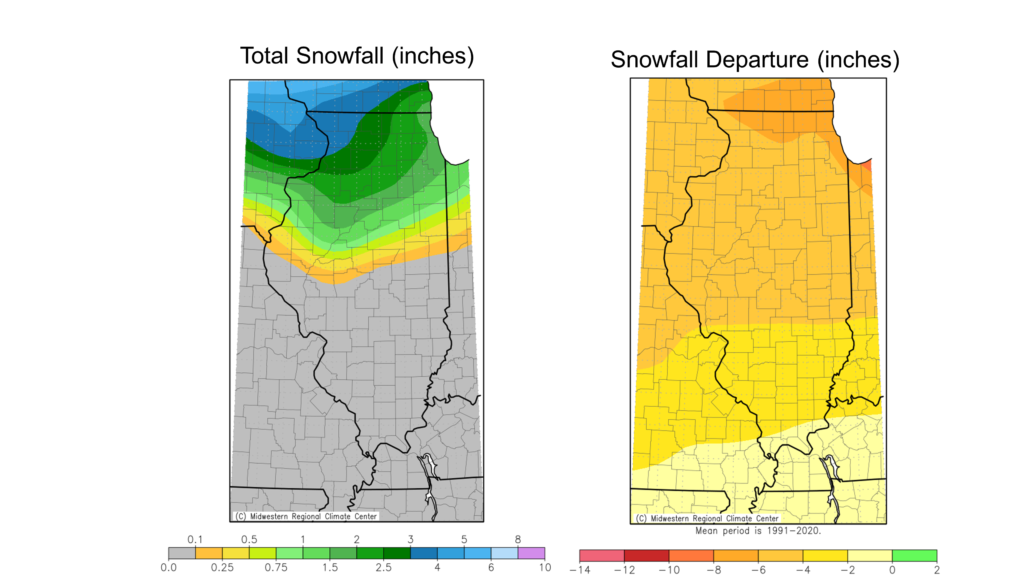
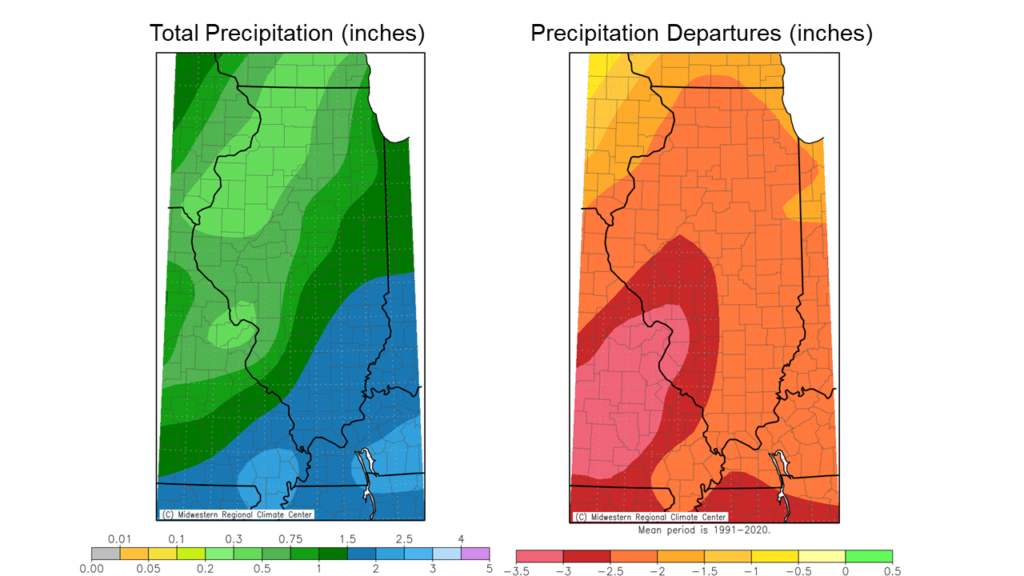
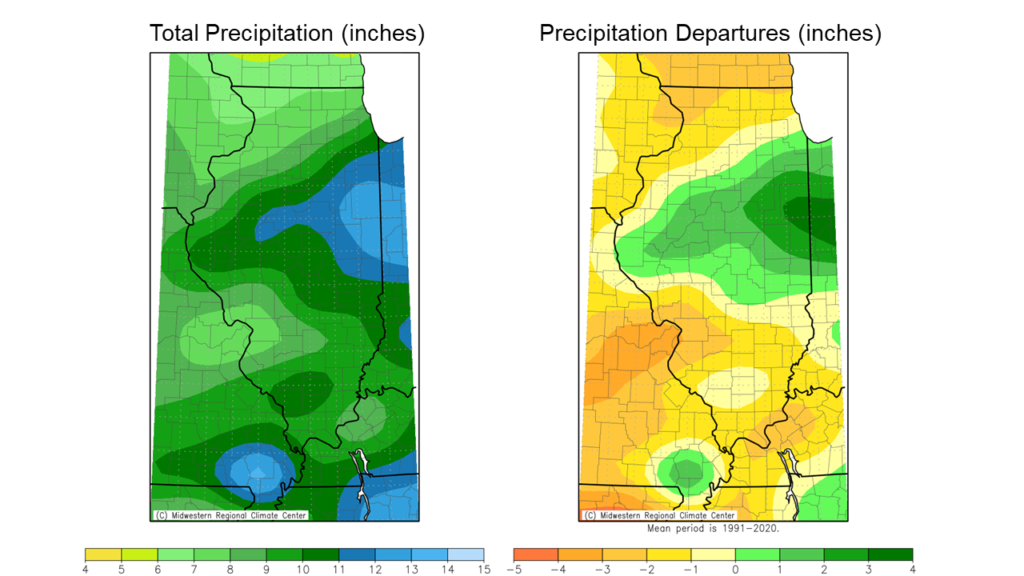
The maps below show the spatial variability of 2021 precipitation in more detail. Total annual precipitation ranged from less than 30 inches in northern Illinois to nearly 50 inches in southern Illinois. While most of northern Illinois was 4 to 8 inches drier than normal, most of central Illinois was 4 to 12 inches wetter than normal.


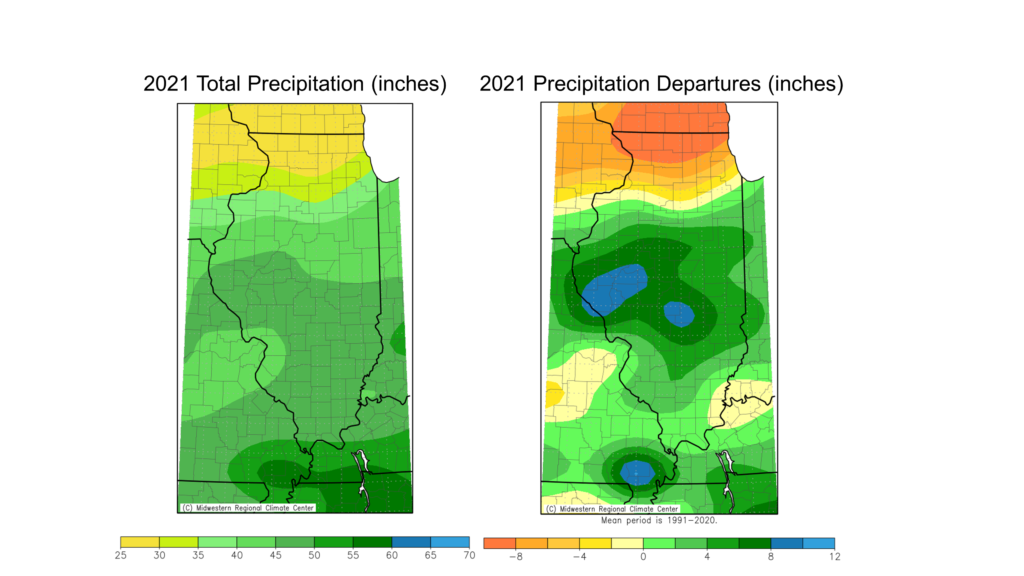
Figure 5. Maps show 2021 (left) total precipitation and (right) precipitation departure from normal.

One CoCoRaHS observer in Shelby County recorded 61 inches of precipitation in 2021, while several CoCoRaHS observers in Stephenson, Winnebago, Boone, McHenry, and Lake Counties observed less than 26 inches in 2021. The year 2021 was the 5th driest year on record in Rockford with just 24.2 inches (65 percent of normal) and the 10th driest year on record in Freeport.

Meanwhile, 2021 was also the 14th wettest year on record in Peoria, the 13th wettest year in Springfield, the 6th wettest year in Bloomington, the 8th wettest year in Danville, and the 15th wettest year in Jacksonville.
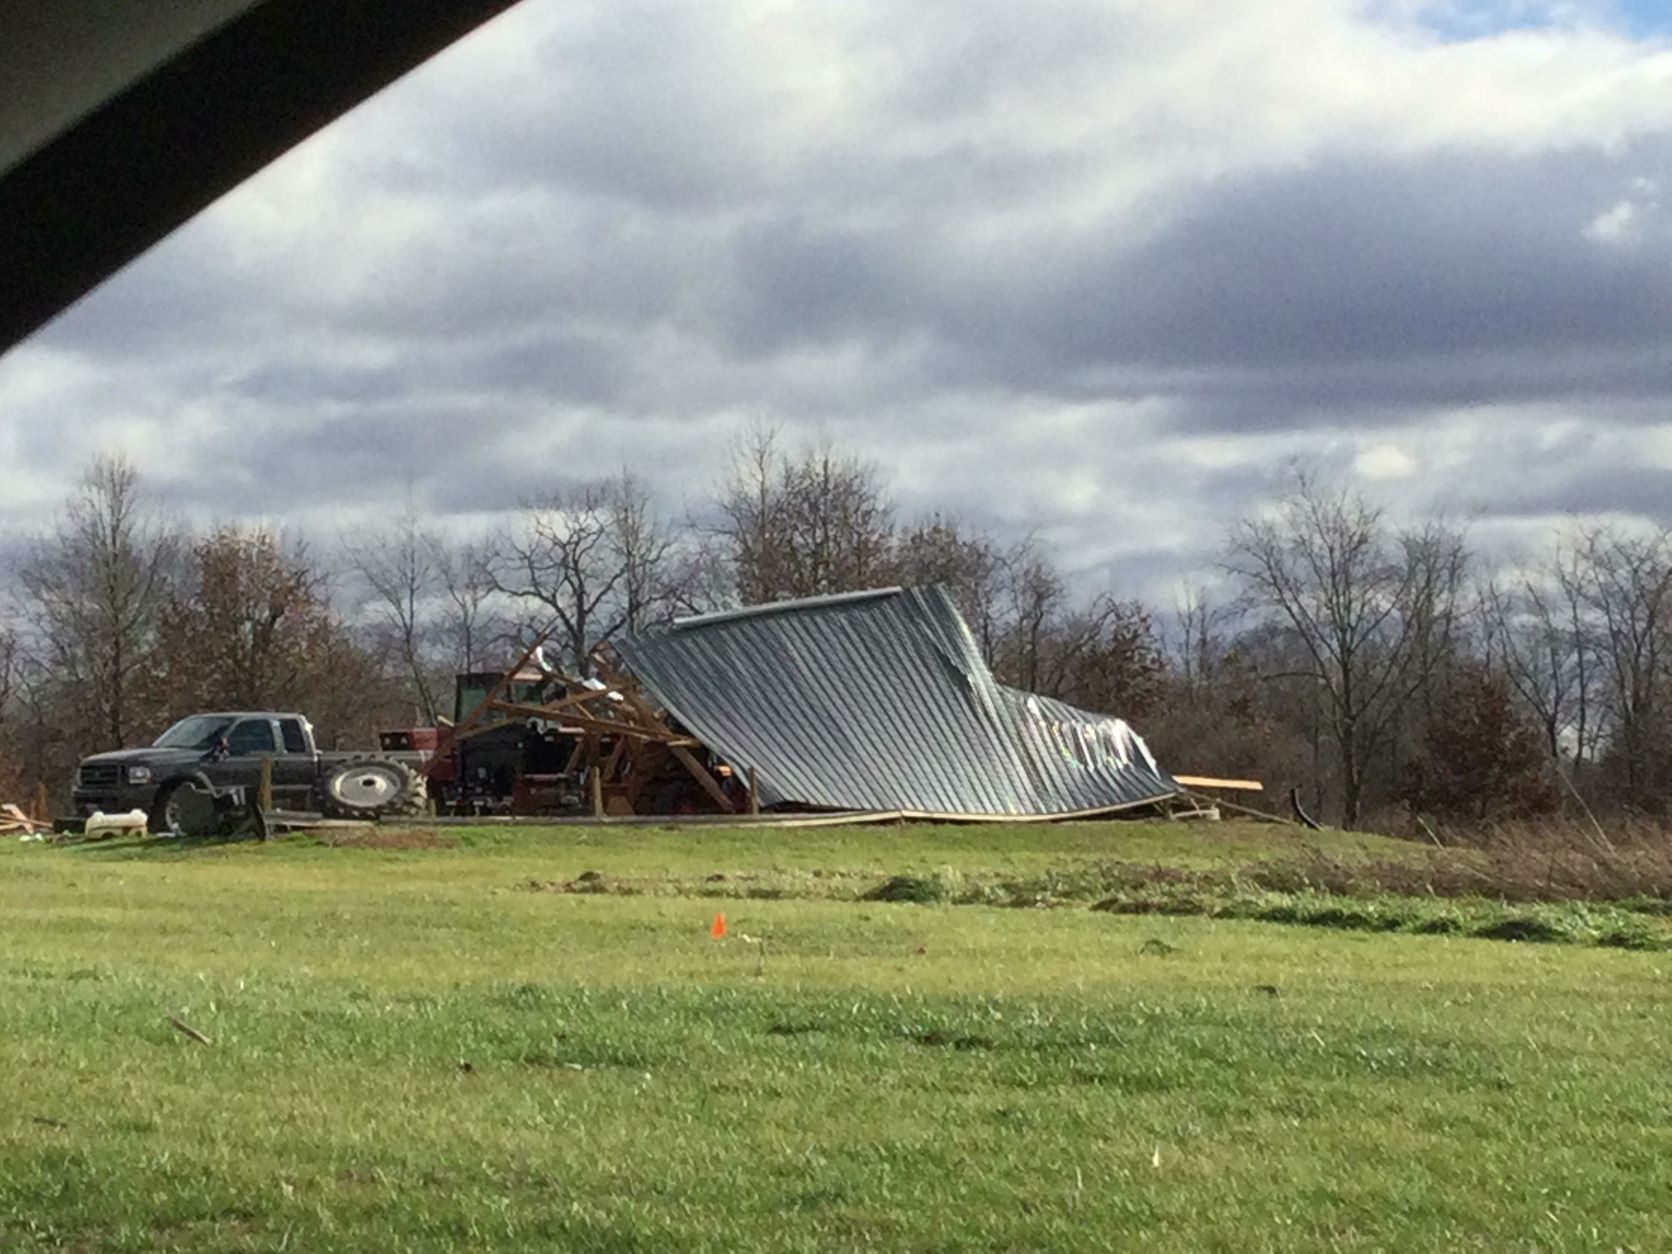
2021 Severe Weather

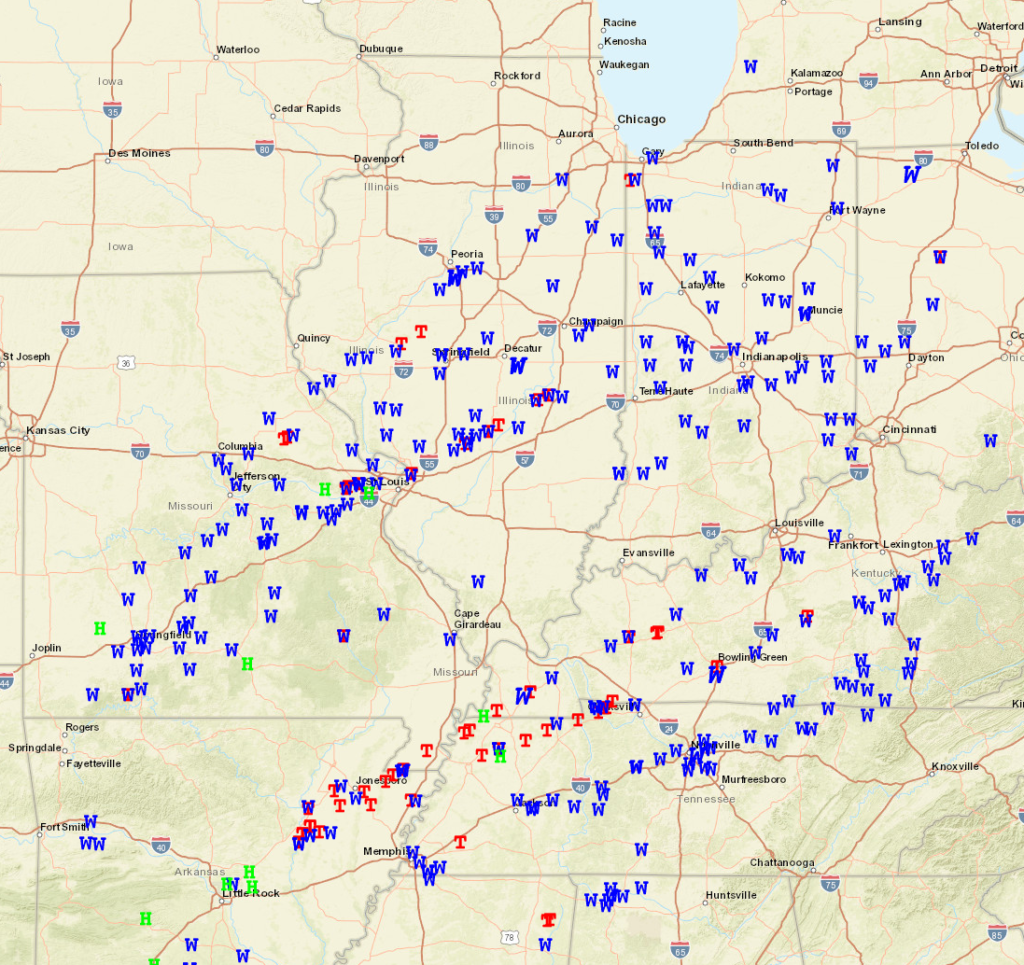
Last year brought more than its fair share of severe weather across Illinois. Most of our 102 counties were affected by strong wind, hail, or tornado events last year (Figure 6). Overall, the NOAA Storm Prediction Center showed 80 tornado reports, 64 hail reports, and 453 wind reports statewide in 2021.

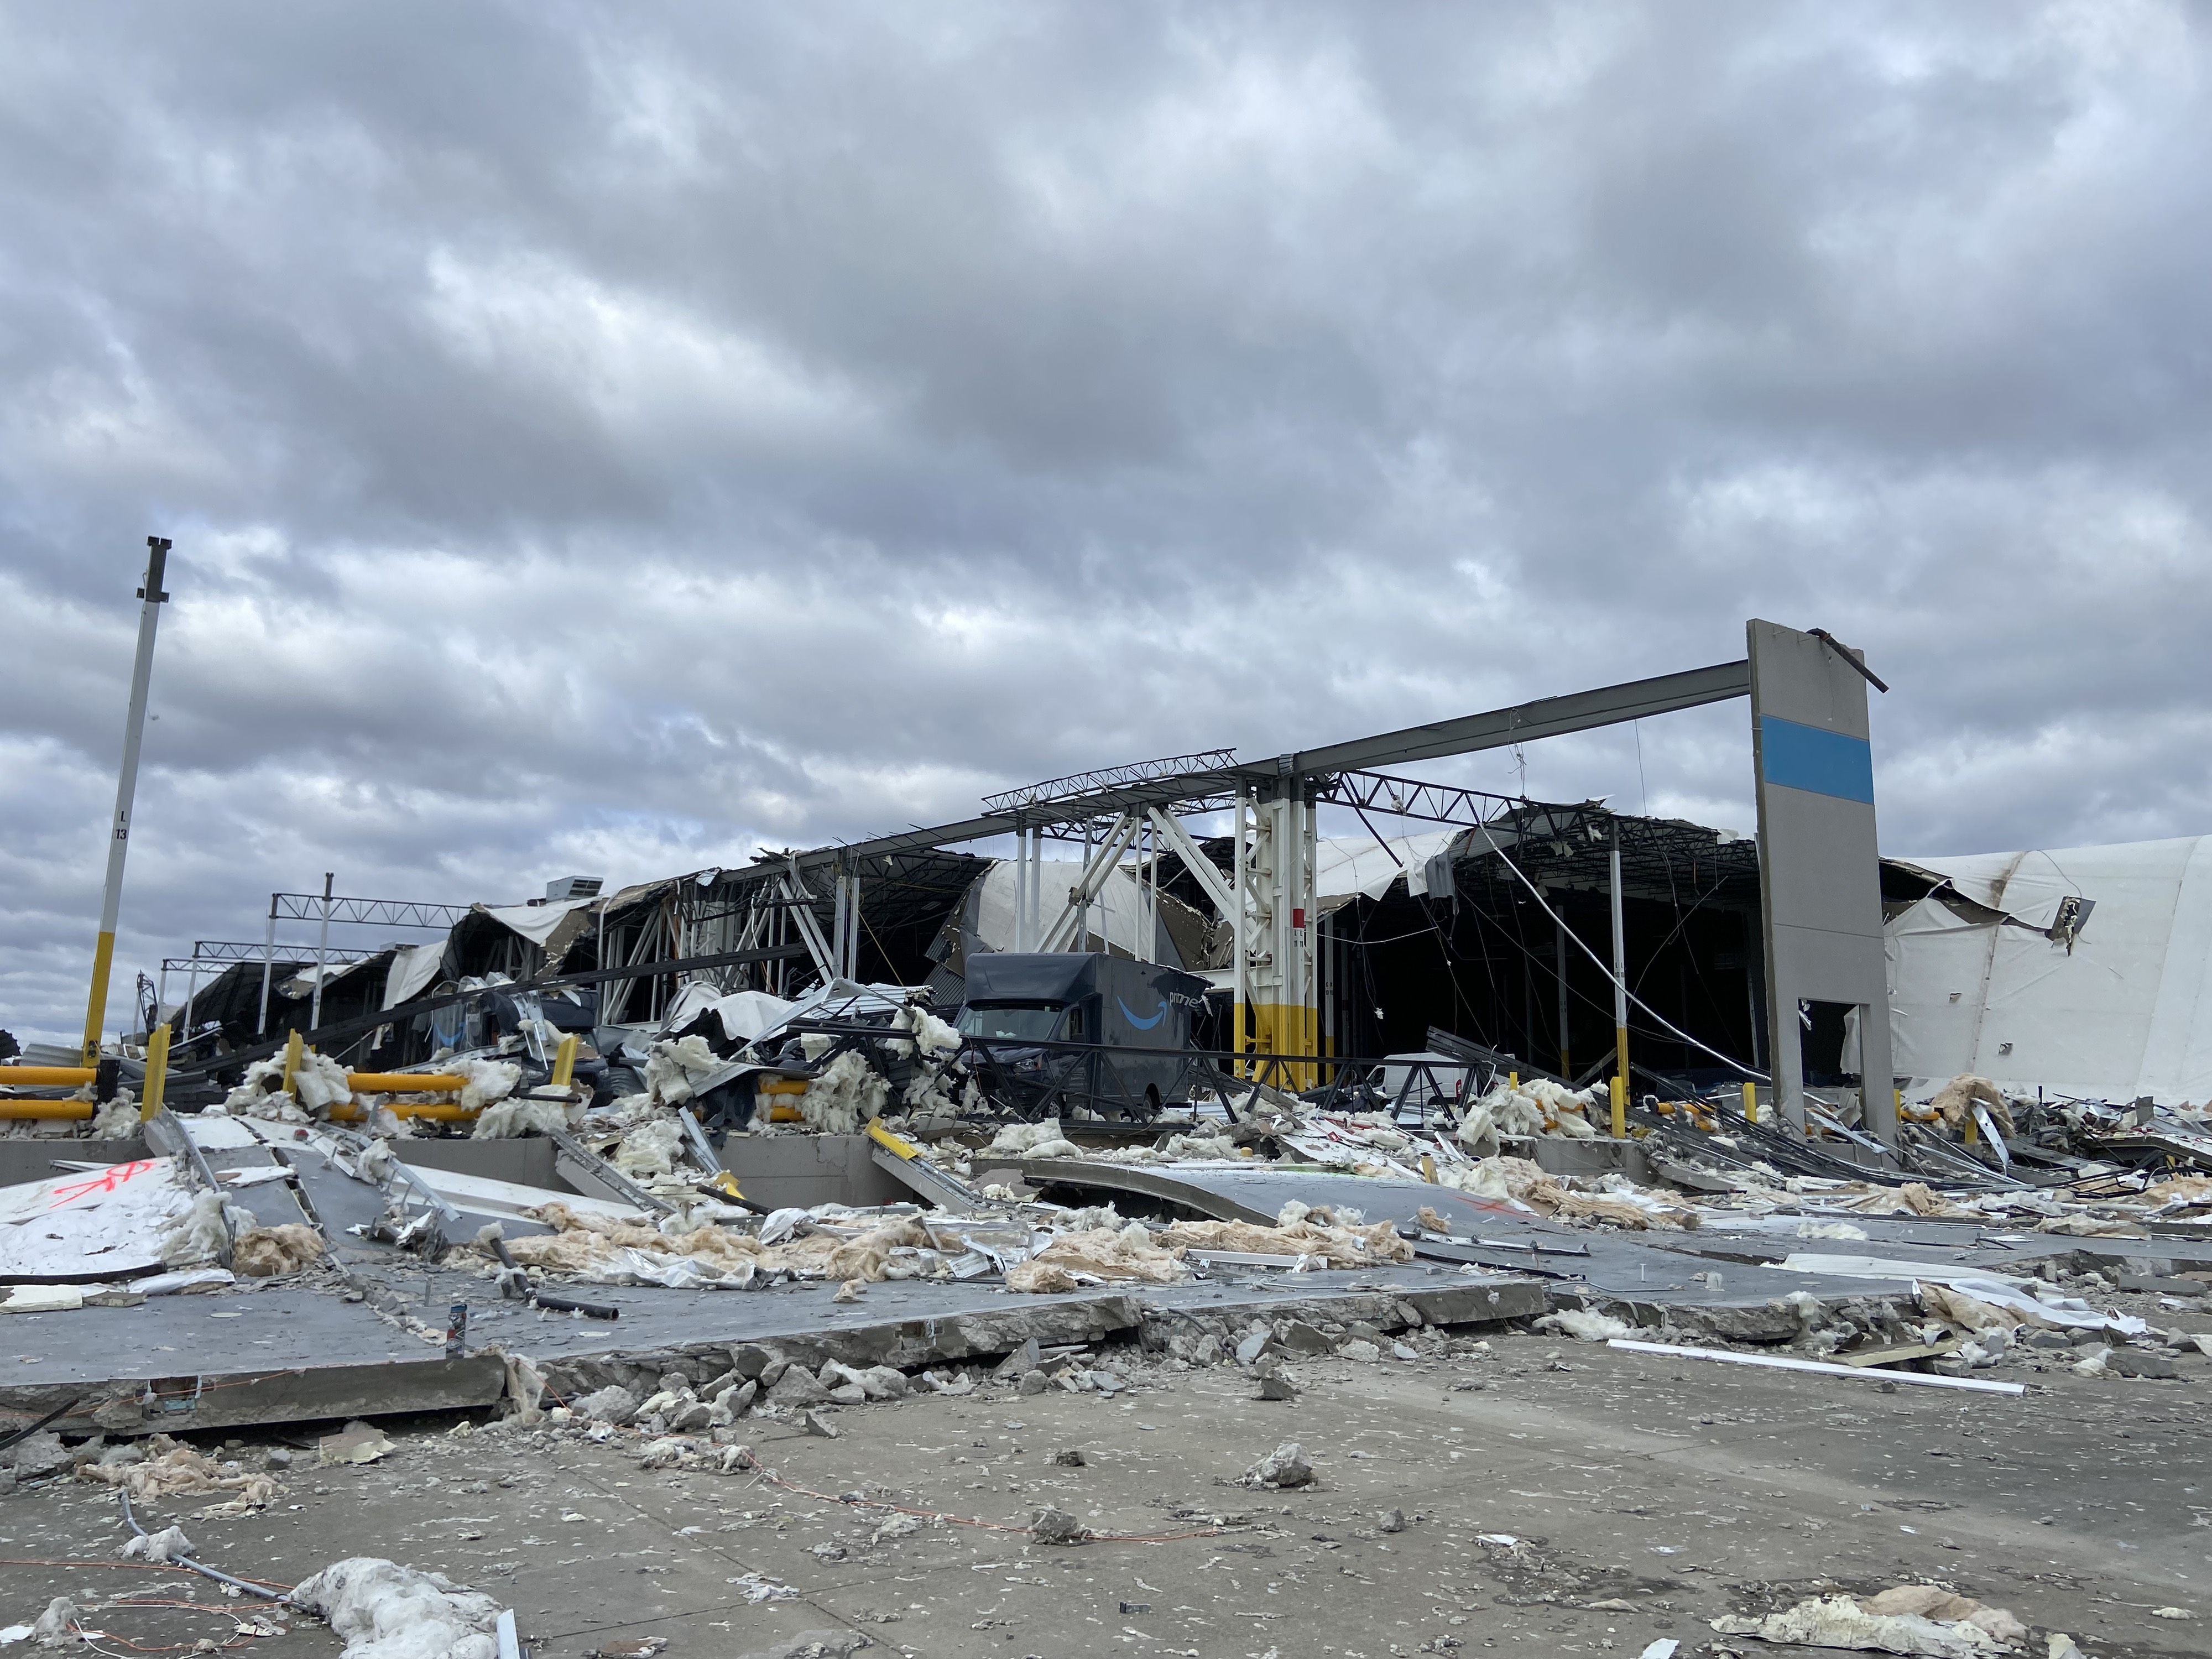
The 80 tornado reports compare to 74 in 2020 and just 51 in 2019 and a long-term average of about 60 tornadoes per year statewide. Unfortunately, the December 10 tornado outbreak included Illinois’ first tornado-related fatalities since 2017. More information on that severe weather event is available here: https://stateclimatologist.web.illinois.edu/2021/12/16/the-december-2021-tornado-outbreak-in-illinois/.

Figure 6. NOAA Storm Prediction Center report locations in 2021. Wind reports are shown in blue, hail in yellow, and tornado in red. Data are available at: https://www.spc.noaa.gov/climo/online/monthly/states.php?month=00&year=2020&state=IL.

Other noteworthy severe weather events included the June 20 EF-3 tornado in the Chicago suburbs of Naperville and Woodridge. This was the strongest tornado in the Chicago National Weather Service area since the 2017 Ottawa EF-3 event, and the strongest tornado this close to the city of Chicago since the 1991 Lemont EF-3 event. The year also brought several very heavy precipitation events across northern and central Illinois. Among these was a series of storms in late June that produced over 8 inches of rain in just 4 days in Bloomington-Normal (https://www.weather.gov/ilx/June24282021_storms), and storms that produced over 10 inches of rain in just 6 hours in Gibson City in Ford County (https://www.weather.gov/lot/2021aug12, https://atmos.illinois.edu/news/2021-09-17/story-map-gibson-city-flooding-event)

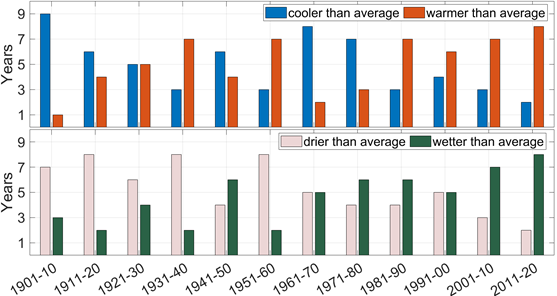
2021 Consistent with Long-term Trends

Both temperature and precipitation have increased across the state over the past century, which define climate change in Illinois. The plot below shows the number of years in each decade between 1901 and 2020 in which the statewide average temperature and total precipitation were above and below the 1901–2020 average. Recent decades have tended to have more warmer and wetter than average years, and the most recent decade (2011–2020) had the highest incidence of both warmer than average and wetter than average years, 8th out of 10 each.

Exceptionally Warm December Wraps up 2021

The preliminary statewide average December temperature was 39.4 degrees, 9.6 degrees above the 1991–2020 average and the second warmest on record going back to 1895. The preliminary statewide average total December precipitation was 2.70 inches, 0.02 inches above the 1991–2020 average and tied for the 40th wettest on record.  

Data are provisional and may change slightly over time

Unusually Warm December

December is the first month of climatological winter, but the weather felt more like an extension of fall throughout most of the month.

Figure 1 shows daily temperature departures from normal in Quincy. Most December days in Quincy were between 10 and 30 degrees warmer than normal, making last month the second warmest December on record in Quincy. December was also the warmest on record in Carbondale, the third warmest on record in St. Louis, Springfield, and Peoria, the fourth warmest in Rockford and Champaign-Urbana, and the fifth warmest in Chicago.


Figure 1. Daily December average temperature departures in Quincy.

December average temperatures ranged from the low 30s in northern Illinois to the high 40s in southern Illinois, between 6 and 12 degrees above normal (Figure 2). High temperatures regularly reached into the 70s last month in southern Illinois, including a 78-degree high in Randolph County on December 4. Carbondale recorded 74 degrees on December 25, one of the warmest Christmas Day temperatures on record in the state. Although fleeting, we did see very cold temperatures in December, including nighttime lows in the single digits across much of northern Illinois.

Figure 2. Maps of (left) December average temperature and (right) December average temperature departures from normal.

Overall, the preliminary statewide average December temperature was 39.4 degrees, 9.6 degrees above the 1991–2020 average and the 2nd warmest on record going back to 1895.

Where is the Snow?

November was drier than normal virtually everywhere in the state, and that dryness persisted in December for the western half of the state. Total December precipitation ranged from around 1 inch in far western Illinois to nearly 6 inches in far southeast Illinois (Figure 3). Most of western Illinois was 0.50 to 1.5 inches drier than normal, whereas eastern and southern Illinois were near to 0.50 inches wetter than normal for the month.

Figure 3. Maps show (left) total December precipitation and (right) December precipitation departure from normal.

Snowfall essentially requires two ingredients: (1) cold-enough temperatures to permit the snow to reach the ground and (2) enough moisture in the air to precipitate as snow. In December we generally had enough moisture in the air, but the persistently warm weather ensured most of the month’s precipitation was in liquid form. Consequently, snowfall was 1 to 8 inches below normal in December. Snow totals ranged from 4 inches in far northwest Illinois to 0 south of Interstate 72 (Figure 4).

Figure 4. Maps show (left) total December snowfall and (right) December snowfall departure from normal.

Many places did not record their first measurable snow until the last week of the month. Chicago recorded their first measurable snowfall of the season on December 28, eight days later than the previous recorded latest first snowfall (December 20, 2012). Most places in south-central and southern Illinois did not record any measurable snowfall in December, including in Springfield. The capital city has made it to January 1 without measurable snowfall only twice in its 120-year record, in 1912 and in 2020. 

With the liquid water content of snow and rainfall taken together, the preliminary statewide average total December precipitation was 2.70 inches, 0.02 inches above the 1991–2020 average and tied for the 40th wettest on record.  

December Severe Weather

Severe weather, including tornadoes, hail, and strong winds, tend to have the highest frequency in Illinois between April and June. However, unlike Atlantic hurricanes or extreme cold, Illinois does not have a “tornado season” because tornadoes and other severe weather can and do occur all year in the Land of Lincoln. This past month we got an awful reminder of this fact.

The exceptionally warm weather and large-scale dynamics in December made for conducive conditions for severe weather, and indeed we had more than our fair share of severe weather last month. The most noteworthy event was on the night of December 10, when severe thunderstorms moved across the southern Midwest and the mid-south, resulting in multiple very strong tornadoes in Illinois, Missouri, Arkansas, Tennessee, and Kentucky.

The tornado outbreak was responsible for dozens of fatalities across the area, including six deaths in Illinois, many injuries, and damage or destruction to thousands of homes and structures. More details on the Illinois-side of the severe weather outbreak are here: https://stateclimatologist.web.illinois.edu/2021/12/16/the-december-2021-tornado-outbreak-in-illinois/.

Overall, the NOAA Storm Prediction Center shows nine tornado reports in Illinois for December. Illinois averaged just over one December tornado per year between 1950 and 2020.

 Outlooks

After a wimpy start to climatological winter, near and longer term outlooks are indicating the potential for real winter weather in the Midwest. Meanwhile outlooks for the entire month of January show the highest odds of near to below normal temperatures and above normal precipitation, still reflecting some of the weakening La Niña pattern in the Pacific (Figure 5).

Figure 5. Climate Prediction Center (left) temperature and (right) precipitation outlooks for January.

The December 2021 Tornado Outbreak in Illinois

Severe thunderstorms developed in the late afternoon, evening, and night of Friday December 10, 2021. Among strong winds and hail, several tornadoes occurred in Arkansas, Missouri, Tennessee, Kentucky, and Illinois, including multiple very strong tornadoes. The tornado outbreak was responsible for dozens of fatalities across the area, including six deaths in Illinois, many injuries, and damage or destruction to thousands of homes and structures.

Tornadoes in Illinois

As of Wednesday, December 15, the NOAA Storm Prediction Center listed 85 tornado reports from the December 10 outbreak, including 12 here in Illinois. Figure 1 shows the location of those reports (T = tornado, W = wind, H = hail). The official numbers will be released later and may vary slightly from these reports.

Figure 1. Location of NOAA Storm Prediction Center reports from December 10, 2021. T = tornado, W = wind, H = hail. Source: https://www.spc.noaa.gov/exper/archive/event.php?date=20211210.

As of December 15, the Lincoln National Weather Service (NWS) office reports four EF-2 tornadoes affected parts of central and western Illinois on December 10 including Cass, Menard, Shelby, Moultrie, and Coles Counties. These tornadoes caused damage to homes, businesses, farm buildings, trees, and power lines. There was one injury attributed to the Shelby County tornado, but no human fatalities from these events. One horse was killed and another injured in Cass County. The Lincoln NWS office’s reports are available here: (https://www.weather.gov/ilx/December2021SvrWxUpdate).

Damage northwest of Cowden
Photo shows farm building damage near caused by an EF-2 rated tornado near Cowden, IL in Shelby County. Photo source: Lincoln NWS.

As of December 15, the St. Louis National Weather Service (NWS) office reports two tornadoes that affected the Illinois side of their area, along with several other tornadoes on the Missouri side of the river. Among these tornadoes was an EF-3 (very strong) event around the Pontoon Beach and Edwardsville areas. The tornado struck an Amazon fulfillment center in Edwardsville, and the event was responsible for six fatalities (confirmed as of December 15) and a yet unknown number of injuries. This event was the first with tornado-related fatalities in Illinois since 2017. The EF-2 Shelby County tornado reported by the Lincoln NWS office touched down earlier in Bond County and moved through parts of Montgomery and Fayette Counties, causing damage to multiple farm buildings and trees. The St. Louis NWS office’s reports are available here: https://www.weather.gov/lsx/12_10_2021.  

EF-3 tornado damage to Amazon warehouse southwest of Edwardsville, IL.
Photo shows damage of the EF-3 tornado damage at an Amazon warehouse facility southwest of Edwardsville, IL. Photo source: St. Louis NWS.

Parts of Arkansas, Missouri, Kentucky, and Tennessee were also hit hard by multiple, violent tornadoes that night. Details on the long-track Kentucky tornado are available on the Paducah NWS Office page: https://www.weather.gov/pah/December-10th-11th-2021-Tornado.

Wind Damage

As of December 15, the NOAA Storm Prediction Center lists 43 wind reports from the December 10 event. The reports spanned from Grundy and Kankakee Counties in northern Illinois to Jackson County in southern Illinois. Among these are several reports of straight-line (i.e., not tornadic) wind damage to homes, farm buildings, trees, and power lines. Multiple semis were blown over in central and western Illinois.

Many of the reports of strong winds and damage are not associated with a confirmed wind gust measurement. However, those that did have a confirmed measurement include an 85 mph gust in Tazewell County that destroyed their salt dome outside of Tremont (https://www.hoiabc.com/2021/12/12/tazewell-county-highway-dept-salt-dome-damaged-storms/). A personal weather station also recorded an 80-mph gust just southeast of Decatur in Macon County.

How Rare are December Tornadoes?

We have updated the Illinois tornado climatology and plots that were originally created by Jim Angel and Michael Patrick at the University of Illinois. The plots show tornado reports across the state between 1950 and 2020, so they do not include the December 10 event.

Figure 2 shows the frequency of tornadoes by month between 1950 and 2020. About 64percent of tornadoes over that time occurred between April and June; however, tornadoes do occur outside of this time frame. For example, between 1950 and 2020, more tornadoes occurred in November and February together than in September and October together.

Figure 2. Frequency of Illinois tornadoes between 1950 and 2020.

Figure 3 shows the number of tornado-related fatalities in Illinois by month. April is the deadliest month with 97 reported deaths, mostly due to the 58 deaths from the 1967 Oak Lawn tornado outbreak. The second deadliest month was August, mostly due to the 29 deaths associated with the August 28, 1990 Plainfield tornado.


Figure 3. Tornado-related fatalities in Illinois by month between 1950 and 2020.

December was the fourth deadliest month in Illinois despite having the fourth  fewest tornadoes. Between 1950 and 2020, December tornadoes accounted for 3 percent of all tornadoes in Illinois, but 8 percent of all tornado-related fatalities. Similarly, Illinois tornadoes that have occurred in winter comprised 7 percent of all events between 1950 and 2020, but over 16 percent of all tornado-related fatalities.

A Mild November Wraps Up Climatological Fall

The preliminary statewide average November temperature was 40.7 degrees, 1.0 degrees below the 1991–2020 average and 53rd coldest on record going back to 1895. The preliminary statewide average total November precipitation was 1.00 inches, 2.31 inches below the 1991–2020 average and the 9th driest on record.  

Data are provisional and may change slightly over time

Typically Atypical November Temperatures

November is a month of change and of variability. Cool air moves in from the northwest and competes with the warmer, southerly air masses that dominate earlier in the fall. Therefore, the archetype of November temperatures is variability, and this month followed suit.

Figure 1 shows daily temperature departures from normal in Mt. Vernon. Following a very warm October, the first week of November was 5 to 8 degrees cooler than normal. Temperatures climbed back above normal in the second week of the month, but then followed a consistent back and forth variation between cooler and warmer weather.

Figure 1. Daily November average temperature departures in Mt. Vernon.

November average temperatures ranged from the high 30s in northern Illinois to the low 40s in southern Illinois, between 1 and 4 degrees below the 1991–2020 normal (Figure 2). Several stations saw daily high temperatures in the 70s early in November, including a 75-degree high in Randolph County. Meanwhile, several stations in northern and central Illinois reached nighttime minimum temperatures well below 20 degrees, including a 10-degree low in Knox and Warren Counties. Mild temperatures this past month did not break any local daily high maximum or high minimum temperature records in Illinois; however, the daily low minimum temperature records on November 4 and 5 were broken in Casey in Cumberland County.

Figure 2. Maps of (left) November average temperature and (right) November average temperature departures from normal.

Overall, the preliminary statewide average November temperature was 40.7 degrees, 1.0 degrees below the 1991–2020 average and 53rd coldest on record going back to 1895.

November wrapped up the climatological fall season. Despite the cooler weather in November, fall temperatures were 1 to 4 degrees above normal with the largest departures in northern Illinois (Figure 3).


Figure 3. Maps of (left) fall average temperature and (right) fall average temperature departures from normal.

Dry November

The taps turned off across the state following the fourth wettest October on record statewide. Total November precipitation ranged from less than a quarter of an inch in northwest Illinois to just over 2 inches in southeast Illinois, between 2 and 4 inches below normal (Figure 4). This past month was the second driest on record in Rockford, with only 0.45 inches, and the third driest on record in St. Louis with only 0.35 inches.  


Figure 4. Maps show (left) total November precipitation and (right) November precipitation departure from normal.

The dry conditions added to existing precipitation deficits in northern Illinois, and in response we did not see much change in the U.S. Drought Monitor this past month. Most areas between Whiteside County in northwest Illinois and Lake County in northeast Illinois remain in moderate to severe drought as year-to-date precipitation deficits of 6 to 12 inches remain. January 1 through November 30 is the second driest on record in Rockford, greater only than 2012. Rockford will need at least 1.11 inches of precipitation in December to keep 2021 from being the driest calendar year on record there.

The preliminary statewide average total November precipitation was 1.00 inches, 2.31 inches below the 1991–2020 average and the ninth driest on record going back to 1895.  

The climatological fall total precipitation ranged from just over 6 inches in northwest Illinois to over 13 inches in eastern Illinois. Fall was 1 to 4 inches drier than normal in most of northern and southern Illinois and between 1 and 4 inches wetter than normal in central Illinois (Figure 5).

Figure 5. Maps show (left) total fall precipitation and (right) fall precipitation departure from normal.

December & Winter Outlooks

December is the official start of climatological winter. The most recent December outlooks from the Climate Prediction Center are leaning into a warmer than normal start to winter with an equal chance of above and below normal precipitation for December (Figure 6).


Figure 6. Climate Prediction Center (left) temperature and (right) precipitation outlooks for December.

Revised outlooks for the climatological winter, December through February, are still showing a La Niña pattern with the highest likelihood of a warmer and wetter winter overall (Figure 7).


Figure 7. Climate Prediction Center (left) temperature and (right) precipitation outlooks for December through February.