The preliminary statewide average April temperature was 49.6 degrees, 2.7 degrees below the 1991–2020 average and tied for the 30th coldest on record going back to 1895. The preliminary statewide average total March precipitation was 3.74 inches, 0.06 inches below the 1991–2020 average and the 73rd driest on record statewide.
Data are provisional and may change slightly over time
Where is Spring?
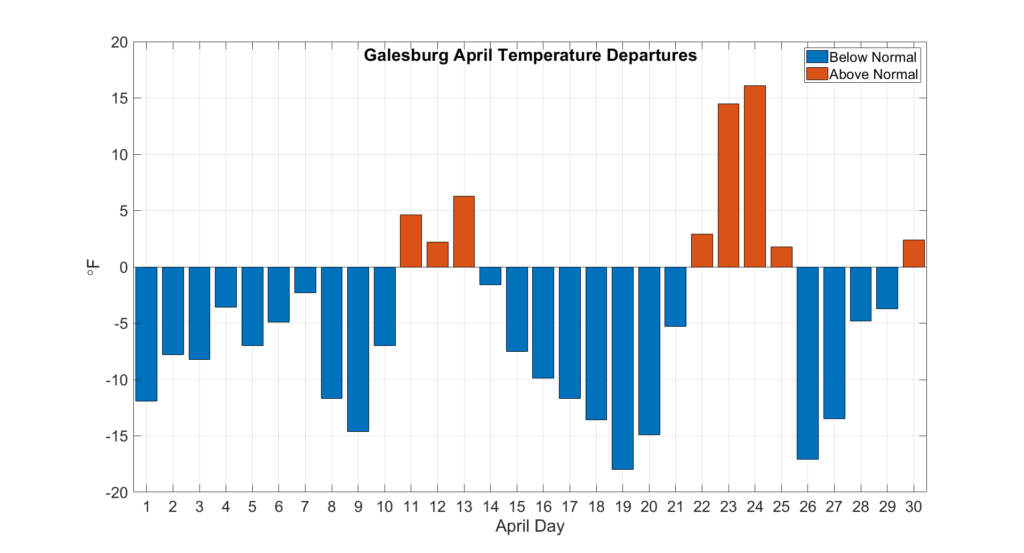
It’s not a stretch to say that most in Illinois are ready for warm weather by the time we hit mid-April. However, this year did not deliver as April temperatures were persistently well below normal. As Figure 1 shows with daily temperature departures from Galesburg, most days this past month were 5 to 10 degrees colder than normal. Only 8 out of 30 April days in Galesburg were warmer than normal, and most by only a few degrees.
As a result of the colder weather, most of the state experienced below freezing temperatures as late as mid-April, and frost was reported as far south as the St. Louis Metro East on April 26.
April average temperatures ranged from the low 40s in northern Illinois to the mid-50s in southern Illinois, between 1 and 6 degrees below normal (Figure 2). The coldest point in the state last month was Galena in Jo Daviess County with an average temperature of 40.8 degrees (6 degrees below normal). The warmest point in the state was Cairo in Alexander County with an average temperature of 56.1 degrees (2.5 degrees below normal). On some of the few warmer April days, many stations in Illinois hit highs in the mid-80s, including 86 degrees on April 23 in Chicago, Moline, and Quincy. Meanwhile, many stations in northern and central Illinois regularly experienced low temperatures in the mid- to low 20s, including 22 degrees on April 17 in Freeport, Rockford, and Normal.
Altogether, daily high maximum temperature records were broken last month at 9 stations, and daily high minimum temperature records were broken at 17 stations. Daily low maximum temperature records were broken last month at 12 stations, and daily low minimum temperature records were broken at 24 stations.
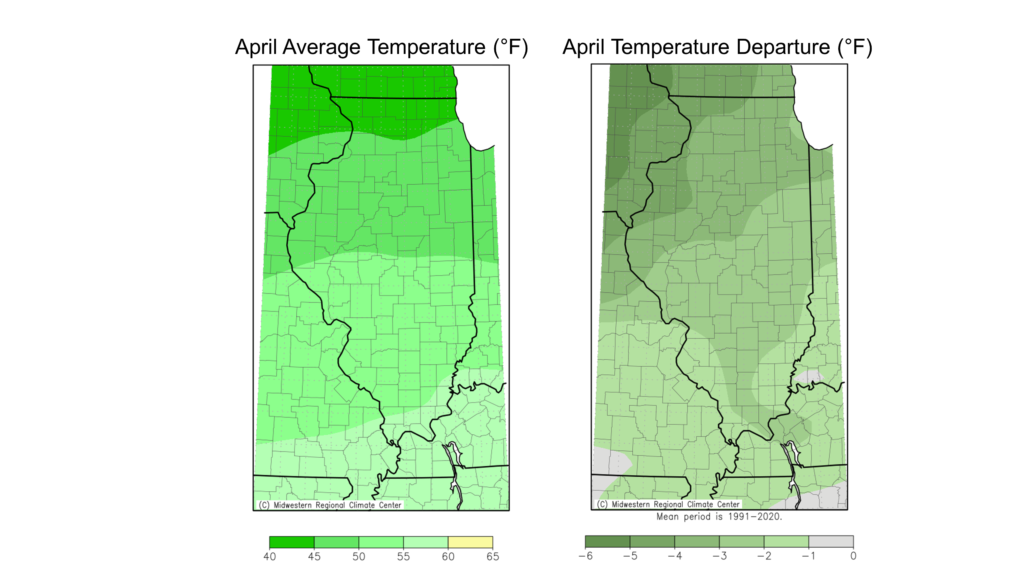
Overall, the preliminary statewide average April temperature was 49.6 degrees, 2.7 degrees below the 1991–2020 average and tied for the 30th coldest on record going back to 1895.
Rainy April
Given how persistently rainy last month was, we best have a plethora of May flowers. For most places, the total amount of April precipitation was not excessive, and some areas were drier than normal. However, precipitation frequency last month was unusually high as most places recorded 12+ days with some measurable precipitation. Macomb had 22 days with measurable precipitation last month, Aurora had 20, Champaign had 19, and Cairo had 18. The 22 wet days in Macomb last month set a new record for April, which was the 2nd highest frequency of any month on record, only less than the 23 wet days in Macomb in October 2009. Frequent, small precipitation meant most places only had 2 to 2.5 days between precipitation events last month, which stymied fieldwork statewide.
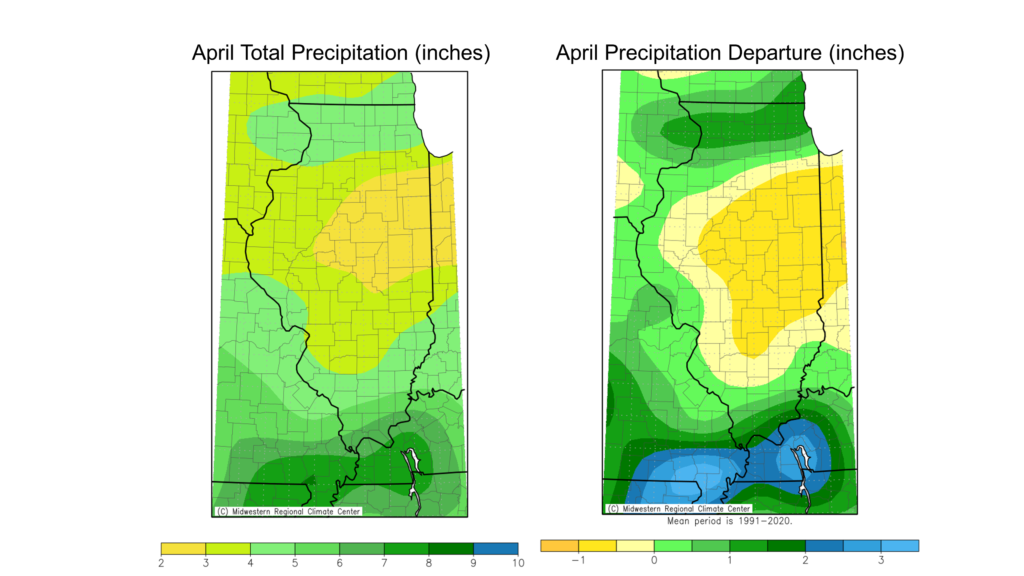
Oddly, extremely frequent precipitation did not amount to extreme totals last month. Total April precipitation ranged from just under 3 inches in east-central Illinois to over 6 inches in far southern Illinois (Figure 3). Most areas north of Interstate 80 and south of Interstate 64 were 1 to 2 inches wetter than normal last month. Meanwhile, despite many places in central Illinois having recorded 15–20 days with measurable precipitation last month, most of the central part of the state was near to slightly drier than normal. For example, Champaign recorded 19 days in April with measurable precipitation, but still ended the month about 1.4 inches drier than normal.
The persistently wet and cool month did make quite a dent in drought conditions in northern Illinois. Soil moisture and streamflow across northern Illinois have recovered to pre-drought conditions, and in response the U.S. Drought Monitor eliminated all drought across the state on April 26. That ended a 55-consecutive-week stretch of some drought in Illinois, the longest in the 20+ year Drought Monitor record.
Groundwater levels in northern Illinois are the lone remaining legacy of the drought as they have yet to fully recover. Groundwater levels tend to respond much more slowly going into and coming out of drought, so it is not unexpected to see groundwater drought conditions remaining. However, if the wet pattern continues, we should see more improvement in groundwater conditions in northern Illinois.
Meanwhile, the lack of extreme rainfall last month kept most serious flooding at bay. However, soils across the state remained wet due to frequent rain and cooler temperatures. This caused fieldwork and planting delays, especially in southern Illinois, where conditions remain wetter than normal for this time of the year.
Overall, the preliminary statewide average total March precipitation was 3.74 inches, 0.06 inches below the 1991–2020 average and the 73rd driest on record statewide.
April Snow
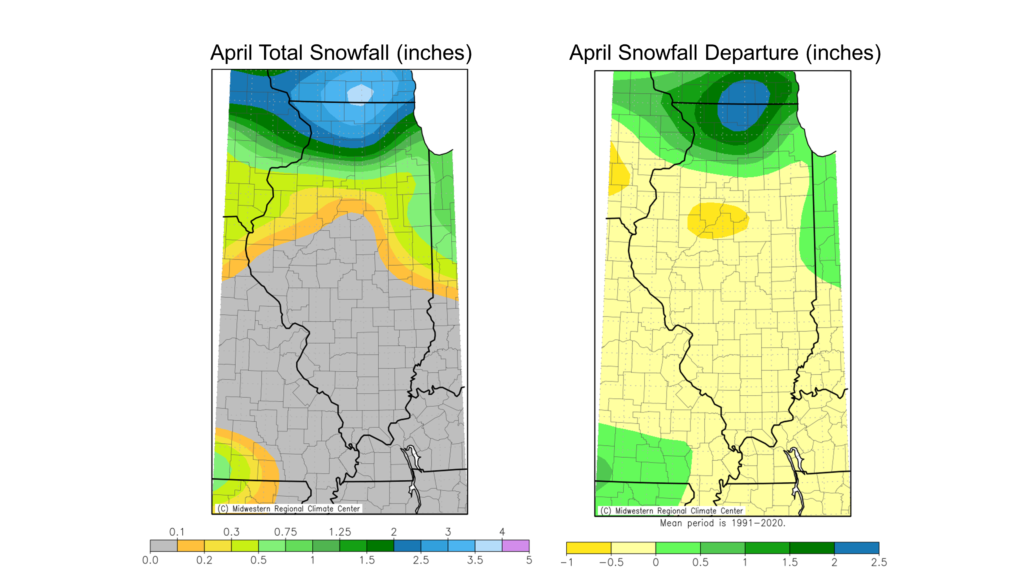
April snow is not unusual for the northern half of the state; however, this month the white stuff stayed mostly north of Interstate 80. As Figure 4 shows, April snowfall totals ranged from just over a tenth of an inch along and north of Interstate 74 to over 3 inches around the Rockford area. April snowfall was between 0.5 and 2.5 inches above normal in northern Illinois, thanks to the persistently cooler temperatures.
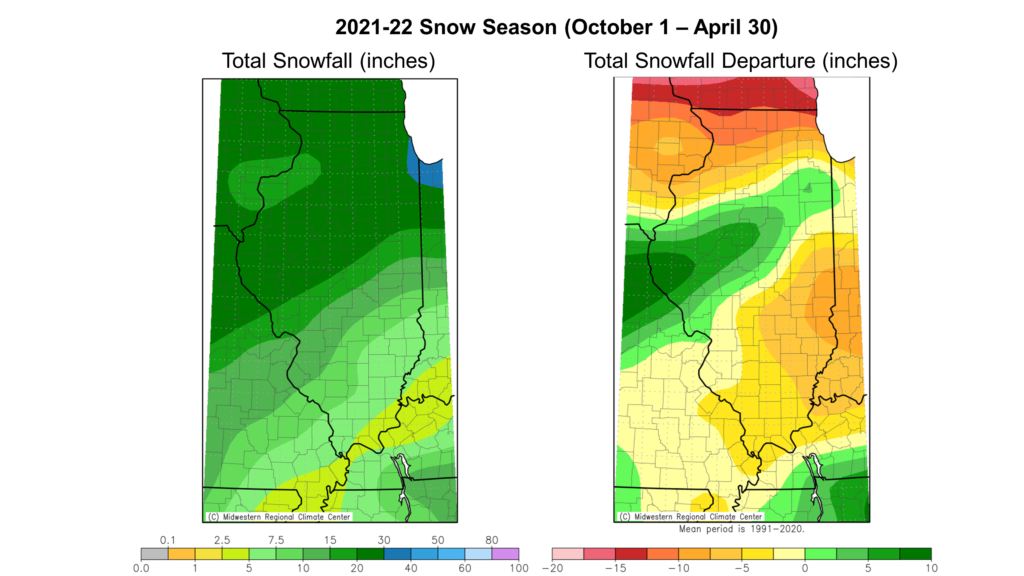
To be sure to account for late April snow, I don’t officially declare the snowfall season over until May 1. Now that we’re there we can look at how this past snowfall season–defined as October 1, 2021 to April 30, 2022–shaped up (Figure 5). Total season snowfall ranged from just over 30 inches in northeast Illinois to less than 5 inches in far southern Illinois. Most of the state was 5 to 15 inches below normal on snowfall this season, except for a narrow band from Calhoun County to Will County, which had 1 to 10 inches above normal. This strip of the state was repeatedly the target of winter storms, including the February 2–4 storm that produced as much as 20 inches over three days.
May & Early Summer Outlooks
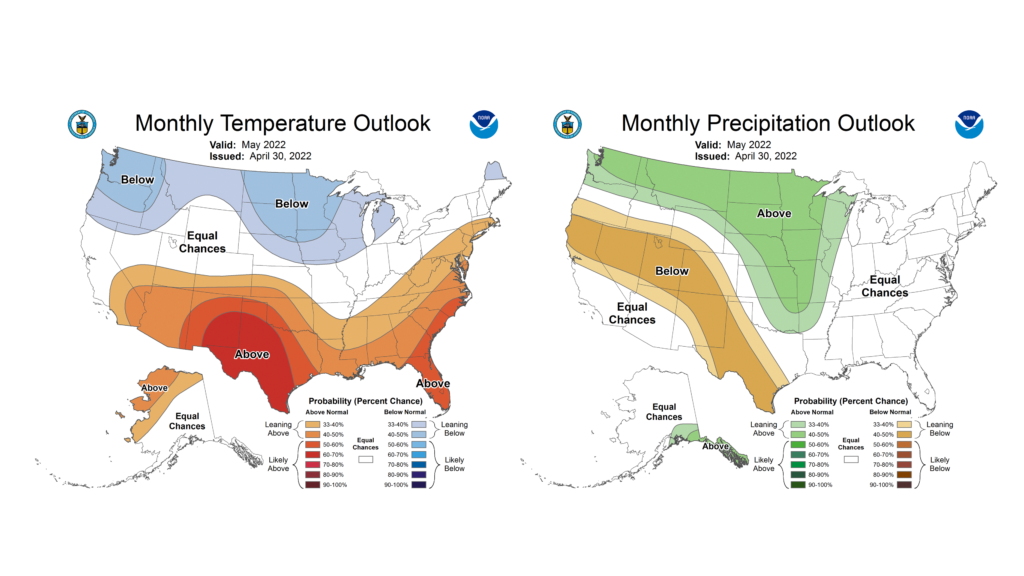
May is the final month of climatological spring and represents the transition from spring to summer weather. The most recent Climate Prediction Center outlooks suggest May could be a real transition month between what has been a colder spring and what may be a warmer summer.
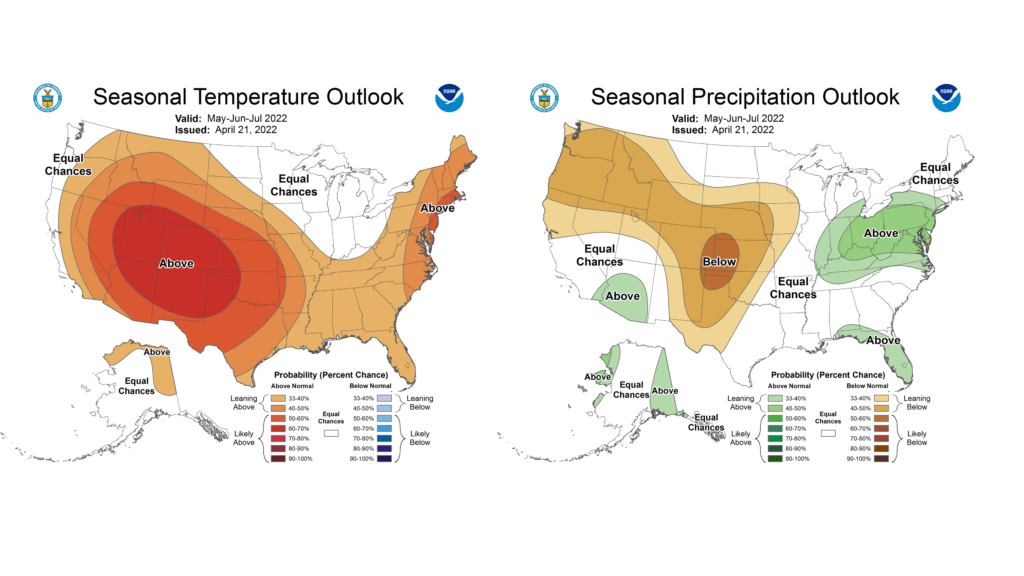
Outlooks for the month of May lean to below normal temperatures persisting from April in northern Illinois, with an equal chance of above and below normal temperatures in central and southern Illinois (Figure 6). However, the three-month (May–July) outlooks begin to lean to warmer than normal temperatures to start summer (Figure 7), and these chances increase as we move into the heart of summer, June–August.
On the precipitation side, May outlooks lean a bit wetter than normal for western Illinois but show equal chances of wetter and drier than normal rainfall for the rest of the state (Figure 6). The May–July outlooks put Illinois between higher chances of drier conditions to our west and wetter conditions to our east (Figure 7). As we move into summer, forecasts for June–August begin to move to higher chances of dry conditions farther east into western Illinois. The potential to go drier in the summer is a pattern we’ll want to keep our eye on through May and into June, but it’s important to note seasonal forecasts are typically the least confident in climatological summer. So, a lot can happen between now and June.
