A Mild August Wraps up Summer in Illinois

The preliminary statewide average August temperature was 73.8 degrees, 0.2 degrees above the 1991–2020 average and the 58th warmest on record going back to 1895. The preliminary statewide average total August precipitation was 4.10 inches, 0.45 inches above the 1991–2020 average and the 41st wettest on record statewide.    

Data are provisional and may change slightly over time.

A Very Mild (And Well Deserved) August

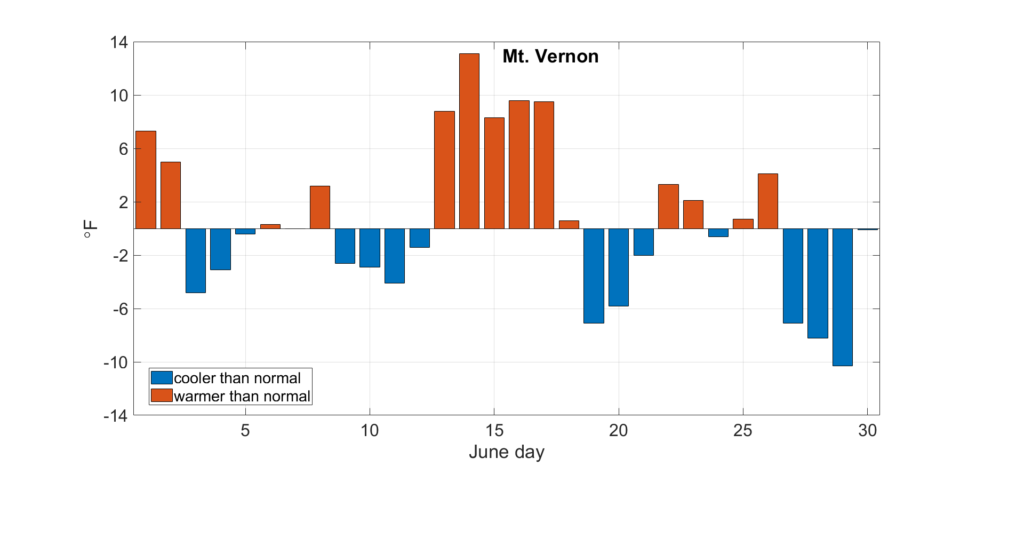
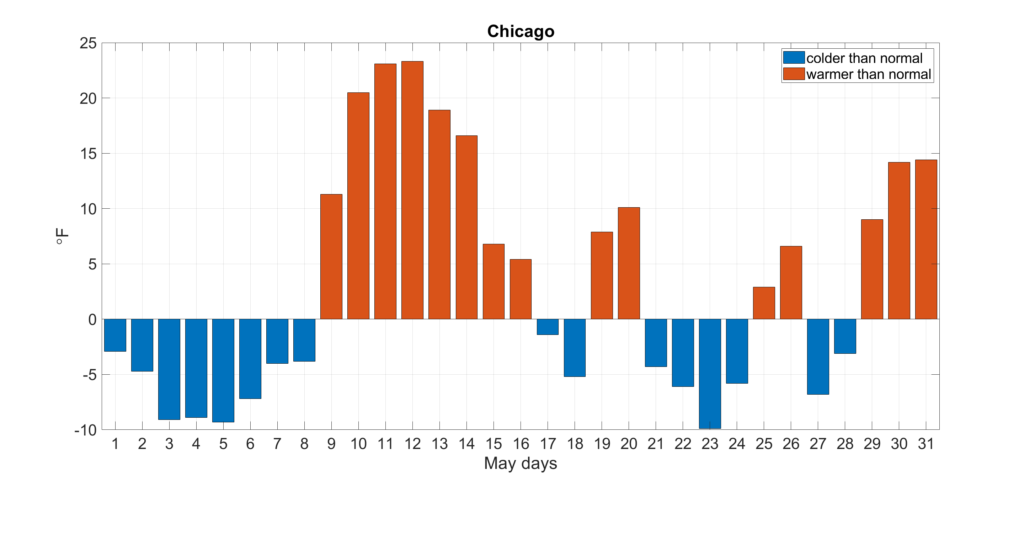
May kicked off summer early in Illinois with a very unusual heat wave. Then came a very warm June that had this winter lover wishing for sweater weather. Fortunately, a slightly cooler July was followed by a very mild August. As the temperature departures from Bloomington-Normal in Figure 1 show, the only prolonged warm period last month was in the first week, when temperatures were 5 to 10 degrees above normal. Only 5 of the past 21 days in August were warmer than normal, giving Illinoisans the nice end to summer we deserved.

Figure 1. Daily August average temperature departures in Bloomington-Normal.

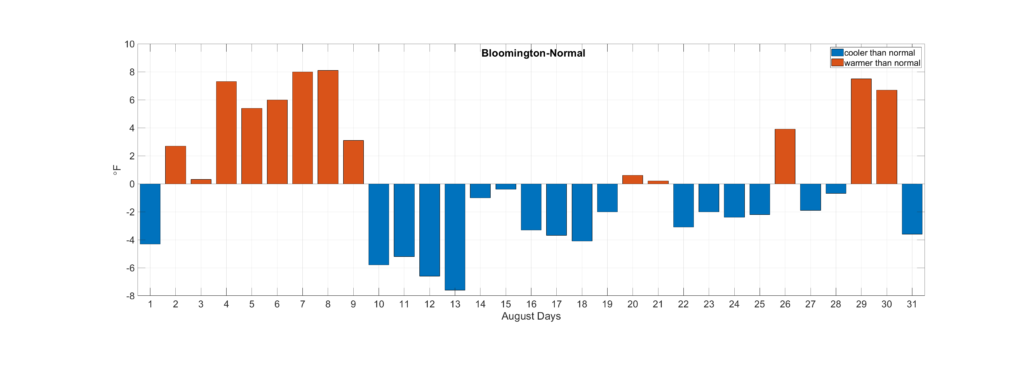
During the hot week at the beginning of the month, high temperatures regularly reached into the 90s across the state, including 96 degrees in Cahokia Heights and 95 degrees at Chicago Midway. However, the cold front that moved through the state around August 9 brought much cooler, drier air into the region. Nighttime low temperatures in the second and third weeks of the month dipped into the 50s across the state, including 50 degrees in Woodford and Pike counties.

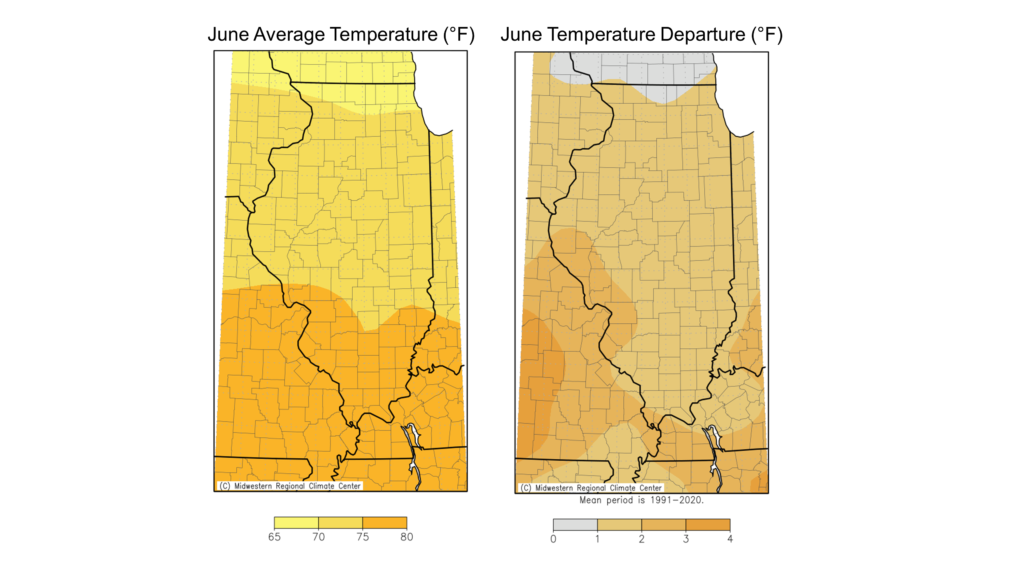
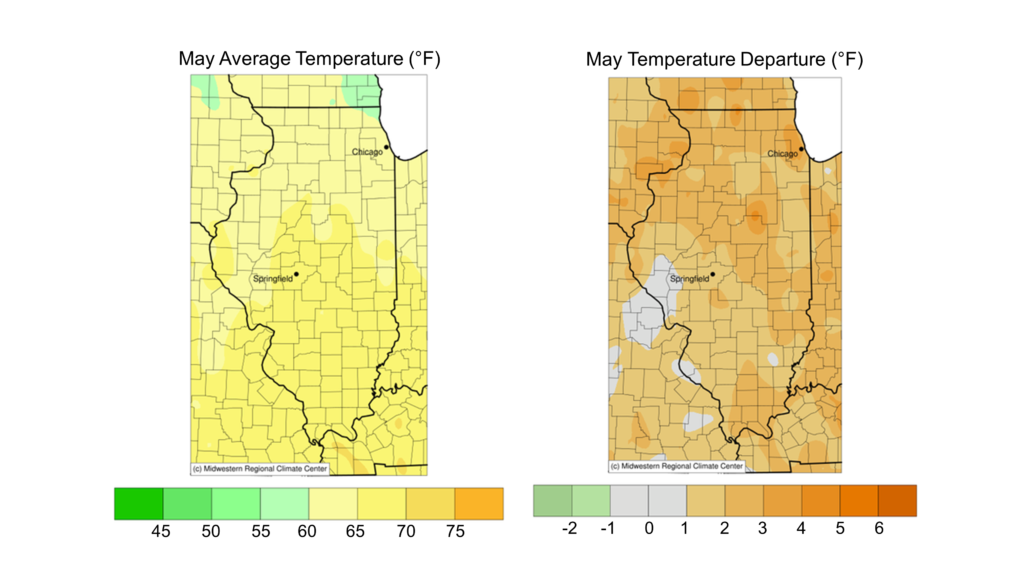
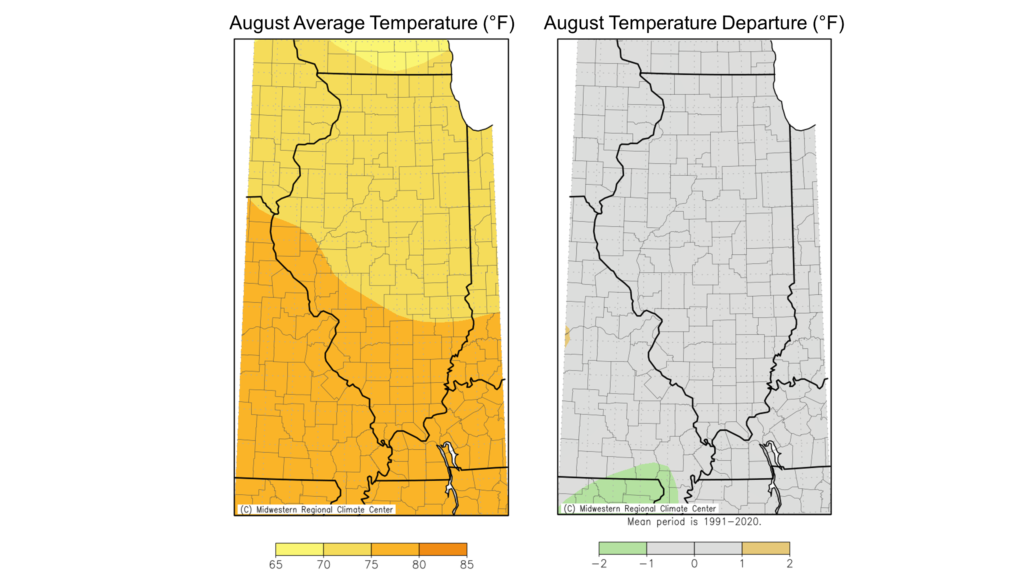
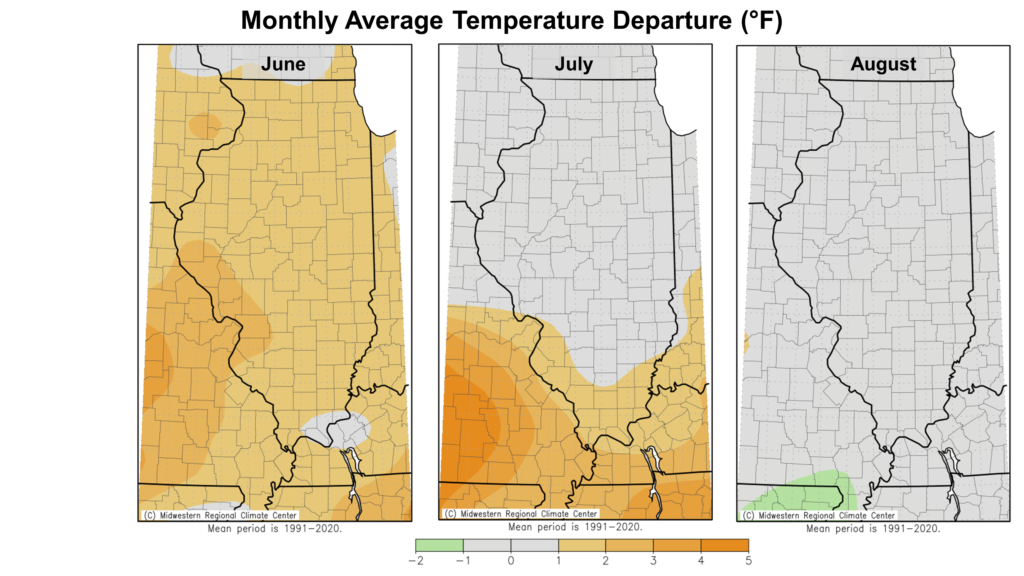
August average temperatures ranged from the low 70s in northern Illinois to the high 70s in southern Illinois, within 1 degree of normal statewide (Figure 2). The warmest place in the state last month was Bean Ridge in Alexander County with an average August temperature of 78.1 degrees. The coolest place in the state–other than my house–was Shabbona in DeKalb County with an average August temperature of 69.1 degrees.

Figure 2. Maps of (left) August average temperature and (right) August average temperature departures from normal.

Daily high maximum temperature records were broken last month at 2 stations, and daily high minimum temperature records were broken at 16 stations. Among the nighttime temperature records was a 78-degree low temperature in Peoria on August 7, which beat the previous daily record set in 1968 by 3 degrees. Daily low maximum temperature records were broken last month at 3 stations, but no daily low minimum temperature records were broken.

Overall, the preliminary statewide average August temperature was 73.8 degrees, 0.2 degrees above the 1991–2020 average and the 58th warmest on record going back to 1895.

Slightly Warmer Summer

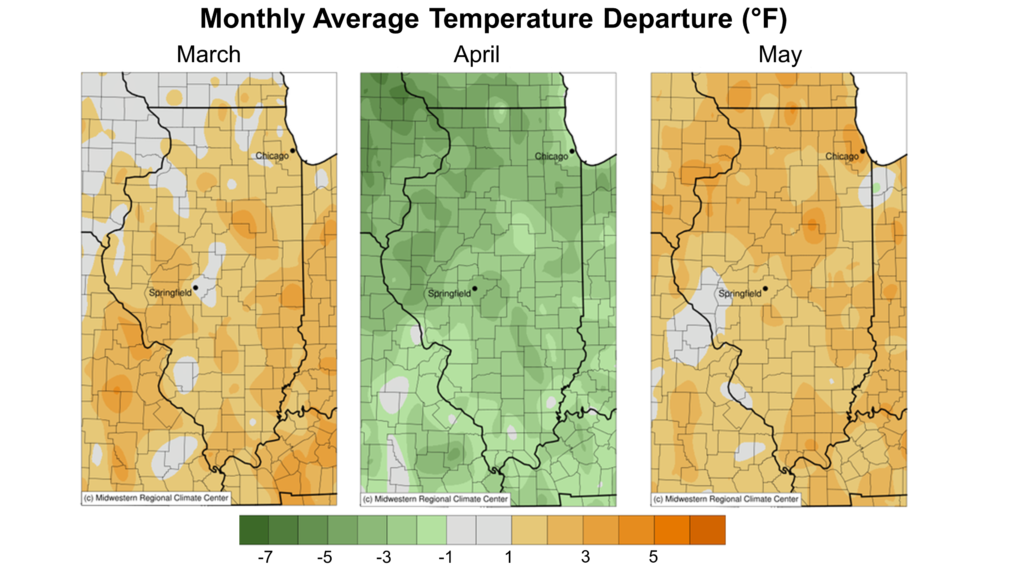
June was 1 to 3 degrees warmer than normal, followed by a July and August with near normal temperatures (Figure 3). The result was a preliminary statewide climatological summer average temperature of 74.4 degrees, only 0.6 degrees above normal. If that number is made official by the National Centers for Environmental Information (NCEI), this summer will be tied with 2006 as the 39th warmest on record statewide and 0.2 degrees cooler than in 2020 and 0.3 degrees cooler than in 2021.

Figure 3. Maps show average temperature departures for June, July, and August.

 Mixed Bag of August Rainfall

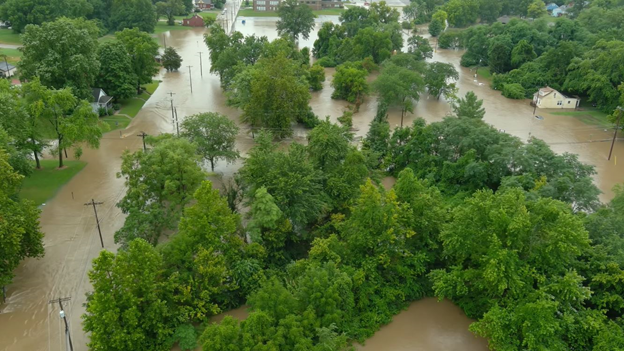
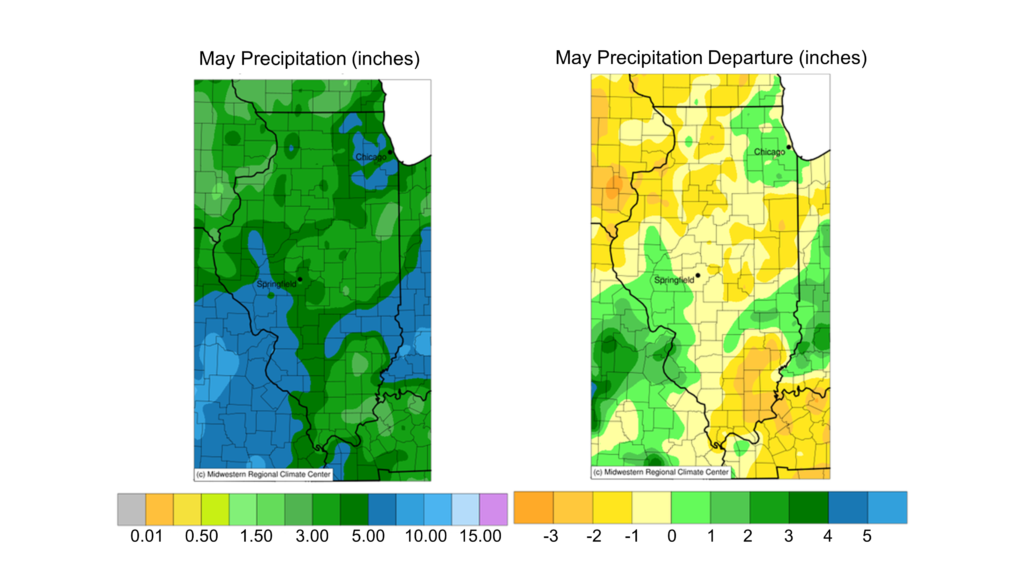
As is typical for late summer, your August rainfall summary greatly depends on where you are in the state. On one end of the spectrum, heavy rainfall early in the month brought 2–3 times the normal August rainfall to the Effingham-Olney and Freeport areas. In the latter event, between 5 and 11 inches of rain fell in eastern Jo Daviess and Stephenson Counties in less than 48 hours, inundating roads, flooding homes, and causing flooding along the Pecatonica River. The Quad Cities National Weather Service office has a detailed summary of the event and the damage it caused: https://www.weather.gov/dvn/summary_080822.

Just days earlier, a swath of east-southeast Illinois between Effingham and Olney saw 7 to 10 inches of rain in just 24 hours. This intense rainfall followed the second wettest July on record in Olney, so soils were already at or near saturation. Many fields from Effingham to Wayne County were flooded by both runoff and flooding from the Little Wabash and Embarras Rivers. Meanwhile, a large part of western Illinois was very dry in August, with some parts of Cass, Schulyer, Brown, Adams, and Hancock Counties picking up only 0.5 inches of total rainfall for the month, less than 20 percent of normal.

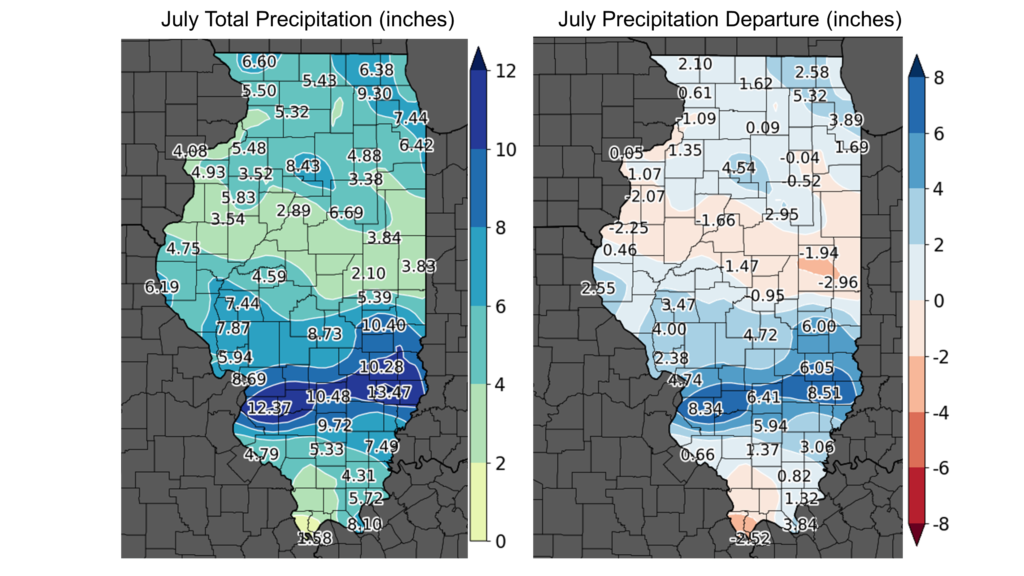
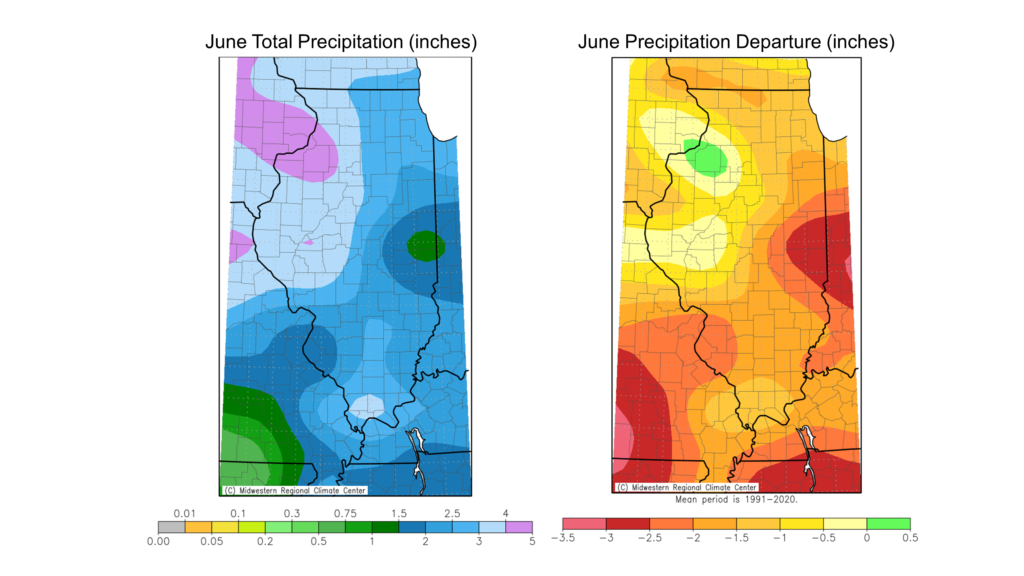
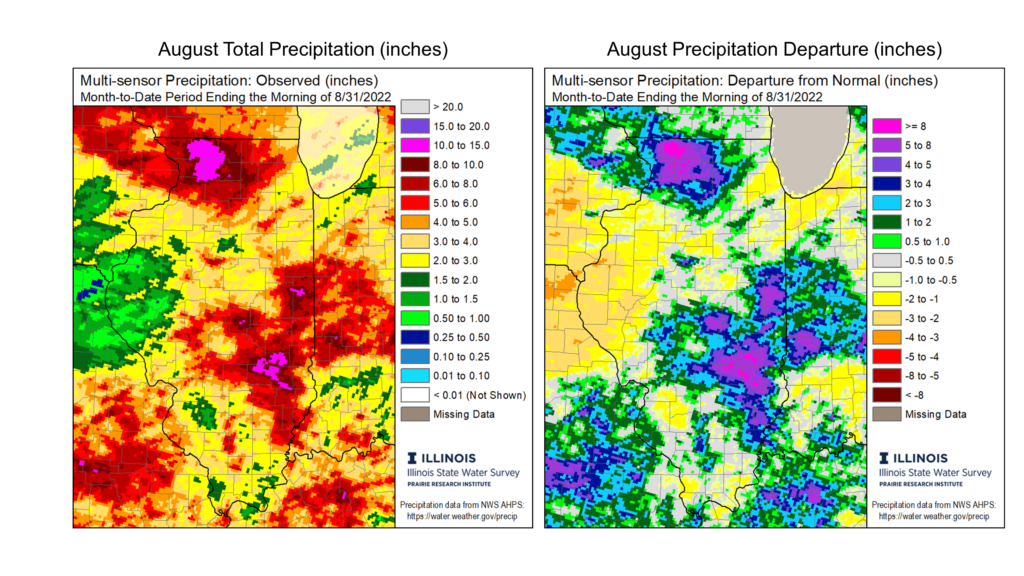
The results of these precipitation extremes are shown in the maps of August precipitation in Figure 4. Total precipitation last month ranged from nearly 15 inches in parts of northwest and southeast Illinois to less than 1 inch in western Illinois. The wettest point in the state in August was Freeport, with 14.55 inches. In contrast, the driest point in the state last month was the Quincy Dam in Adams County, with only 0.41 inches of total rain. Overall, the preliminary statewide average total August precipitation was 4.10 inches, 0.45 inches above the 1991–2020 average and the 41st wettest on record statewide.   

Figure 4. Maps show (left) total August precipitation and (right) August precipitation departure from normal.

Conservation of Drought

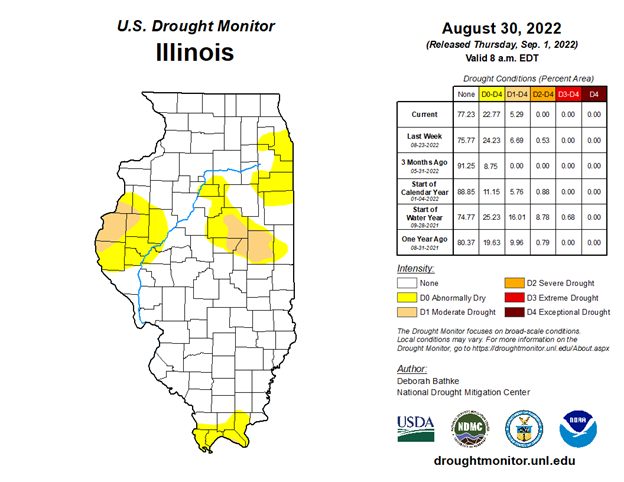
August abided by the law of conservation of drought, the law that tells us that drought is not created or destroyed, just moved around. Multiple rounds of rainfall in late August brought much-needed drought relief to east-central Illinois, where June and July rainfall deficits had exceeded 7 inches. The latest U.S. Drought Monitor reflects this improvement, with moderate drought occurring in just the Interstate 74 corridor from Champaign to McLean counties. However, the drought removed in eastern Illinois migrated to western Illinois following an exceptionally dry month in some places. Moderate drought spans from Henderson to Adams counties in western Illinois, reflecting this recent dryness (Figure 5).

Figure 5. U.S. Drought Monitor map from August 30.

Summer Rainfall

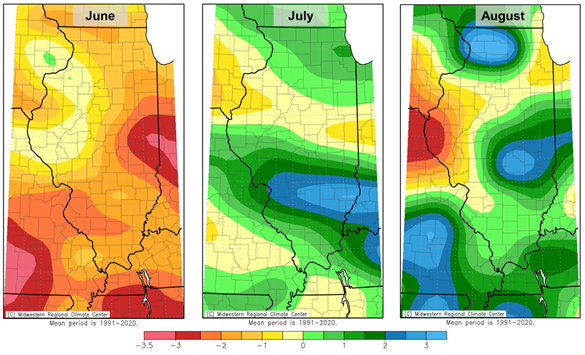
June was drier than normal virtually everywhere in the state and exceptionally dry in east-central Illinois. Heavy rain in southern Illinois and northeast Illinois in July kept those areas wet, while most of central Illinois remained on the dry side. August alleviated dry conditions in eastern Illinois and brought exceptionally wet conditions to northwest Illinois and exceptionally dry conditions to western Illinois (Figure 6). So, that left most of northern and southern Illinois with a total summer rainfall that was near normal to 2–4 inches wetter than normal. Meanwhile, a large part of central Illinois, from Quincy to Danville, was 1 to 5 inches drier than normal this summer.

Figure 6. Maps show total precipitation departures for June, July, and August.

Overall, the preliminary statewide total average summer precipitation was 12.23 inches, 0.68 inches above normal. If this number is made official, this summer will be the 45th wettest on record, 1.10 inches wetter than in summer 2020 and 1.7 inches drier than in summer 2021.

Looking Forward to September and Fall

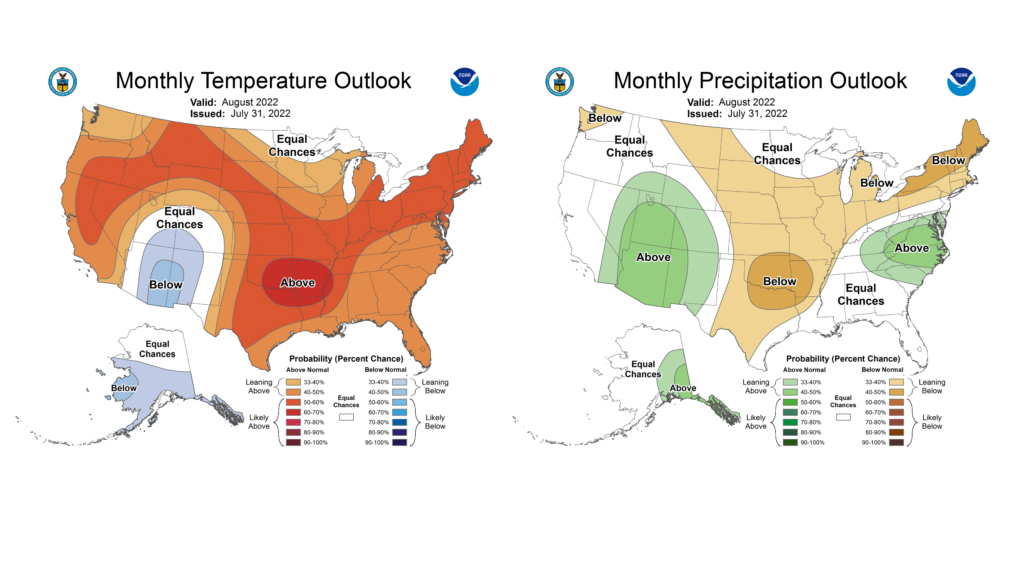
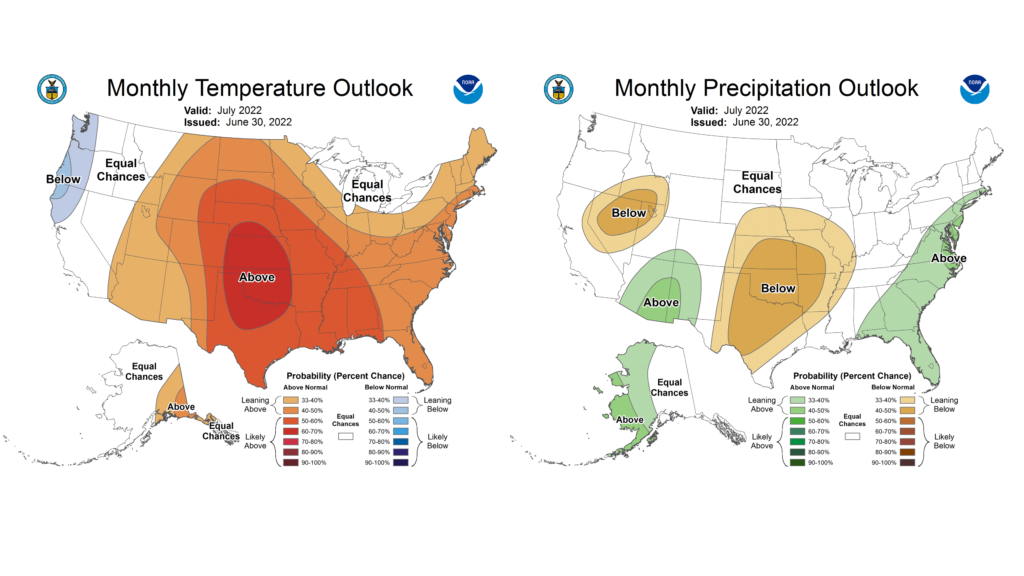
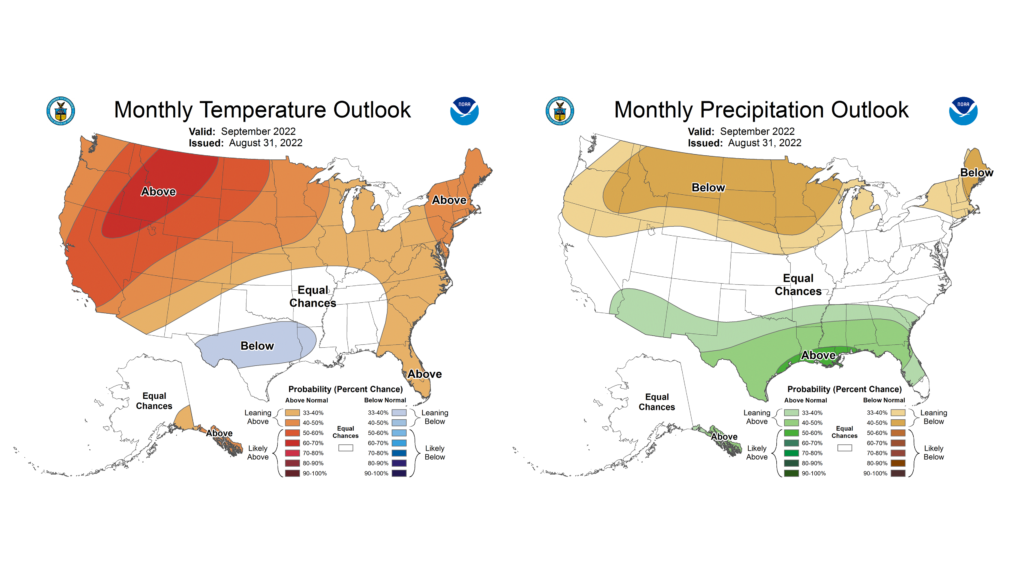
September is the start to climatological fall and when we really begin to see a temperature drop-off in the state. However, the most recent September outlooks from the Climate Prediction Center lean toward warmer than normal conditions for the month in Illinois. September precipitation outlooks are less confident, with equal chances of above and below normal precipitation (Figure 7).

Figure 7. Maps show (left) temperature and (right) precipitation outlooks for September.

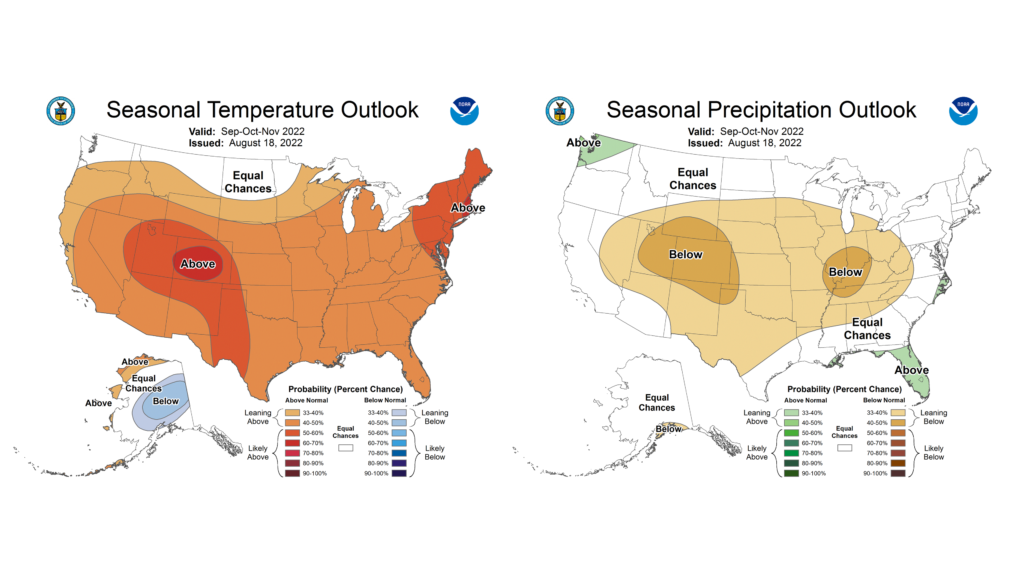
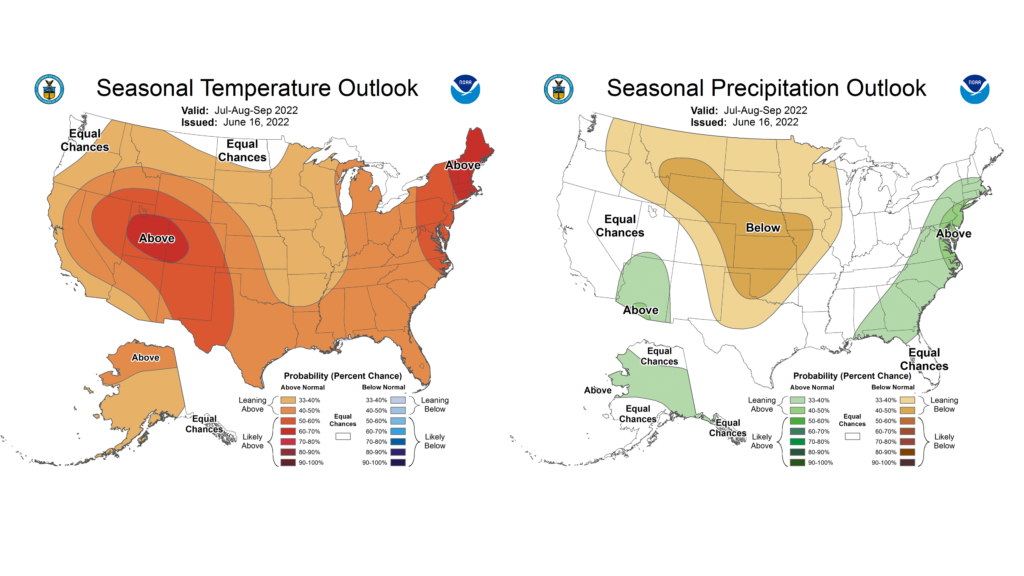
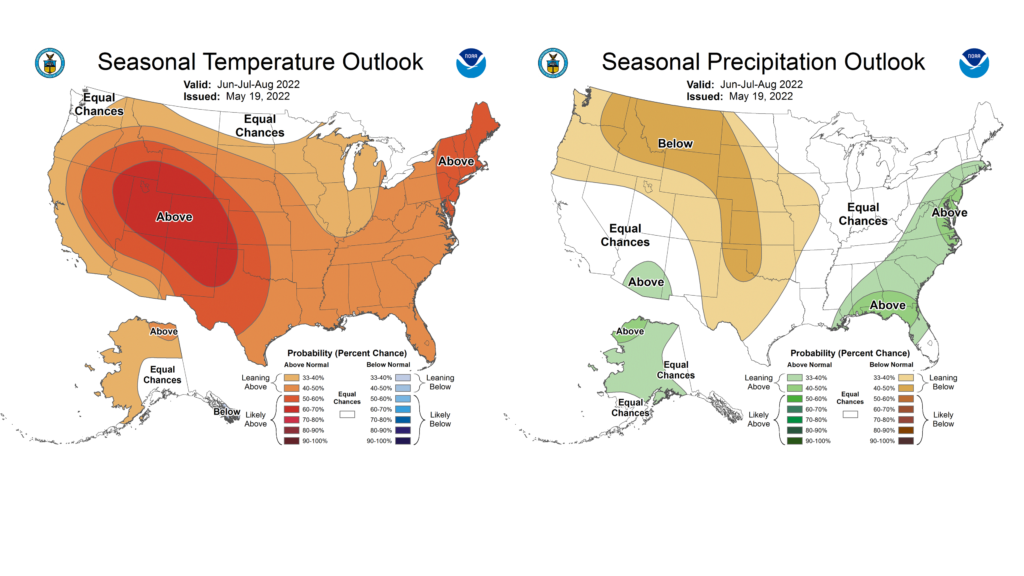
Meanwhile, outlooks for the entire climatological fall, September to November, continue to lean toward warmer than normal conditions across most of the contiguous U.S. La Niña conditions are favored to return this season, and Climate Prediction Center outlooks for fall lean to the drier than normal tendency we have during La Niña fall seasons (Figure 8).

Figure 8. Climate Prediction Center (left) temperature and (right) precipitation outlooks for fall (September–November).

July Brought Its Typical Calamity

The preliminary statewide average July temperature was 75.5 degrees, 0.1 degrees above the 1991–2020 average and tied for the 57th warmest on record going back to 1895. The preliminary statewide average total July precipitation was 5.69 inches, 1.63 inches above the 1991–2020 average and the 14th wettest on record statewide.    

Data are provisional and may change slightly over time.

You’re Hot, Then You’re Cold

For the second consecutive year, much of Illinois experienced a cooler or near normal July following a very warm June. However, if you were in eastern or southern Illinois, your July was on the warm side. This contrast is shown in daily July temperature departures from normal in Ottawa and Carbondale (Figure 1). Most July days (19 out of 31) in Ottawa were between 1 and 6 degrees cooler than normal, while Carbondale only had 11 out of its 31 July days with below normal temperatures. Most of the state experienced significant heat waves in the first and third weeks of the month, with temperatures in Carbondale 10–12 degrees above normal.

Figure 1. Daily July average temperature departures in (top) Ottawa and (bottom) Carbondale.

Humidity was a bit lower than in the past few years in northern Illinois, but most of southern Illinois experienced yet another very humid July. Paducah, Kentucky had 10 days last month with a nighttime low temperature exceeding 75 degrees, and two days with low temperatures exceeding 80 degrees, the latter of which was the second highest frequency on record there.

We did get breaks from the heat in July, and the second week of the month saw temperatures that were 3 to 8 degrees below normal. Overall, July average temperatures ranged from the low 70s in far northern Illinois to around 80 degrees in southern Illinois. July was 1 to 3 degrees cooler than normal for most of northern Illinois, and 1 to 3 degrees warmer than normal in southern Illinois (Figure 2). The hottest point in the state last month was Cairo with an average July temperature of 82 degrees, and the coolest part of the state was Aurora with an average July temperature of 71 degrees.


Figure 2. Maps of (left) July average temperature and (right) July average temperature departures from normal. Map source: Iowa Environmental Mesonet, https://mesonet.agron.iastate.edu/.

Altogether, 2 daily high maximum temperature records were broken last month, and 15 daily high minimum temperature records were broken. Meanwhile, 7 daily low maximum temperatures were broken last year, including a 69-degree high temperature in Aurora on July 16. One daily low minimum temperature record was broken last month, a 52- degree low in Joliet on July 9.

The preliminary statewide average July temperature was 75.5 degrees, 0.1 degrees above the 1991–2020 average and tied for the 57th warmest on record going back to 1895.

July Rainfall: Too Much & Not Enough

July marks the transition between the wetter months between April and June and the relatively drier months of August through October. Precipitation in July tends to be on a more local scale, which can create disparities in rainfall totals. This past month though, that disparity was on steroids.

Multiple, intense rainfall events ran from northwest to southeast along and north of the Interstate 80 corridor and along the Interstate 64 corridor last month. This included incredibly intense rain in the St. Louis metro area on July 26. Between 6 and 13 inches of rain fell in less than 10 hours, with the highest totals just northwest of St. Louis city. On our side of the river, parts of Cahokia Heights and Belleville caught 7–8 inches of rain in less than eight hours, causing widespread and–in some places–catastrophic flooding (Figure 3). Based on state estimates of rainfall intensity probabilities, these totals in the Belleville area exceeded the estimated 0.2 percent annual exceedance, roughly a 1-in-500-year event. However, while this type of event has a 0.2 percent chance of happening in any given year by state estimates, rainfall intensity is increasing across Illinois, which complicates estimates of the likelihood of these types of events. More information on this event can be found on the St. Louis National Weather Service site: https://www.weather.gov/lsx/July262022Flooding.

Figure 3. Photo of flooding in Belleville, Illinois. Source: St. Clair County Sheriff.

In the same week as the St. Louis rain and flooding event, parts of Lake and Cook Counties in northeast Illinois experienced their own heavy rain event, causing damaging flooding in Lake Bluff. The Chicago National Weather Service office reports that between 4 and 6 inches of rain fell in less than 6 hours, which corresponds with a 0.5 percent annual exceedance probability or a 1-in-200-year event.

Both events in St. Louis and northeast Illinois followed similarly intense rain and flooding last year in Gibson City, Bloomington, and Seneca; flooding in Peoria, Belleville, and Chicago in 2020; and many parts of the state in 2019.

In addition to flooding in the Metro East, parts of Clay, Richland, and Lawrence Counties had between 12 and 14 inches of rain in July, which is 7 to 9 inches above normal (Figure 4). Olney in Richland County measured 11.5 inches last month, making it the second wettest July on the 120+ year record there (only behind 1958). More broadly, most areas outside of the Interstate 74 corridor and far southern Illinois were between 1 and 8 inches wetter than normal in July. Parts of the northwest Chicago suburbs were also very wet in July. Elgin measured 9.3 inches last month, making it the second wettest July on their 35+ year record, only behind 2017.

While rain was inundating the northern and south-central parts of the state, much of central Illinois from Monmouth to Danville remained somewhat to very dry. This area and parts of Alexander and Pulaski Counties in far southern Illinois were 1 to 3 inches drier than normal last month. In response, the US Drought Monitor introduced and expanded the severe to moderate drought classifications in east-central and far southern Illinois. Since the beginning of summer, most of Champaign and Vermilion Counties have had less than 60 percent of normal rainfall, and some parts of eastern Champaign County are 6 to 7 inches below normal on summer-to-date rainfall. June and July total rainfall in Champaign-Urbana is 3.23 inches, the ninth lowest total on record and the lowest since 2012. Extreme flooding in the St. Louis Metro East was contrasted last month by dead lawns and severely stressed crops in east-central Illinois.

Figure 4. Maps show (left) total July precipitation and (right) July precipitation departure from normal. Map source: Iowa Environmental Mesonet, https://mesonet.agron.iastate.edu/.

The wettest point in the state in July was Olney in Richland County, with over 13 inches of rain. In contrast, Homer in Champaign County received just 1.28 inches in July. The preliminary statewide average total July precipitation was 5.69 inches, 1.63 inches above the 1991–2020 average and the 14th wettest on record statewide.   

August and Early Fall Outlooks

For this State Climatologist, a cooler end to summer and early start to fall would be much appreciated. But, as it seems, mother nature has other plans. The latest outlook from the Climate Prediction Center leans warmer than normal throughout the state for August. The August precipitation outlook also leans drier than normal, albeit with a bit less certainty (Figure 5). It’s also worth giving a reminder that Atlantic tropical storm activity often ramps up in August and September, but tropical activity is difficult to consider in monthly to seasonal outlooks.

Figure 5. Maps show (left) temperature and (right) precipitation outlooks for August.

Meanwhile, outlooks for September through November keep the warmer and drier than normal lean in Illinois (Figure 6). Staying dry in September and October particularly could be conducive to an early jump start to harvest, but a lot remains between then and now, so we’ll want to see how outlooks and conditions progress through August.

Figure 6. Climate Prediction Center (left) temperature and (right) precipitation outlooks for September through November.

Warm & Dry Start to Summer

The preliminary statewide average June temperature was 73.5 degrees, 1.6 degrees above the 1991–2020 average and the 30th warmest on record going back to 1895. The preliminary statewide average total June precipitation was 2.85 inches, 1.23 inches below the 1991–2020 average and the 25th driest on record statewide.    

Data are provisional and may change slightly over time.

Is Summer Over Yet?

Full disclosure: summer is by far my least favorite season in Illinois, so my apologies to the hot weather lovers out there. June ended warmer than normal across the state, but not extremely so. Daily temperature departures from normal in Mt. Vernon (Figure 1) show about half of the days last month were warmer than normal, and half were cooler than normal. We did experience a prolonged heat wave in the middle of June, with temperatures 15–20 degrees above normal. However, outside of this event, the hottest days were broken up by a handful of days with below normal temperatures.

Figure 1. Daily June average temperature departures in Mt. Vernon.

The week of June 13–18 was extremely warm across the state. High temperatures reached into the upper 90s on multiple days and even broke 100 degrees in a few stations. The 5-day average temperatures that week were 6 to 10 degrees above normal across the state. Combined with humidity, heat index values approached 120 degrees in parts of southern Illinois on June 13 and 14 (Figure 2).

Figure 2. Maximum heat index value on June 13 in southern Illinois. Source: National Weather Service Paducah office: https://www.weather.gov/pah/HeatWaveJune2022.

The high temperatures and humidity in mid-June made for some very warm nights. The all-time high nighttime temperature records for June were broken at 8 stations in Illinois that week, including a 78-degree low temperature in Peoria and an incredible 83-degree low at Chicago’s Midway Airport. The latter broke the previous June low temperature record at Midway by 4 degrees.

We did get breaks from the heat in June, although only temporarily. Overall, June average temperatures ranged from the high 60s in far northern Illinois to the high 70s in southern Illinois, between 1 and 3 degrees above normal (Figure 3). The hottest point in the state last month was Bean Ridge in Alexander County with an average June temperature of 78 degrees, and the coolest part of the state was Waukegan with an average June temperature of 67.7 degrees.

Figure 3. Maps of (left) June average temperature and (right) June average temperature departures from normal.

Altogether, daily high maximum temperature records were broken last month at 58 stations, and daily high minimum temperature records were broken at 97 stations. Eight stations broke their all-time June high nighttime temperature records.

Daily low minimum temperature records were broken at 4 stations, including a 46-degree low in Normal on June 19.

The preliminary statewide average June temperature was 73.5 degrees, 1.6 degrees above the 1991–2020 average and the 30th warmest on record going back to 1895.

A Very Dry June

June is typically one of the wettest calendar months across Illinois; however, last month was unusually dry. Total precipitation last month ranged from less than 1 inch in east-central Illinois to just over 5 inches in northwest Illinois. Only the Quad Cities area was wetter than normal last month, while other places in the state were between one-half inch and 3 inches drier than normal (Figure 4).

Figure 4. Maps show (left) total June precipitation and (right) June precipitation departure from normal.

While June was drier than normal for most in Illinois, it was extremely dry for folks in east-central and southern Illinois. Table 1 shows total June precipitation and historical rankings for several locations in the state.

Table 1. June precipitation totals from multiple Illinois stations along with the historical ranking.

The wettest point in the state in June was Jacksonville, with just under 8 inches of rain. In contrast, Sidell in Vermilion County received just 0.60 inches in June. The preliminary statewide average total June precipitation was 2.85 inches, 1.23 inches below the 1991–2020 average and the 25th driest on record statewide.   

July and Late Summer Outlooks

We would like to see July bring a bit cooler and wetter than normal weather to take the edge off the drought in parts of Illinois. The latest outlooks from the Climate Prediction Center show higher odds of warmer than normal weather in July, and slightly higher chances of drier than normal conditions for southern and central Illinois (Figure 5).

Figure 5. Maps show (left) temperature and (right) precipitation outlooks for July.

Meanwhile, outlooks for July through September continue to lean toward warmer than normal conditions across the entire central U.S. Summer precipitation outlooks are also leaning a bit toward drier than normal weather in western Illinois, with much stronger odds in the Plains (Figure 6).

Figure 6. Climate Prediction Center (left) temperature and (right) precipitation outlooks for July through September.

May Brought Spring and A Taste of Summer

The preliminary statewide average May temperature was 64.7 degrees, 1.4 degrees above the 1991–2020 average and the 29th warmest on record going back to 1895. The preliminary statewide average total May precipitation was 4.37 inches, 0.40 inches below the 1991–2020 average and the 76th driest on record statewide.    

Data are provisional and may change slightly over time.

Spring Arrives… As Does Summer

Following a cold and dreary April, folks in Illinois were begging for a taste of summer. While the first week of May delivered the same cooler weather as in April, temperatures quickly ramped up in the second week. As Figure 1 shows with daily temperature departures from Chicago, temperatures in the first seven days of May were 4 to 8 degrees below normal, but that was followed by six consecutive days with average temperatures at least 10 degrees above normal. Three of these days, May 10–12, were more than 20 degrees warmer than normal in Chicago.

Figure 1. Daily May average temperature departures in Chicago.

In fact, the week of May 9 to 15 was one of the warmest on record for May statewide, with temperatures persistently 8 to 20 degrees above normal (Figure 2). Rockford broke daily high daytime and daily high nighttime temperatures in four consecutive days that week, and both Rockford and Chicago recorded their earliest 70-degree nighttime low temperature on record. The heat was accompanied by summer-like humidity, and dewpoint temperatures regularly reached into the upper 60s and low 70s. Rockford reached its earliest 75-degree dewpoint temperature on record (back to 1959). Peoria recorded its earliest 73-degree nighttime low temperature on record (back to 1883), which beat the previous record by two weeks.  

The heat itself was remarkable, but so was how quickly it arrived following prolonged cooler weather in April and in the first week of May. A rapid change from cool to hot weather, especially early in the warm season, is associated with an elevated risk of heat-related health impacts. At least three heat-related deaths were reported in Chicago the week of May 9.

Figure 2. Average temperature departure from normal from May 9 and May 15.

Thankfully, temperatures moderated in the third and fourth weeks of May. However, the month still ended with temperatures above normal across the state. May average temperatures ranged from the low 60s in northern Illinois to the high 60s in southern Illinois, between 1 and 5 degrees above normal (Figure 3). The hottest point in the state was Cairo with an average May temperature of 69.4 degrees, and the coldest part of the state was Waukegan with an average May temperature of 58.9 degrees.

Figure 3. Maps of (left) May average temperature and (right) May average temperature departures from normal.

Altogether, daily high maximum temperature records were broken last month at 131 stations, and daily high minimum temperature records were broken at 125 stations. Three stations broke their all-time May high temperature records, including a 96-degree high on May 11 in Stockton in Jo Daviess County. Eight stations broke all-time May high nighttime temperature records, including a 74-degree low in Rockford on May 12.

Daily low maximum temperature records were broken last month at 17 stations, and daily low minimum temperature records were broken at 3 stations. 

Overall, the preliminary statewide average May temperature was 64.7 degrees, 1.4 degrees above the 1991–2020 average and the 29th warmest on record going back to 1895.

It All Averages Out

March was 1 to 3 degrees warmer than normal, followed by a cold April with temperatures 2 to 6 degrees below normal, with May temperatures 2 to 6 degrees above normal (Figure 4). The result was a preliminary statewide climatological spring average temperature of 51.9 degrees, only 0.5 degrees below normal.

Figure 4. Maps show average temperature departures for March, April, and May.

 May Flowers, Sans Flooding and Drought

In recent years, May brought precipitation extremes of both types. May 2020 was the wettest on record in Chicago, while intense drought plagued most of northern Illinois in May 2021. This year, though, conditions in May were closer to normal.

Total precipitation last month ranged from just under 2 inches in southeast Illinois to over 7 inches on the north side of the St. Louis Metro East (Figure 5). The southwest and northeast corners of the state were 1 to 3 inches wetter than normal in May, while the northwest, southeast, and much of central Illinois were 1 to 3 inches drier than normal. The lack of widespread, heavy rain helped move spring fieldwork along very quickly following serious delays in April. Meanwhile, most parts of the state received enough rain to keep soil moisture adequate to surplus to stave off drought.

Figure 5. Maps show (left) total May precipitation and (right) May precipitation departure from normal.

The wettest point in the state in May was Granite City in Madison County, with just under 8 inches of rain in total. In contrast, Fairfield in Wayne County received just 2.05 inches total in May. The preliminary statewide average total May precipitation was 4.37 inches, 0.40 inches below the 1991–2020 average and the 76th driest on record statewide.   

Climatological spring precipitation was within 2 inches of normal through most of Illinois. Areas along the Mississippi River between Pike County and Monroe County, along with much of the Chicagoland area, were 2 to 6 inches wetter than normal in the spring, while parts of southeast Illinois were 2 to 4 inches drier than normal. The lack of an extremely wet spring helped minimize flooding in southern Illinois this spring, which is a good outcome given the relatively high flooding risk in the region coming out of winter this year. Meanwhile, three consecutive wetter than normal months have knocked out drought in northern Illinois. Parts of McHenry and Lake counties moved from severe drought in the U.S. Drought Monitor on March 1 to abnormally dry conditions (i.e., no drought) at the end of May.

Overall, the preliminary statewide total spring precipitation was 12.45 inches, 0.51 inches above normal.

June & Summer

June is the start of climatological summer and is on average the second wettest and third warmest month of the year in Illinois. The latest outlooks from the Climate Prediction Center lean toward a colder than normal start to summer, with equal chances of above and below normal precipitation in June (Figure 6).

Figure 6. Maps show (left) temperature and (right) precipitation outlooks for June.

Meanwhile, outlooks for the entire climatological summer, June–August, continue to lean toward warmer than normal conditions across the entire central U.S. This suggests the cooler start to the season may not last into July and August, although we’ll want to see how the models progress through June. Summer precipitation outlooks are also showing an equal chance of wetter and drier than normal conditions in Illinois, while drier than normal weather is expected farther west in Iowa, Nebraska, and Kansas (Figure 7).

Figure 7. Climate Prediction Center (left) temperature and (right) precipitation outlooks for summer (June–August).