The preliminary statewide average March temperature was 45.8 degrees, 4.4 degrees above the 1991–2020 average and the 14th warmest on record going back to 1895. The preliminary statewide average total March precipitation was 3.09 inches, 0.15 inches above the 1991–2020 average and the 60th wettest on record statewide.
Data are provisional and may change slightly over time
Mild Start and Bumpy End to March
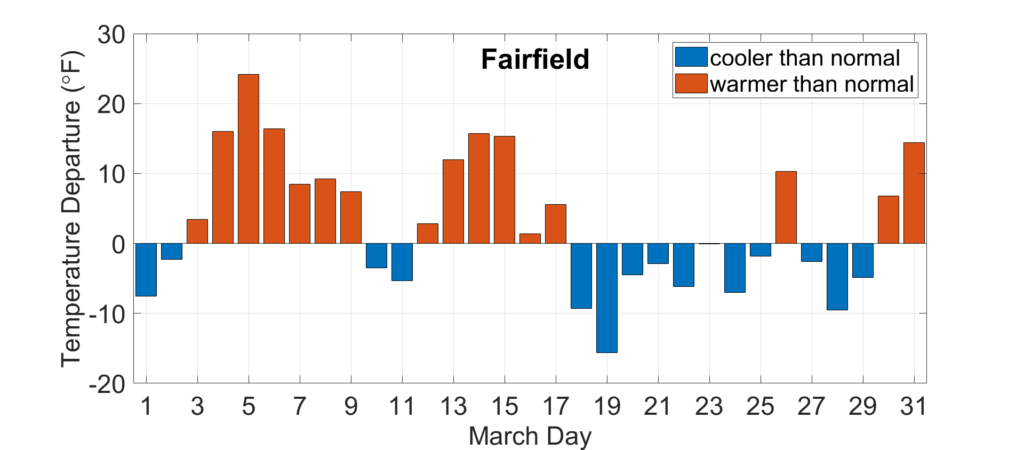
Mild temperatures from February carried over to the first half of March in Illinois. Most of the first 15 days of March were warmer than normal in the state, including in Fairfield (Figure 1). A strong storm system pulled in very warm and humid air from the Gulf of Mexico on March 5, sending high temperatures into the 70s and 80s across the state. However, the second half of the month had more days with below normal temperatures and multiple rounds of sub-freezing nighttime low temperatures.
Figure 1. Daily March average temperature departures in Fairfield.
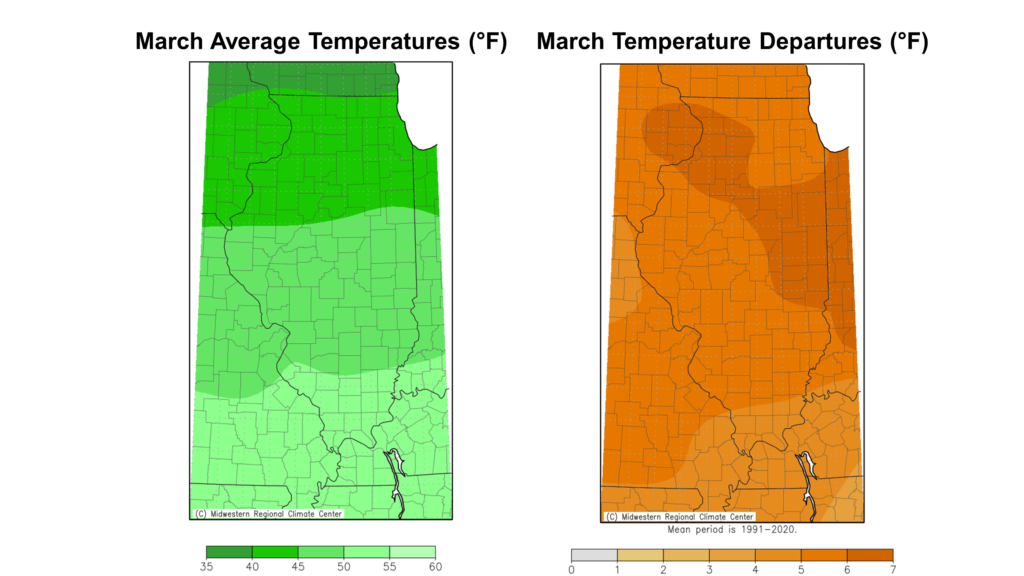
March average temperatures ranged from the low 40s in northern Illinois to the low 50s in southern Illinois, between 2 and 5 degrees above normal (Figure 2). The warmest place in the state last month was Du Quoin at 53.4 degrees on average, and the coldest place in the state last month was Stockton at 39.6 degrees. It was the 5th warmest March on record in Peoria, the 6th warmest in Freeport, and the 9th warmest in both Moline and Rockford.
The mild weather in the first half of the month broke 77 daily high maximum temperature records and 32 daily high minimum temperature records in Illinois. The colder weather that settled in the back half of March broke three daily low minimum temperature records, including 21 degrees in Kaskaskia.
Figure 2. Maps of (left) March average temperature and (right) March average temperature departures from normal.
Overall, the preliminary statewide average March temperature was 45.8 degrees, 4.4 degrees above the 1991–2020 average and the 14th warmest on record going back to 1895.
Mixed Wet and Dry Conditions in March
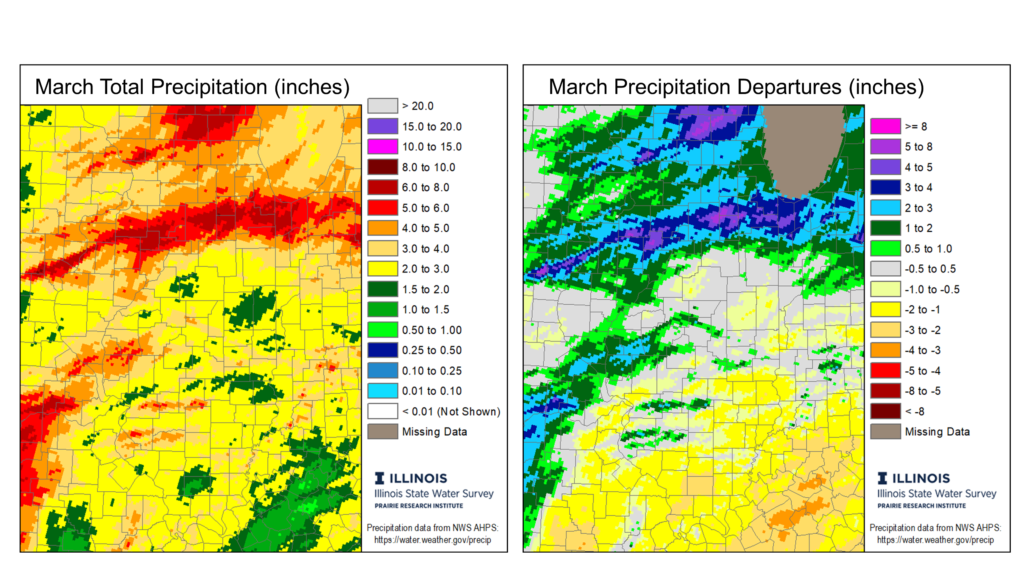
The first two months of the year included a top 15 wettest January on record and the 2nd driest February on record in Illinois. March gave us a little taste of both worlds, with wetter conditions in the north and drier conditions in the south. March total precipitation ranged from over 6 inches in north-central Illinois to less than 2 inches in southern Illinois. Most of the state north of Interstate 70 had a near-normal to wetter than normal March, while much of southern Illinois was 1 to 3 inches drier than normal (Figure 3).
Overall, the preliminary statewide average total March precipitation was 3.09 inches, 0.15 inches above the 1991–2020 average and the 60th wettest on record statewide.
Figure 3. March total precipitation (left) and March precipitation departure from normal (right).
Uh Oh, March Hail and Snow
Unfortunately, not all March precipitation was rain. While March wasn’t nearly as active for severe weather as last year, we did get quite a bit of hail across Illinois. The Storm Prediction Center’s preliminary count had 68 severe hail reports across Illinois last month, including eight reports of 2-inch (i.e., hen egg size) or larger diameter hail. If you feel like Illinois has had a lot of hail in the month of March recently, you’re not wrong. Each of the last two years have had more than 45 severe hail reports across the state, following a stretch of five years between 2018 and 2022 with only 37 severe hail reports total.
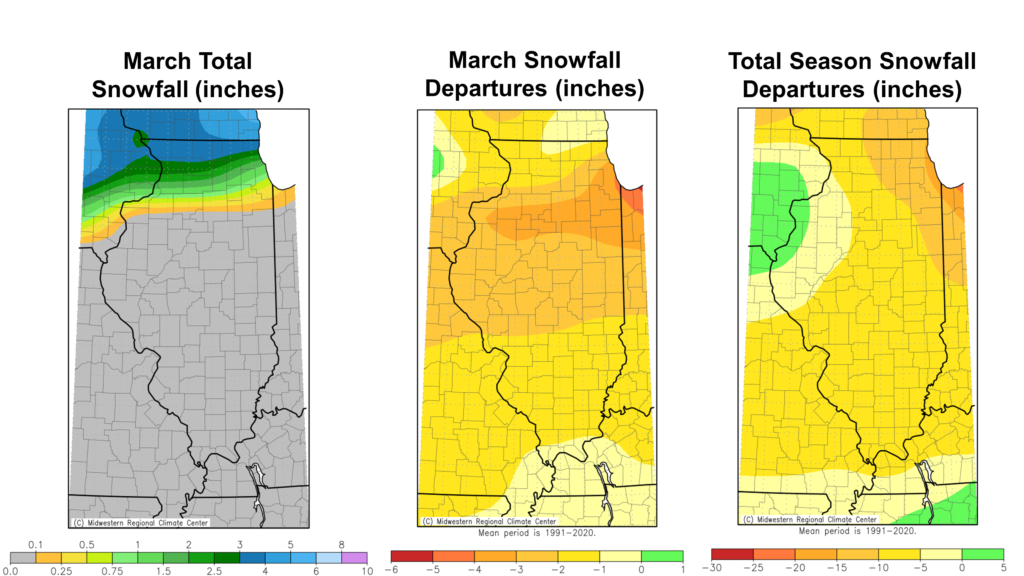
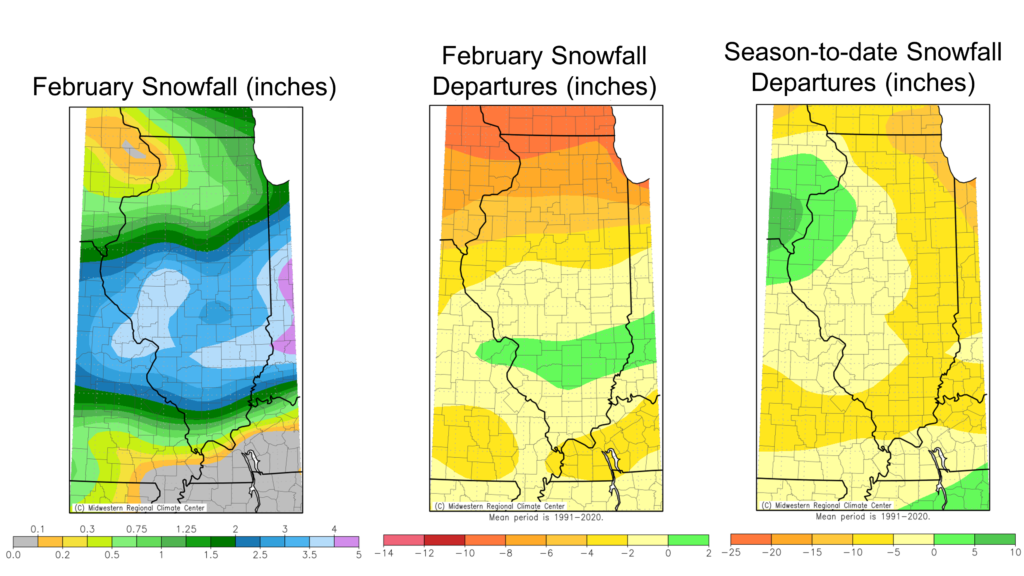
Meanwhile, as it often does, March brought some snowfall to northern Illinois. Most places north of Interstate 80 saw some accumulation in March, with some isolated 8- to 9-inch totals in Boone and McHenry Counties. Despite the impressive totals, March still ended with below normal snowfall for the entire state, adding to deficits from the rest of the snow season (Figure 4).
Figure 4. Maps show (left) total March snowfall, (middle) March snowfall departure from normal, and (right) season-to-date snowfall departures from normal.
April & Late Spring Outlooks
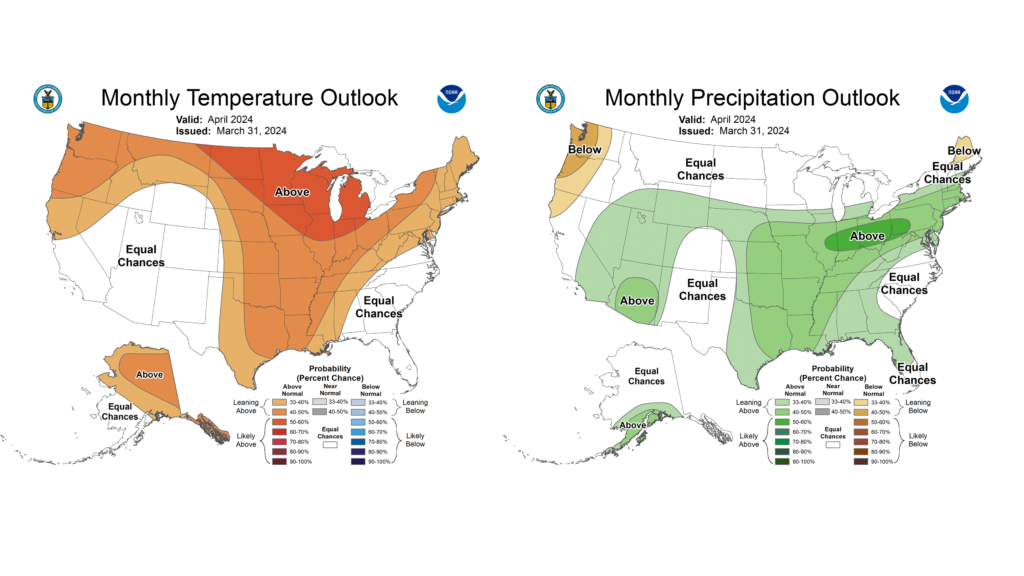
April is an important weather month in Illinois because it ushers in a typically wet three-month period that also brings the highest threat of severe weather. April is also when we see spring fieldwork and planting in earnest across the state. And this year, April is particularly interesting because of the solar eclipse on the 8th. I’ll refer to the National Weather Service for an official eclipse forecast, and instead present the outlooks for April and the three-month period between April and June.
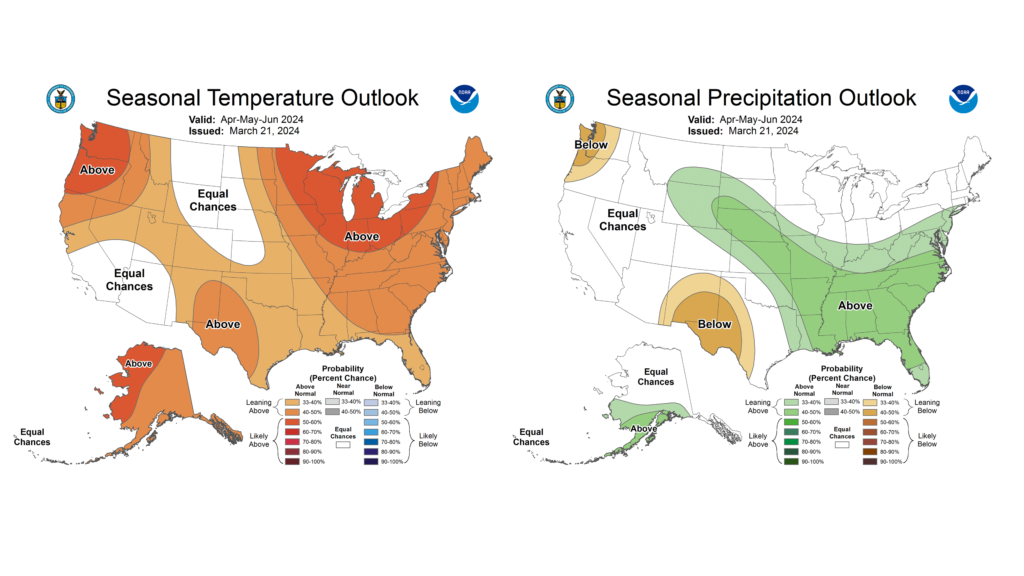
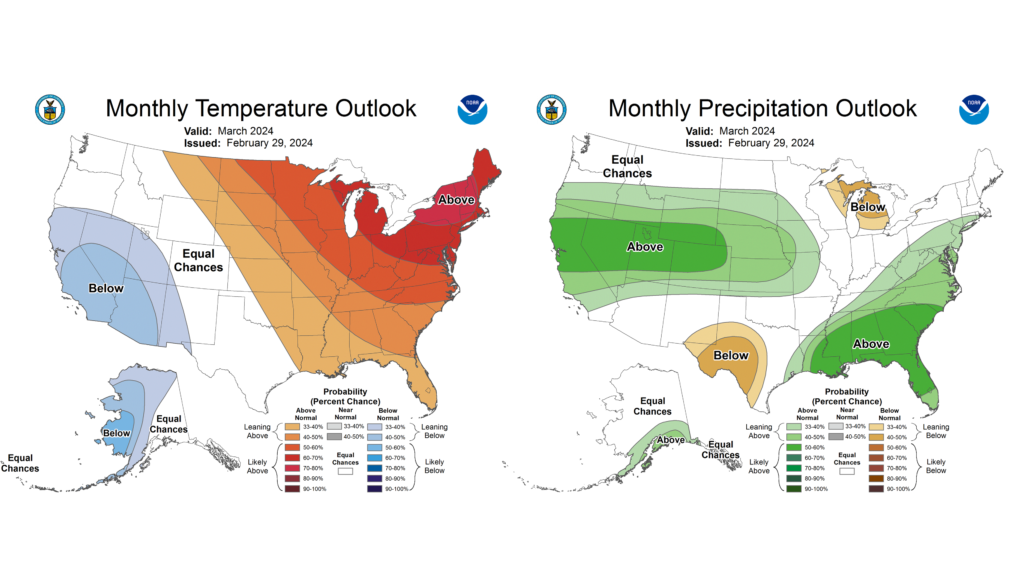
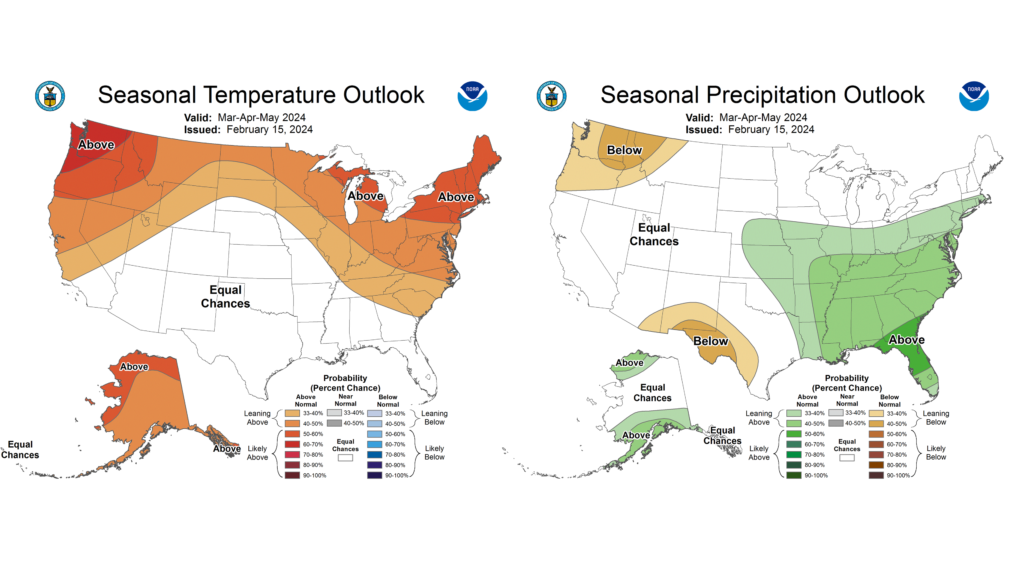
The final April outlook from the Climate Prediction Center has highest chances of warmer and wetter than normal conditions in this important month (Figure 5). The April-June period also leans warmer and wetter than normal in Illinois (Figure 6).
Figure 5. Climate Prediction Center (left) temperature and (right) precipitation outlooks for March.Figure 6. Climate Prediction Center (left) temperature and (right) precipitation outlooks for April through June.
The preliminary statewide average February temperature was 39.4 degrees, 8.3 degrees above the 1991–2020 average and the 3rd warmest on record going back to 1895. The preliminary statewide average total February precipitation was 0.53 inches, 1.58 inches below the 1991–2020 average and the 4th driest on record statewide.
Data are provisional and may change slightly over time
Extremely Mild February
Climatologically, February is the second coldest month statewide after January. February 2023 was very mild, about 4 degrees above normal. However, last month made February 2023 look like an Arctic blast.
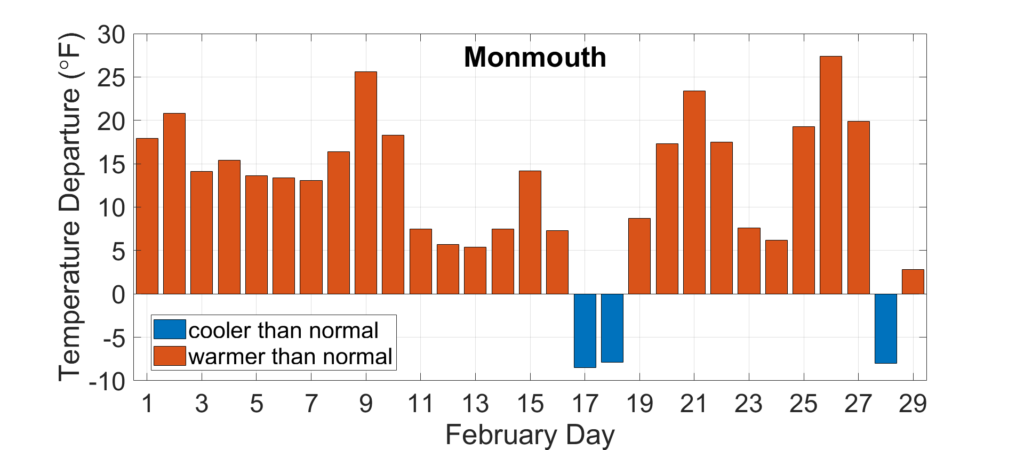
Figure 1 shows daily temperature departures from normal in Monmouth in February. Only three days in our 29-day month were colder than normal, while most days were 10 to 30 degrees warmer than normal.
Figure 1. Daily February average temperature departures in Monmouth.
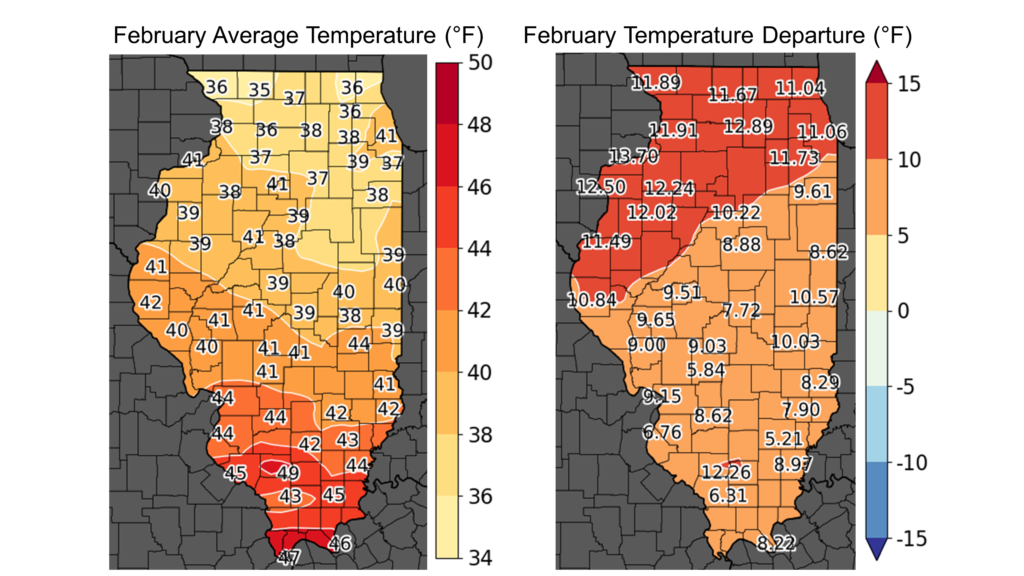
February average temperatures ranged from the mid-30s in northern Illinois to the high 40s in southern Illinois, between 6 and 12 degrees above normal (Figure 2). Several stations saw daily high temperatures in the 80s last month, including 83 degrees in Belleville and 80 in Springfield. A strong cold front in the last week of the month dropped temperatures from the 70s and 80s into the teens and 20s. Several places saw 50- to 60-degree declines in less than 24 hours. Overall, the warmest place in the state last month was Du Quoin, with an average temperature of 49.1 degrees, and the coldest place in the state was Stockton in Jo Daviess County with an average temperature of 34.8 degrees.
The mild weather in February broke 186 daily high maximum temperature records. These included a 75-degree high in DeKalb on February 28, which beat the previous daily high record by a full 12 degrees. There were also 43 daily high minimum temperature records broken last month. Twenty-two locations in Illinois set new all-time February high temperature records, including 77 degrees in Peoria, 77 in Charleston, 76 in Moline, and 73 in Rockford. Last month was the warmest February on record in Chicago, Rockford, Moline, and Peoria. It was a top 5 warmest February virtually everywhere in the state.
Figure 2. Maps of (left) February average temperature and (right) February average temperature departures from normal.
Overall, the preliminary statewide average February temperature was 39.4 degrees, 8.3 degrees above the 1991–2020 average and the 3rd warmest on record going back to 1895.
The Winter That Mostly Was Not
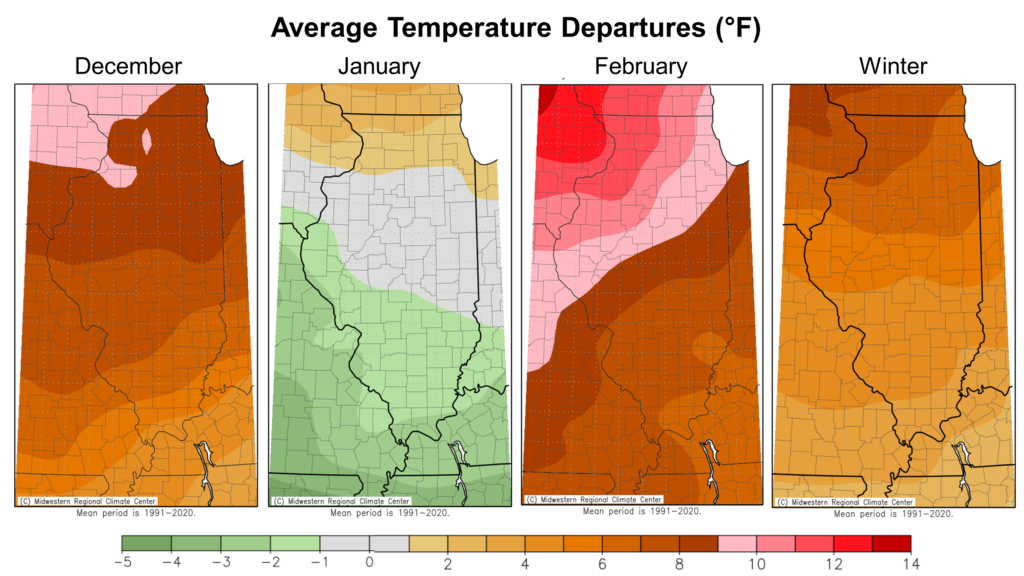
February ended yet another very mild climatological winter season that featured only one truly cold air outbreak. The season began with the 3rd warmest December on record statewide, followed by a mostly mild January split in two by extreme cold. An incredibly mild February put a cap on a winter with average temperatures that were 4 to 8 degrees above normal in Illinois (Figure 3).
Overall, the preliminary statewide average winter temperature was 34.8 degrees, 5.1 degrees above the 1991–2020 normal and, if confirmed, would be the 3rd warmest winter on record in Illinois.
Figure 3. Maps of (left) winter average temperature and (right) winter average temperature departures from normal.
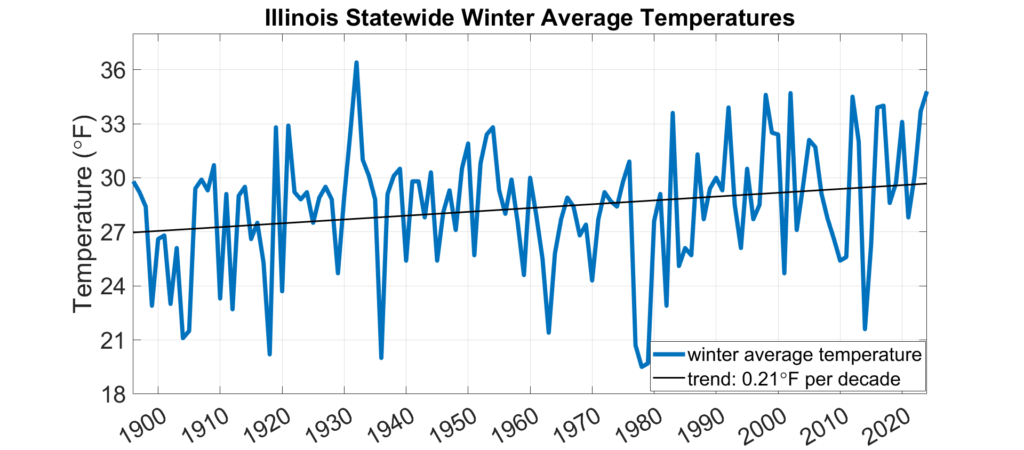
This is the part of the summary where I, once again, lament the long-term winter warming trend in Illinois. Winter is warming faster than any other season and is one of the most consistent impacts of human-caused climate change in the Midwest.
With respect to the long-term historical record, the 2022–2023 winter season was unusually warm. However, the season is part of a long-term warming trend that is larger in winter than in any other season across Illinois. Winter warming is one of the most consistent impacts of anthropogenic climate change in Illinois, driven by human greenhouse gas emissions. As Figure 4 shows, the statewide average winter temperature has increased by about 0.20 degrees per decade since 1895, and the average winter temperature over the past 30 seasons is about 2 degrees warmer than the 20th century average. One of the consequences of this long-term warming trend is a higher chance of warm winters that would be considered unusual based on the 20th century numbers. For example, six of the top 10 warmest winters on record in Illinois have occurred since 2001–2002.
Figure 4. Plot shows statewide average winter temperatures in Illinois (blue line) and the long-term trend in winter average temperatures (black line).
Very Dry February
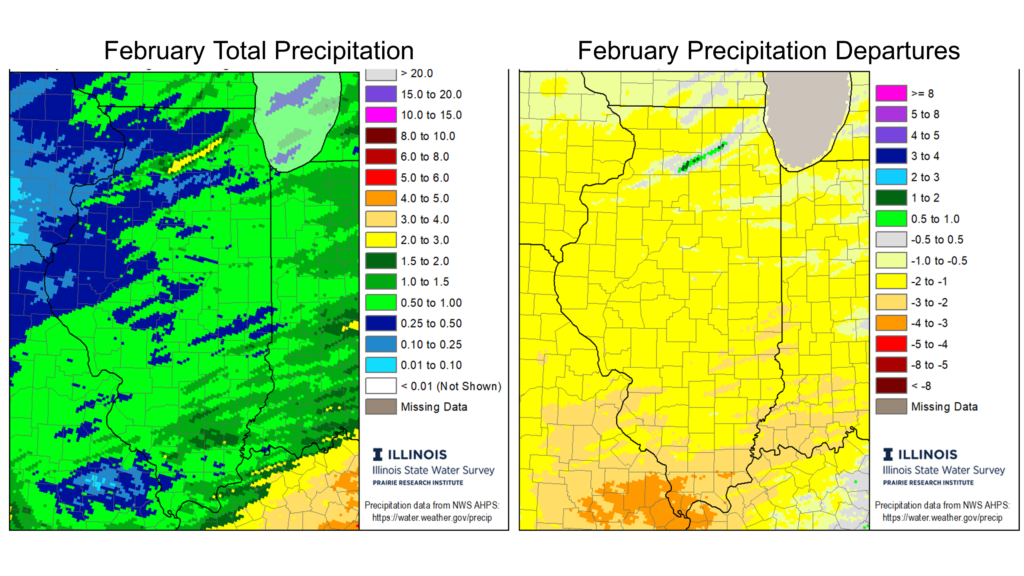
February is one of the climatological driest months of the year, and the last month fit that mold. Total February precipitation ranged less than half an inch in parts of western Illinois to around 3 inches in parts of northern Illinois (Figure 5). Most of the state was 1 to 3 inches drier than normal last month, while only a narrow stretch of northern Illinois caught more than normal precipitation.
Figure 5. February total precipitation (left) and February precipitation departure from normal (right).
Last month was the 7th driest on record in Rockford (0.29 inches total), the 8th driest in Moline (0.26 inches total), the 6th driest in Springfield (0.51 inches total), the 3rd driest in Normal (0.14 inches total), the 3rd driest in Quincy (0.07 inches), and 4th driest in Carbondale (0.74 inches). In fact, February tied for the 7th driest month on record (for any month) in Quincy, whose record stretches back to 1901. Overall, the preliminary statewide average total February precipitation was 0.53 inches, 1.58 inches below the 1991–2020 average and the 4th driest on record statewide.
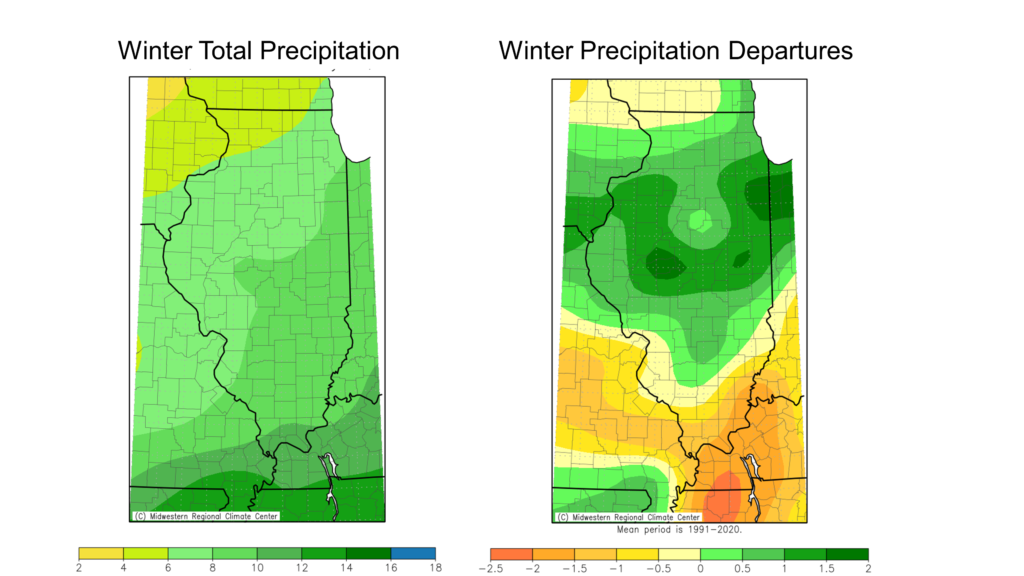
The very dry February in Illinois followed a very wet January and a mixed bag of wetter and drier than normal conditions in December. Overall, winter total precipitation ranged from less than 5 inches in northwest Illinois to over 10 inches in far southern Illinois. Most areas north of Interstate 64 were near to 1 to 2 inches wetter than normal last season, while far southern Illinois was 1 to 2 inches drier than normal in winter (Figure 6).
Figure 6. Maps show total precipitation departures from normal for (left) fall 2022 and (right) winter 2022–2023.
I Remember Snow…
I am contractually obligated to remind everyone that Illinois often – if not normally – gets some measurable snowfall in March and occasionally in April. So, the “snowfall season” is not yet complete; however, January and February almost always contain the most snowfall in the state. The first two months of 2024 underproduced in the snowfall category for virtually everyone outside of the Quad Cities and the northwest corner of the state.
February total snowfall ranged from less than two-tenths of an inch in northwest Illinois to just over 5 inches in central Illinois. Only the Interstate 70 corridor was above normal on February snowfall, while most of northern Illinois was 4 to 10 inches below normal (Figure 7). The big January snowstorm in the Quad Cities area keeps that region above normal on season-to-date snowfall, while most of the rest of the state is 5 to 15 inches behind normal snowfall by March 1.
Figure 7. Maps show (left) total February snowfall, (middle) February snowfall departure from normal, and (right) season-to-date snowfall departure from normal.
March & Spring Outlooks
March is the first month of climatological spring, and the first month we typically begin to see signs of spring. Of course, spring started weeks ago this year. The Climate Prediction Center temperature outlooks lean warmer than normal across the state. A warmer March will continue our sprint to an early spring, for good or for bad. Precipitation outlooks indicate equal chances of wetter and drier than normal conditions in March. As much as dry soils can help facilitate spring fieldwork, we could use a wetter March to help improve slowly worsening drought conditions, especially in southern Illinois.
Figure 8. Climate Prediction Center (left) temperature and (right) precipitation outlooks for March.
The spring season outlooks (March–May) also show slightly higher chances of above normal temperatures. Meanwhile, the higher chances of wetter spring conditions in the southeast US reaches up and grabs part of Illinois.
Figure 9. Climate Prediction Center (left) temperature and (right) precipitation outlooks for March through May.
The preliminary statewide average January temperature was 25.7 degrees, 1.0 degree above the 1991–2020 average and tied for the 57th coldest on record going back to 1895. The preliminary statewide average total January precipitation was 4.50 inches, 2.19 inches below the 1991–2020 average and tied for the eighth wettest on record statewide.
Data are provisional and may change slightly over time.
Big (but Fleeting) January Chill
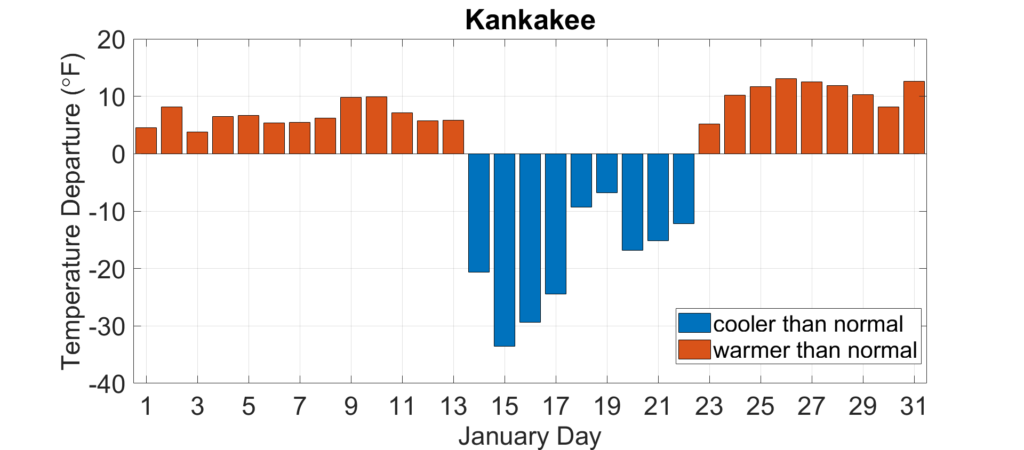
The very mild December weather spilled over into the new year as the first 10 to 12 days of January had temperatures near to slightly above normal. Extremely cold air moved into Illinois following a series of winter storms and brought frigid weather across the state for the middle part of the month. Daily temperature departures from normal in Figure 1 showed average temperatures were 10 to 30 degrees below normal in Kankakee between January 14 and 21. Some of the more impressive actual temperature values from that week included -25 degrees in Altona and -19 degrees in Moline. Strong northerly and northwesterly winds added to the cold and pushed wind chills into the -30- to -40-degree range. Water main breaks were reported across the state, and several school districts closed for multiple days because of the cold. Numerous deaths in the state were attributed to the cold as well. Temperatures moderated in the final week of the month, providing a well-deserved break from an Arctic winter.
Figure 1. Daily January average temperature departures in Kankakee.
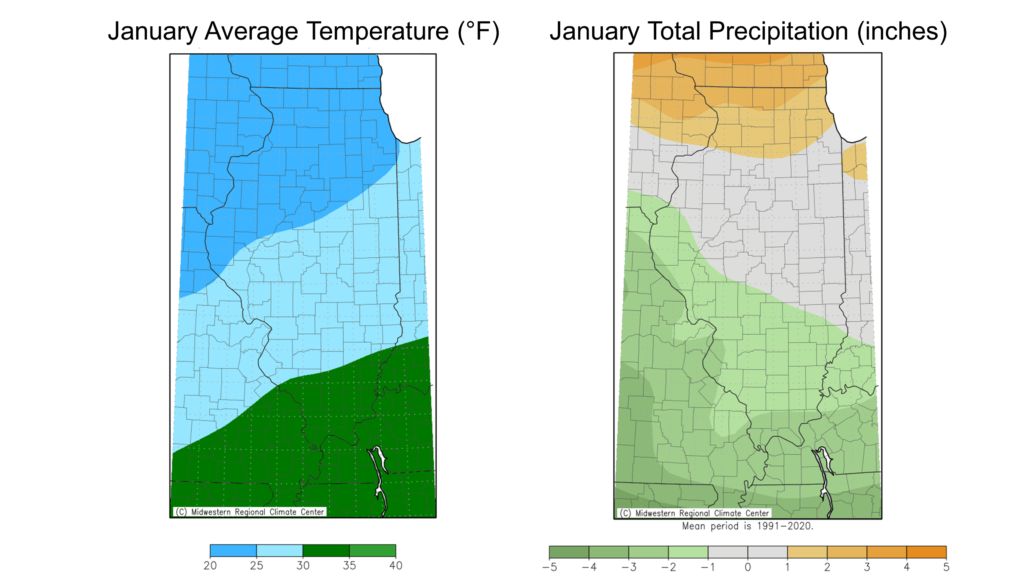
January temperatures ranged from the low 20s in northern Illinois to the mid-30s in southern Illinois (Figure 2). The southern half of the state was 1 to 3 degrees colder than normal last month, and, despite the extreme cold in mid-month, northern Illinois was 1 to 2 degrees warmer than normal in January. The coldest point in the state last month was Stockton in Jo Daviess County at 20.1 degrees, and the “warmest” point was Olmstead in Pulaski County at 32.7 degrees.
Figure 2. Maps of (left) January average temperature and (right) January average temperature departures from normal.
A Wet Start to 2024
Precipitation was hard to come by for much of Illinois in the last few months of 2023. Drought impacts are usually minimal in winter, but even so there were many reports of unusually dry soils and low streams and ponds at the start of the new year. While January did not completely replenish all water lost last year, it took a big bite out of drought.
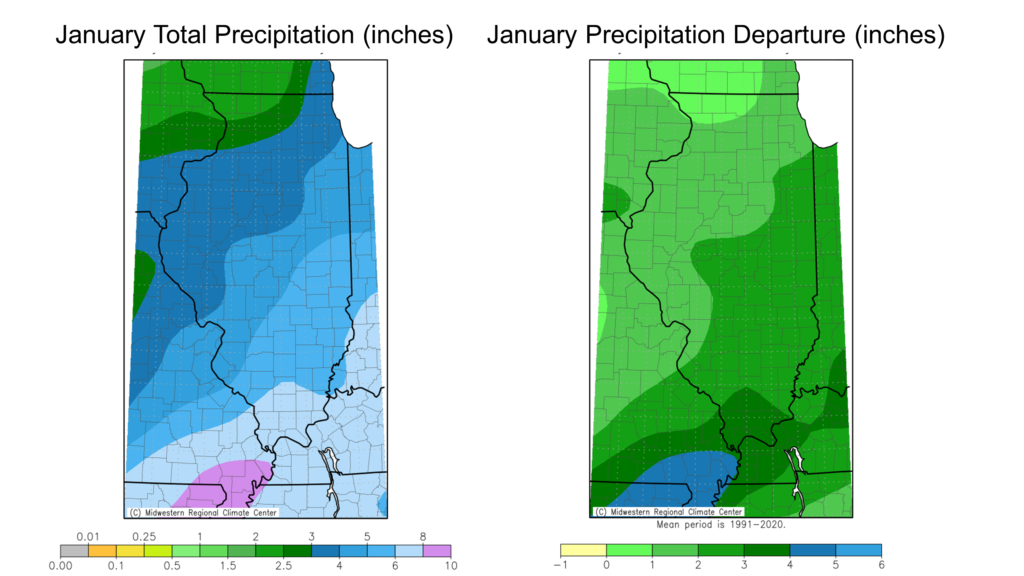
January total precipitation ranged from around 2.5 inches in northwest Illinois to nearly 10 inches in far southern Illinois (Figure 3). Everywhere in Illinois was wetter than normal in January, to the tune of 1 to 4 inches, between 150% and 300% of normal monthly precipitation. The precipitation totals were especially impressive around the Ohio River. Last month was the third wettest January on record in Paducah with 9.43 inches, and the wettest since 1969. It was also the eighth wettest January on record in Champaign and Centralia, both with over 5 inches total.
Figure 3. Maps show (left) January total precipitation and (right) precipitation departure from normal across Illinois.
Overall, the preliminary statewide average total January precipitation was 4.50 inches, 2.19 inches below the 1991–2020 average and tied for the eighth wettest on record statewide.
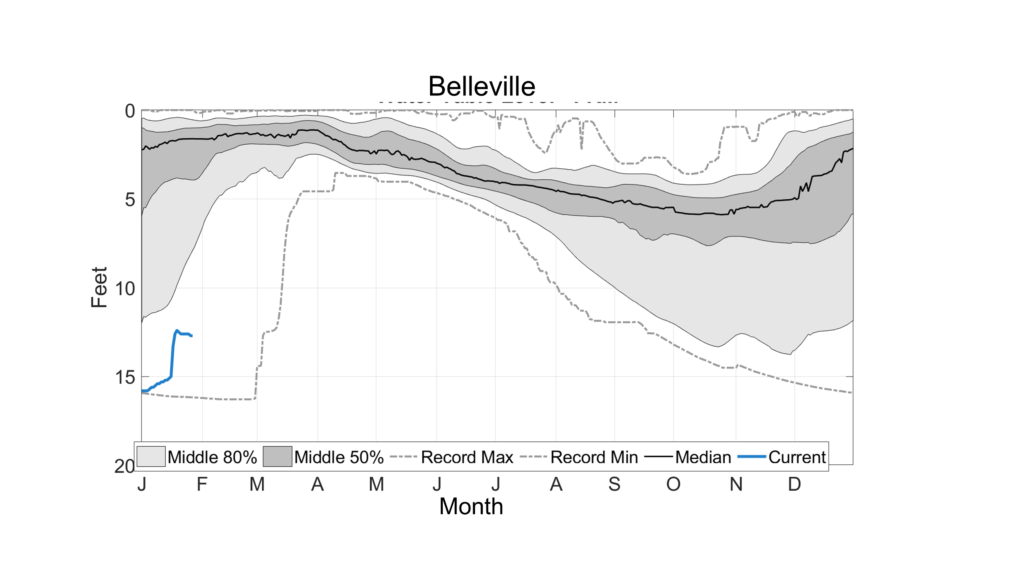
Persistent rain followed by wet, slowly melting snow was perfect for returning moisture to the ground and starting the climb out of drought. Figure 4 shows the water table depth below ground at the Water & Atmospheric Resources Monitoring (WARM) program in Belleville. The water table is the boundary between where the soil is saturated and unsaturated, and its depth is often affected by drought. The average water table depth for this time of the year in Belleville is around 3 feet, meaning that one usually only must dig down 3 feet or so to find completely saturated soil. However, Belleville came into this year with a severely depressed water table that was around 15 feet deep. The water table has begun to inch closer to the surface thanks to the precipitation in January, but as Figure 4 shows, there is much more recovery needed to get closer to average conditions.
Figure 4. The blue line shows the current water table depth (below ground) at the WARM site in Belleville. The black line is the long-term average, and the gray shading shows water table depths in most years.
Some Snow, At Least
Depending on where you are in our great state, January is either the first or second snowiest month of the year. And if you live north or west of the Illinois River, last month fit that bill quite well. For the rest of us, January just brought more cold rain. Total January snowfall ranged from less than half an inch in southern Illinois to over 25 inches in northwest Illinois; the latter area had 4 to 15 inches above normal snowfall (Figure 5).
Most of the snow in January came immediately ahead of or during the extreme cold in the middle of the month. Moline picked up more snowfall between January 8 and January 18 than in all of 2023, and last month was the second snowiest January on record in Moline, only less than 2019. January 12 was also the second snowiest day on record in Moline, with 15.4 inches; it was only less than on January 3, 1971.
The heavy snowfall in mid-January pushed the northwest corner of the state 1 to 6 inches above normal on season-to-date snowfall. Meanwhile, most of central and southern Illinois have had 2 to 8 inches below normal snowfall (Figure 5).
Figure 5. Maps show total snowfall and snowfall departure from normal for (left) January and (right) the snowfall season to date.
Outlooks
I’m not one to rely on rodents for my seasonal climate predictions. But as it turns out this year, Punxsutawney Phil and the Climate Prediction Center agree on a mild end to winter. The maps in Figure 6 show the more reliable Climate Prediction Center outlooks for (top) February and (bottom) climatological spring, March through May. Both show higher chances of above normal temperatures. February’s outlook leans a bit more into El Niño with a nod to a drier final month of winter. Meanwhile, the March–May outlook is less confident on precipitation, with equal chances of a wet and dry spring.
Figure 6. Maps show (left) temperature and (right) precipitation outlooks for the month of February and the spring season (March–May).
Illinois was both warmer and drier than the 1991–2020 normal in 2023. The statewide average annual temperature was 54.8 degrees, 2.2 degrees above normal and 5th warmest on record statewide. Statewide average total precipitation in 2023 was 34.41 inches, 6.34 inches below normal and the 29th driest year on record.
2023 Temperatures
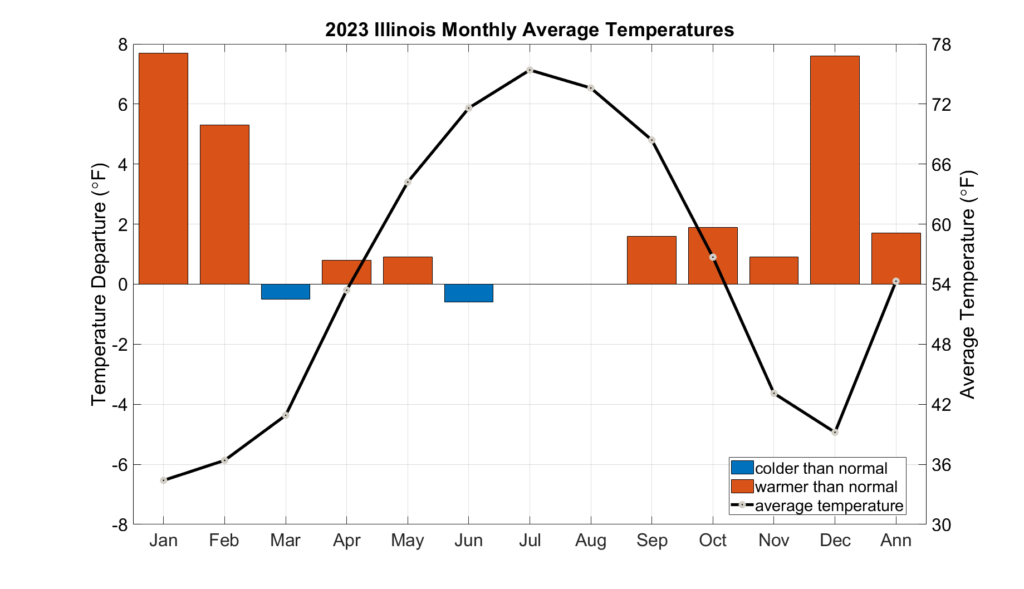
The past year was very warm in Illinois, but the largest temperature departures from normal were during the climatologically coldest months. January, February, and December 2023 were all at least 5 degrees warmer than normal, while June, July, and August were near to slightly cooler than normal (Figure 1).
Figure 1. Plot shows 2023 statewide monthly average temperature (black line) and temperature departures from the 1991–2020 normal (red and blue bars).
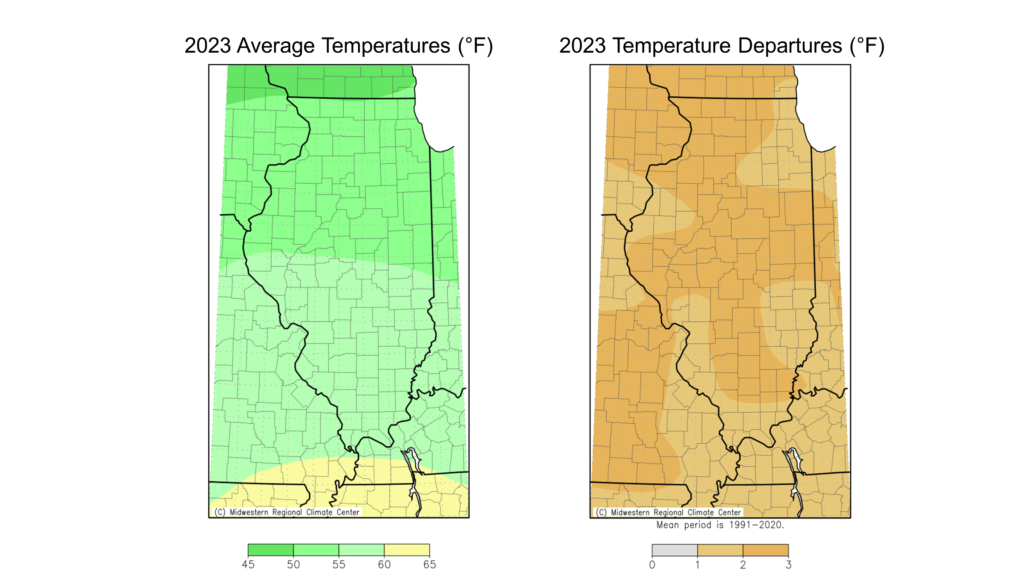
Figure 2 shows 2023 average temperatures and departures from normal across the state. Average temperatures ranged from the low 50s in northern Illinois to the high 50s in southern Illinois. The entire state was between 1 and 2 degrees above normal last year.
Figure 2. Maps show 2023 annual average temperature (left) and average temperature departures from the 1991–2020 normal (right).
The year 2023 was the 2nd warmest on record in St. Louis, 3rd warmest on record in Chicago and Moline, the 7th warmest in Champaign-Urbana, the 8th warmest on record in Carbondale, the 9th warmest in Rockford, the 12th warmest in Springfield, and the 14th warmest in Quincy. The warmest point in the state last year was Du Quoin with an average temperature of 60.3 degrees. The coolest point in the state was Stockton in Jo Daviess County with an average temperature of 49.3 degrees.
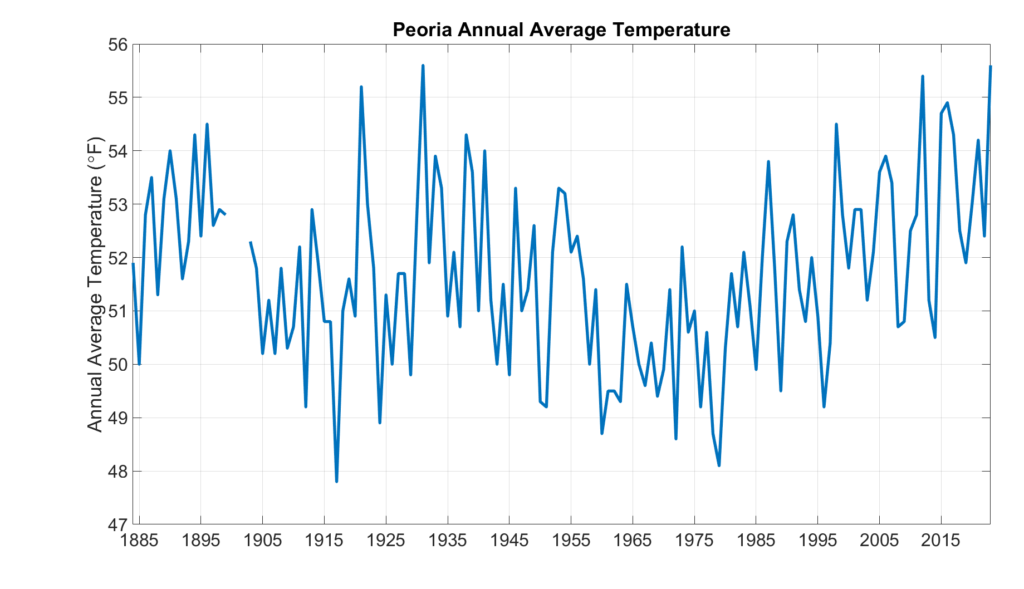
Last year also tied with 1931 for warmest on record in Peoria with an average temperature of 55.6 degrees. The year 1900 had a higher annual average temperature in Peoria but had almost a month’s worth of missing daily weather observations and is therefore not considered for annual records. Figure 3 shows the record of annual average temperature in Peoria going back to the 1880s. A long-term warming trend is also evident in Peoria’s temperature record.
Figure 3. Plot shows the annual average temperature in Peoria from 1884 to 2023.
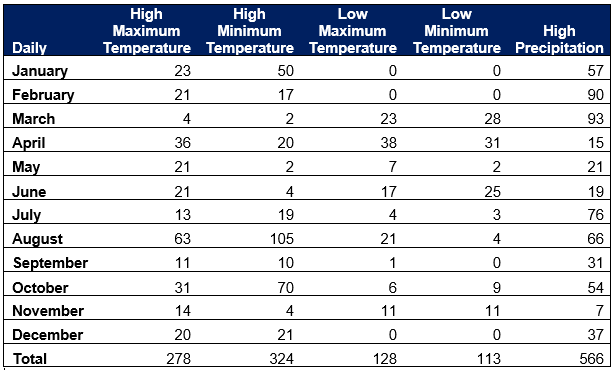
Table 1 shows the number of daily weather records broken at Illinois Cooperative Observer stations in each month of 2023.
Table 1. Table shows the number of daily local weather records in 2023 by month and variable.
August led with the highest number of daily high maximum and daily high minimum temperature records, with 63 and 105, respectively. Two stations in Illinois broke their August high maximum temperature records in 2023. McHenry set a new August high maximum temperature record with 97 degrees on August 24 and then broke it with 98 degrees on August 25. Nine stations also broke their August high minimum temperature records in 2023, including an 81-degree low in Du Quoin on August 22. Three stations set their all-time high minimum temperature records last year in August, including a 79-degree low in Peoria on August 25. The August records were set by an intense late-season heat wave across the state. Peoria set a new heat index record of 121 degrees, breaking its previous record from 1995.
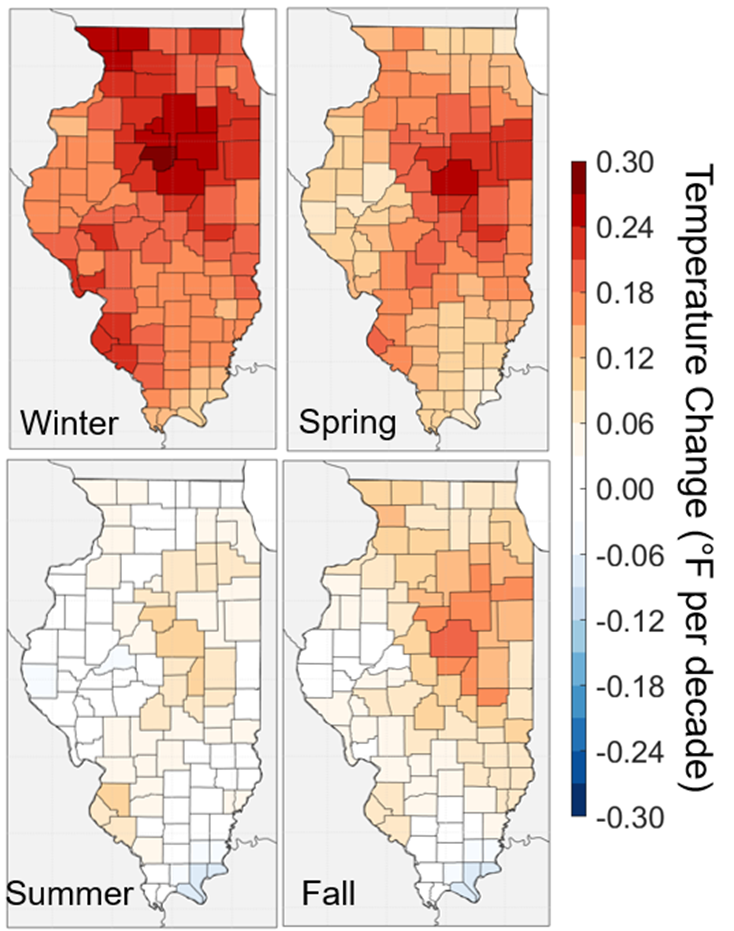
Also of note was the absence of extreme cold in the 2023 winter months. No stations broke daily low maximum or low minimum temperature records in January, February, or December. In fact, no station recorded a nighttime low temperature in the single digits in December for the first time on record in Illinois. The lowest temperature Champaign-Urbana hit all year in 2023 was 5 degrees, the second highest annual minimum temperature on record there and the lowest since 1921. While all four seasons in Illinois have warmed because of human-driven climate change, winter temperatures have increased at a much faster rate than in all other seasons (Figure 4). In winter, the most extreme low temperatures have increased at a faster rate than milder temperatures, making for less frequent and intense cold weather across the state in recent decades.
Figure 4. Maps show trends in daily average temperature in degrees Fahrenheit per decade by season and county in Illinois. Trends are calculated using observations between 1900 and 2020.
Milder temperatures in March and April also resulted in dozens of low maximum and low minimum temperature records broken across the state in 2023. However, two and a half times as many high maximum or high minimum temperature records (602) were broken last year in Illinois as low maximum or low minimum temperature records (241).
There were also 566 daily total temperature records broken across Illinois in 2023. Daily temperature records broken were somewhat equally spread among months, but February and March led with 90 and 93 degrees, respectively.
2023 Precipitation
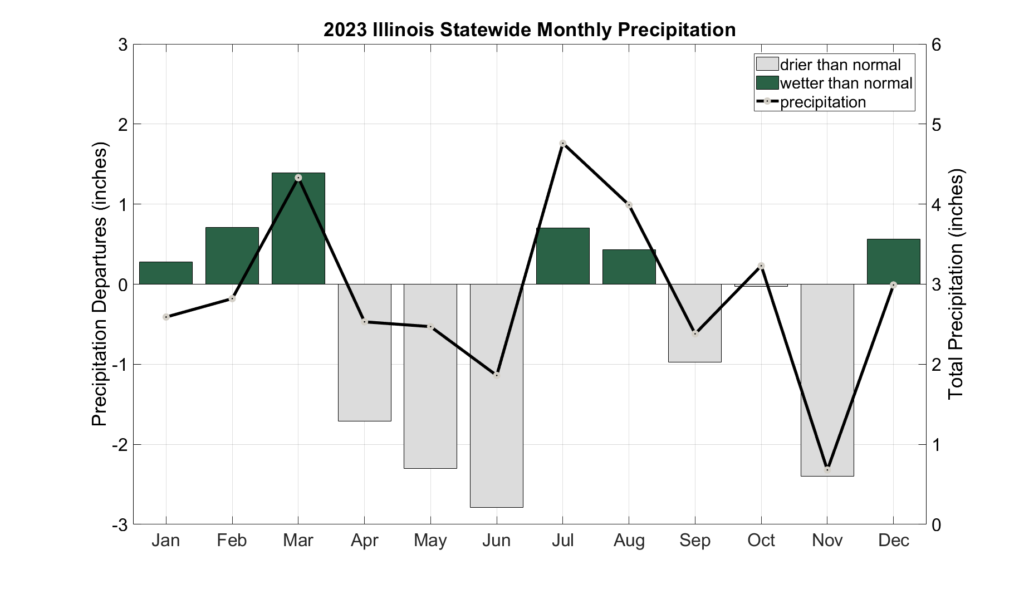
Calendar year 2023 began with wetter than normal months in January, February, and March (Figure 5). The combination of wetter spring conditions and a large snowpack that rapidly melted in the Upper Midwest led to brief flooding along the upper Mississippi River, including the fourth highest crest on record at Davenport.
Figure 5. 2023 monthly total precipitation as a departure from the 1991–2020 normal.
April, May, and June were all somewhat to very dry across the state. Dry weather and high evaporation in late April quickly dried out topsoil and–along with strong winds and farming activity–contributed to a severe dust storm on May 1 in south-central Illinois. The near zero visibility caused a 72-vehicle pileup on Interstate 55 that killed 7 and injured another 37 (https://www.weather.gov/ilx/01may2023-dust).
The state accumulated a nearly 6-inch precipitation deficit from April and June, which plunged most of Illinois into a significant drought. The June 27 U.S. Drought Monitor showed over 90 percent of the state in at least moderate drought and nearly 60 percent of the state in at least severe drought. Pasture conditions deteriorated rapidly in the early summer with little regrowth after the first hay cutting. Mature trees in central and northern Illinois showed significant stress and many municipalities reported substantial young tree mortality across the state.
July and August brought enough rain to limit agricultural and water resource impacts from the drought. Very heavy rain in Chicago in both July and August caused widespread flooding of hundreds of homes. Berwyn, Cicero, and Garfield Park all reported over 8 inches of rain in less than a day (https://www.weather.gov/lot/2023_07_02_Flooding).
For the second consecutive year, Illinois fell back into drought in the fall as the months of September, October, and November were all drier than normal statewide. After reaching its fourth highest crest at Davenport, the Mississippi River once again dipped below low stage in St. Louis and Memphis, forcing active dredging throughout the fall.
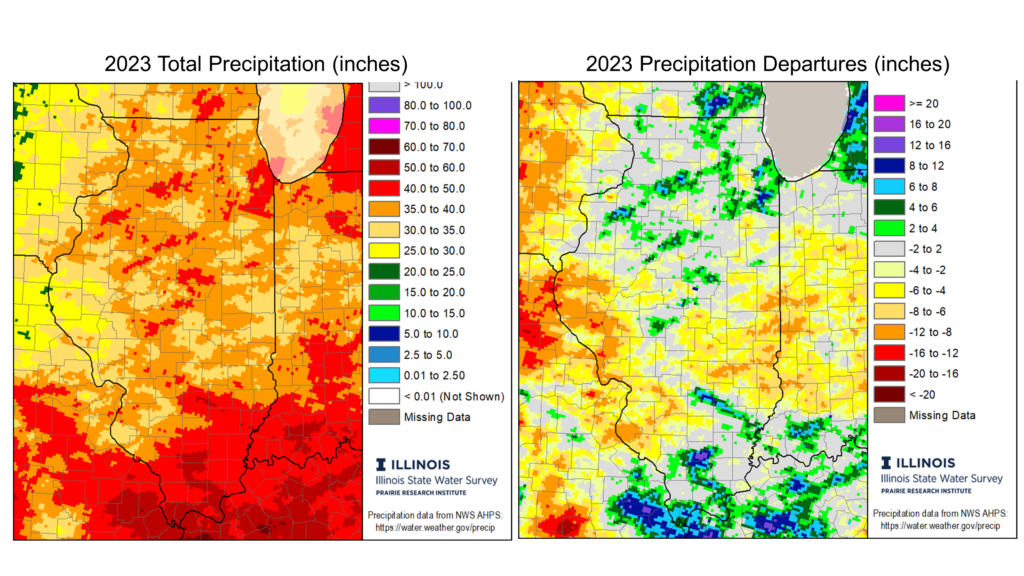
Overall, the preliminary statewide average total precipitation in 2023 was 34.63 inches, 6.12 inches below normal and the 30th driest year on record. Much like past years, the statewide preciptiation statistics are not representative of all places in Illinois. Calendar year 2023 had close to normal precipitation in parts of northern and southern Illinois, but was somewhat to much drier than normal in parts of central Illinois.
Figure 6 shows the spatial variability of 2023 precipitation in more detail. Total precipitation last year ranged from over 50 inches in far southern Illinois to less than 25 inches across parts of western Illinois.
Figure 6. Maps show (left) total precipitation and (right) precipitation departures in 2022.
A CoCoRaHS citizen science observer in Bush in Williamson County reported 57.23 inches of precipitation in 2023, making it the wettest point in the state. Meanwhile, the long-running station in Quincy recorded just 22.79 inches of precipitation in 2023, about 60 percent of normal. In fact, last year was the 4th driest on record in Quincy. The Gem City has only had 54 inches of precipitation since Jan. 1, 2022, making for the third driest two-year period on record there after 1953-54 and 1988-89.
2023 Severe Weather
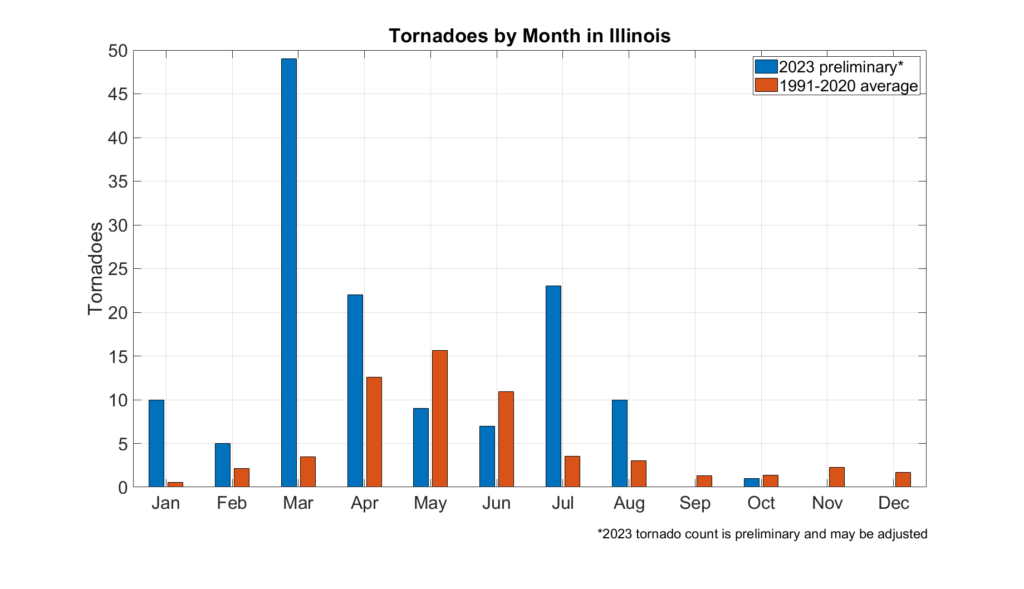
Severe weather came early and often in 2023, with all of our 102 counties affected by strong wind, hail, tornadoes, or heavy rain (Figure 7). Overall, the NOAA Storm Prediction Center reported a preliminary 135 tornadoes in Illinois in 2023, which–if confirmed–would set a new annual tornado record, breaking the 124-event record in 2006. Figure 7 shows the monthly frequency of tornadoes in 2023 compared to the 1991–2020 average frequency. The first four months of the year had well above average tornado frequency, including the largest March tornado outbreak on record in the state (https://www.weather.gov/ilx/TornadoEvent_3-31-23). The 49 tornadoes in March 2023 represent 20 percent of all March tornadoes in Illinois since 1950. Dry weather in May and June was not conducive to severe weather, but tornado frequency was above average in July and August. Only one torando was reported in the last four months of the year. It is likely the 2023 tornado total will be adjusted, but irrespective of changes, 2023 was an extremely active tornado year.
Figure 7. Plot shows tornado frequency by month in 2023 (blue bars) compared to the 1991–2020 average (red bars).
The NOAA Storm Prediction Center also had 303 hail reports and 699 severe wind reports in Illinois in 2023. Many of the wind reports came from a strong derecho that moved through the state on June 29. Some of the worst wind damage from the event was in Springfield, and many residents went without power for nearly a week: https://www.weather.gov/ilx/june29_derecho.
Extreme precipitation and resultant flooding have become a mainstay in Illinois. Last year brought several very heavy precipitation events across the state. Among these events was a series of storms that moved over Chicago on July 2, producing 4 to 8 inches in less than a day: https://www.weather.gov/lot/2023_07_02_Flooding. The resulting flooding on the west side of the city affected thousands of residents and spurred a disaster declaration. Later in the same month, a series of storms produced extremely heavy rainfall across southern Illinois and western Kentucky: https://www.weather.gov/pah/FloodingJuly19_2023. Widespread totals of 6 to 10 inches produced dangerous flash flooding in parts of Pulaski County. The same storm broke the Kentucky state single-day precipitation total with 12.76 inches in Graves County.