
Illinois was both warmer and drier than the 1991–2020 normal in 2023. The statewide average annual temperature was 54.8 degrees, 2.2 degrees above normal and 5th warmest on record statewide. Statewide average total precipitation in 2023 was 34.41 inches, 6.34 inches below normal and the 29th driest year on record.
2023 Temperatures
The past year was very warm in Illinois, but the largest temperature departures from normal were during the climatologically coldest months. January, February, and December 2023 were all at least 5 degrees warmer than normal, while June, July, and August were near to slightly cooler than normal (Figure 1).
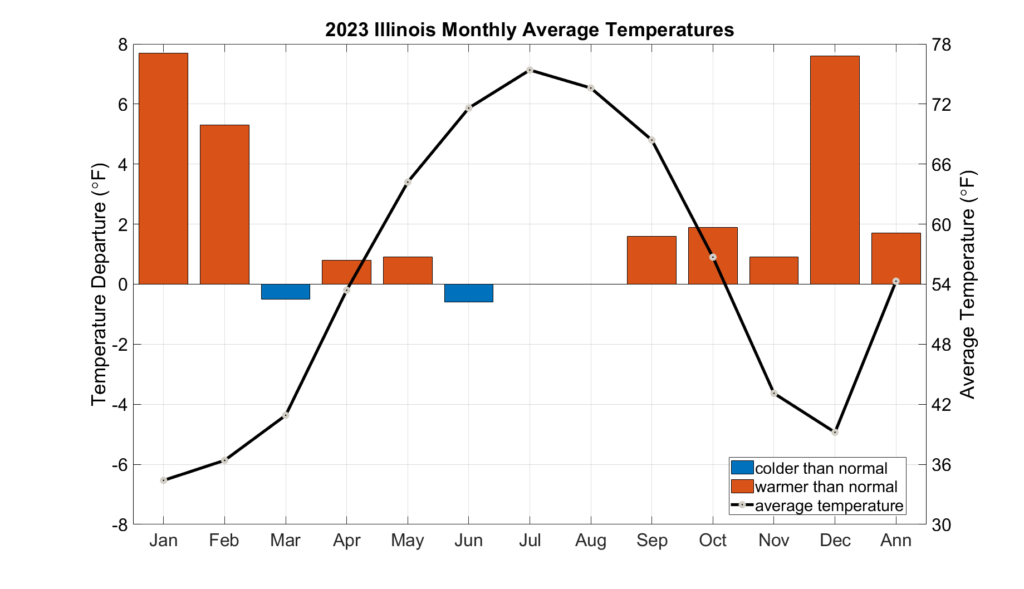
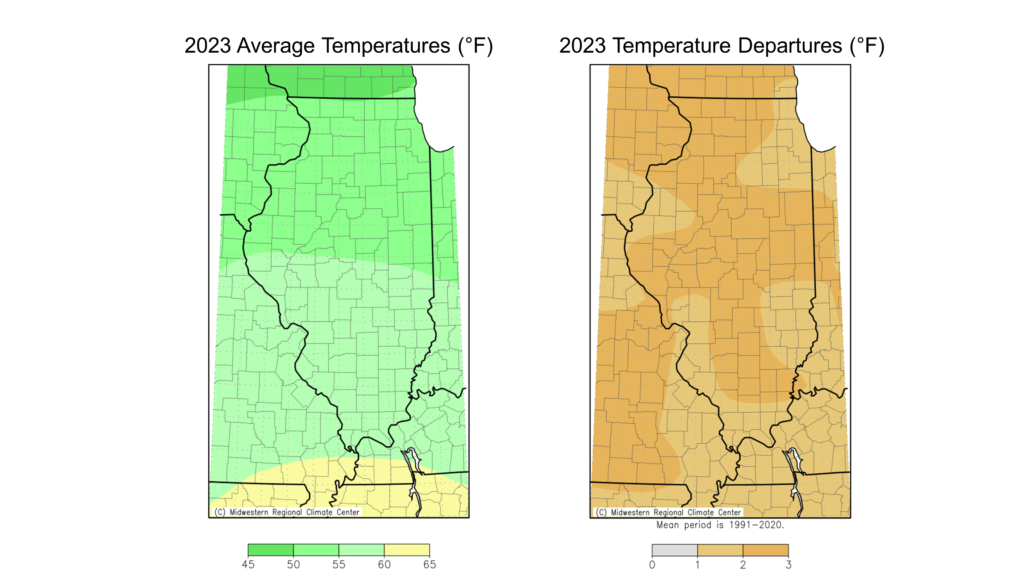
Figure 2 shows 2023 average temperatures and departures from normal across the state. Average temperatures ranged from the low 50s in northern Illinois to the high 50s in southern Illinois. The entire state was between 1 and 2 degrees above normal last year.
The year 2023 was the 2nd warmest on record in St. Louis, 3rd warmest on record in Chicago and Moline, the 7th warmest in Champaign-Urbana, the 8th warmest on record in Carbondale, the 9th warmest in Rockford, the 12th warmest in Springfield, and the 14th warmest in Quincy. The warmest point in the state last year was Du Quoin with an average temperature of 60.3 degrees. The coolest point in the state was Stockton in Jo Daviess County with an average temperature of 49.3 degrees.
Last year also tied with 1931 for warmest on record in Peoria with an average temperature of 55.6 degrees. The year 1900 had a higher annual average temperature in Peoria but had almost a month’s worth of missing daily weather observations and is therefore not considered for annual records. Figure 3 shows the record of annual average temperature in Peoria going back to the 1880s. A long-term warming trend is also evident in Peoria’s temperature record.
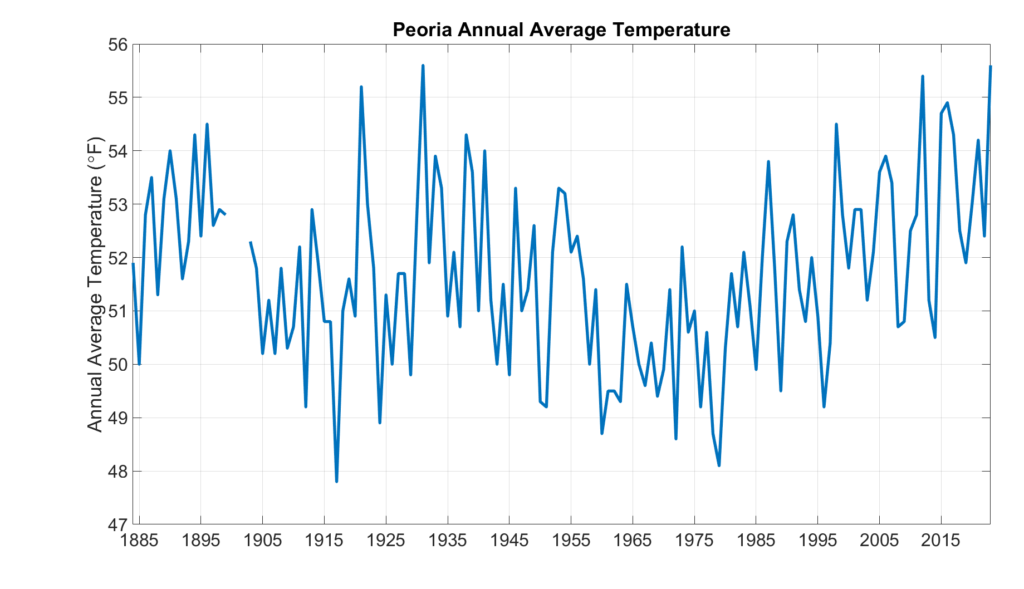
Table 1 shows the number of daily weather records broken at Illinois Cooperative Observer stations in each month of 2023.
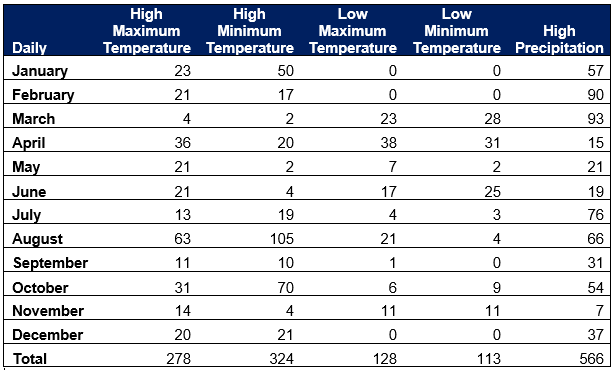
August led with the highest number of daily high maximum and daily high minimum temperature records, with 63 and 105, respectively. Two stations in Illinois broke their August high maximum temperature records in 2023. McHenry set a new August high maximum temperature record with 97 degrees on August 24 and then broke it with 98 degrees on August 25. Nine stations also broke their August high minimum temperature records in 2023, including an 81-degree low in Du Quoin on August 22. Three stations set their all-time high minimum temperature records last year in August, including a 79-degree low in Peoria on August 25. The August records were set by an intense late-season heat wave across the state. Peoria set a new heat index record of 121 degrees, breaking its previous record from 1995.
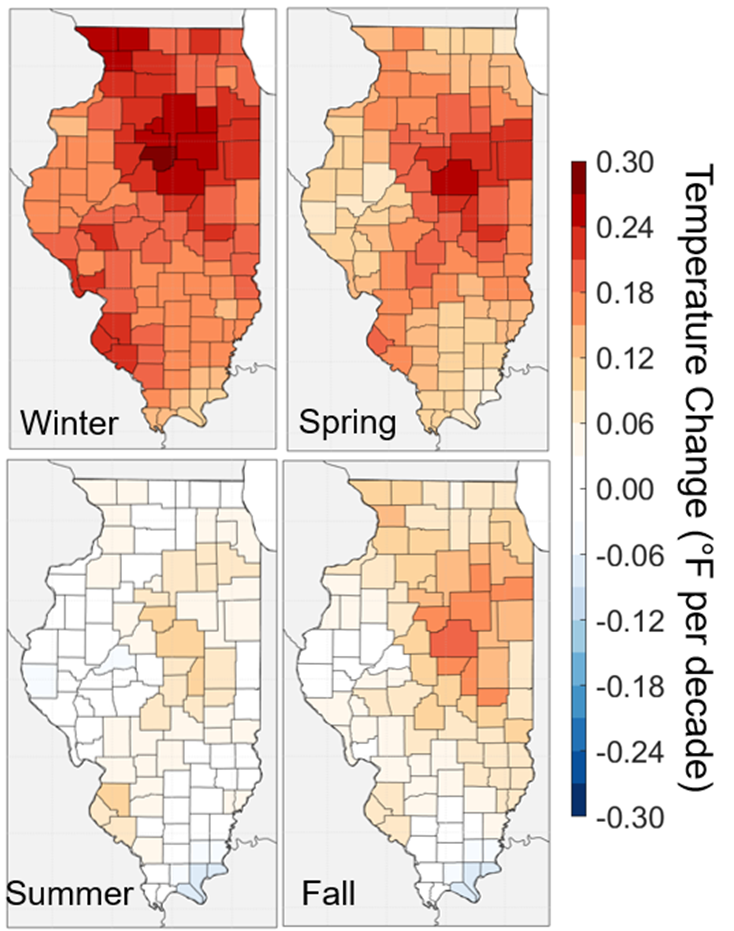
Also of note was the absence of extreme cold in the 2023 winter months. No stations broke daily low maximum or low minimum temperature records in January, February, or December. In fact, no station recorded a nighttime low temperature in the single digits in December for the first time on record in Illinois. The lowest temperature Champaign-Urbana hit all year in 2023 was 5 degrees, the second highest annual minimum temperature on record there and the lowest since 1921. While all four seasons in Illinois have warmed because of human-driven climate change, winter temperatures have increased at a much faster rate than in all other seasons (Figure 4). In winter, the most extreme low temperatures have increased at a faster rate than milder temperatures, making for less frequent and intense cold weather across the state in recent decades.
Milder temperatures in March and April also resulted in dozens of low maximum and low minimum temperature records broken across the state in 2023. However, two and a half times as many high maximum or high minimum temperature records (602) were broken last year in Illinois as low maximum or low minimum temperature records (241).
There were also 566 daily total temperature records broken across Illinois in 2023. Daily temperature records broken were somewhat equally spread among months, but February and March led with 90 and 93 degrees, respectively.
2023 Precipitation
Calendar year 2023 began with wetter than normal months in January, February, and March (Figure 5). The combination of wetter spring conditions and a large snowpack that rapidly melted in the Upper Midwest led to brief flooding along the upper Mississippi River, including the fourth highest crest on record at Davenport.
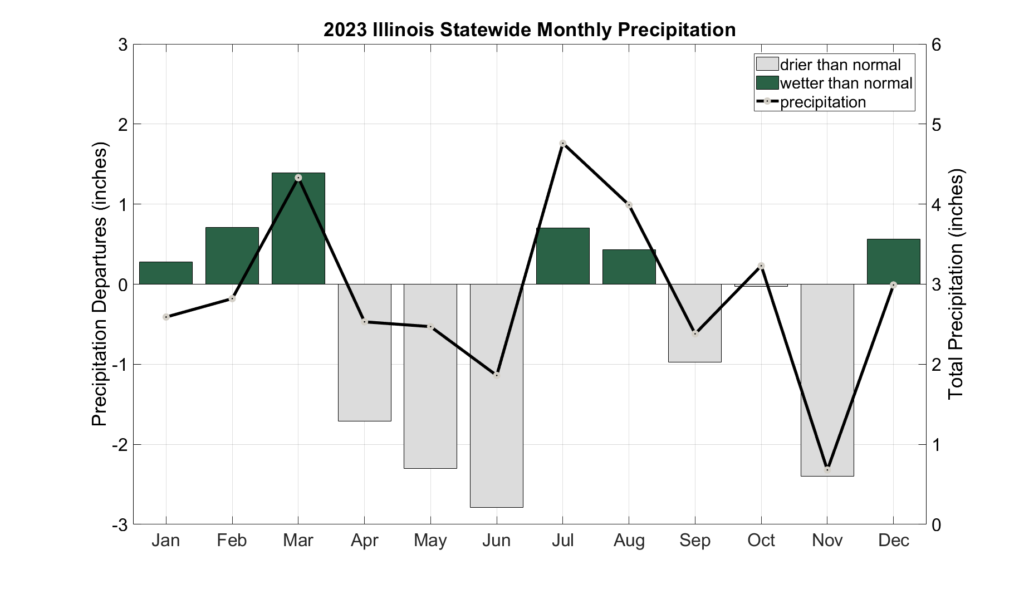
April, May, and June were all somewhat to very dry across the state. Dry weather and high evaporation in late April quickly dried out topsoil and–along with strong winds and farming activity–contributed to a severe dust storm on May 1 in south-central Illinois. The near zero visibility caused a 72-vehicle pileup on Interstate 55 that killed 7 and injured another 37 (https://www.weather.gov/ilx/01may2023-dust).
The state accumulated a nearly 6-inch precipitation deficit from April and June, which plunged most of Illinois into a significant drought. The June 27 U.S. Drought Monitor showed over 90 percent of the state in at least moderate drought and nearly 60 percent of the state in at least severe drought. Pasture conditions deteriorated rapidly in the early summer with little regrowth after the first hay cutting. Mature trees in central and northern Illinois showed significant stress and many municipalities reported substantial young tree mortality across the state.
July and August brought enough rain to limit agricultural and water resource impacts from the drought. Very heavy rain in Chicago in both July and August caused widespread flooding of hundreds of homes. Berwyn, Cicero, and Garfield Park all reported over 8 inches of rain in less than a day (https://www.weather.gov/lot/2023_07_02_Flooding).
For the second consecutive year, Illinois fell back into drought in the fall as the months of September, October, and November were all drier than normal statewide. After reaching its fourth highest crest at Davenport, the Mississippi River once again dipped below low stage in St. Louis and Memphis, forcing active dredging throughout the fall.
Overall, the preliminary statewide average total precipitation in 2023 was 34.63 inches, 6.12 inches below normal and the 30th driest year on record. Much like past years, the statewide preciptiation statistics are not representative of all places in Illinois. Calendar year 2023 had close to normal precipitation in parts of northern and southern Illinois, but was somewhat to much drier than normal in parts of central Illinois.
Figure 6 shows the spatial variability of 2023 precipitation in more detail. Total precipitation last year ranged from over 50 inches in far southern Illinois to less than 25 inches across parts of western Illinois.
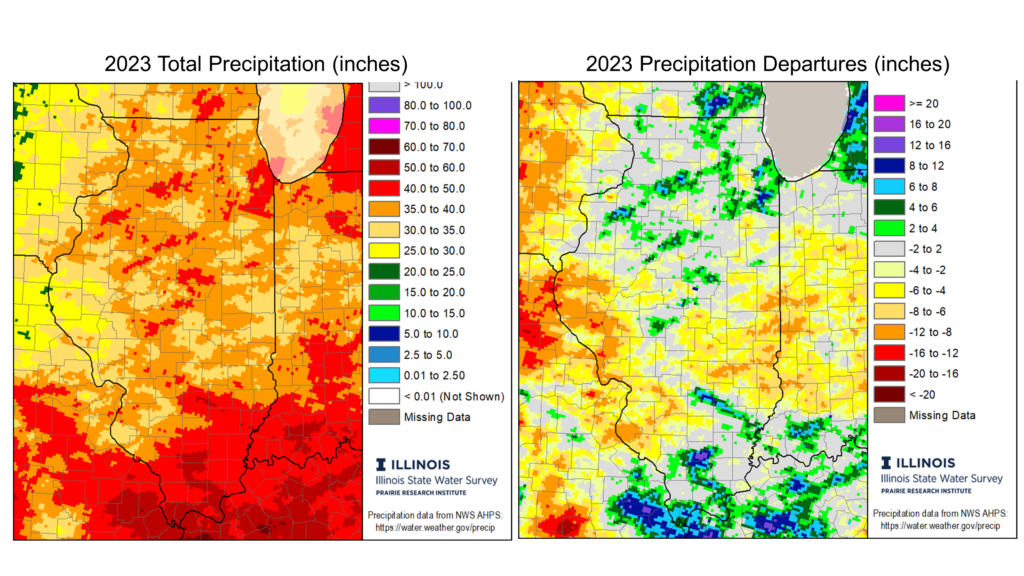
A CoCoRaHS citizen science observer in Bush in Williamson County reported 57.23 inches of precipitation in 2023, making it the wettest point in the state. Meanwhile, the long-running station in Quincy recorded just 22.79 inches of precipitation in 2023, about 60 percent of normal. In fact, last year was the 4th driest on record in Quincy. The Gem City has only had 54 inches of precipitation since Jan. 1, 2022, making for the third driest two-year period on record there after 1953-54 and 1988-89.
2023 Severe Weather
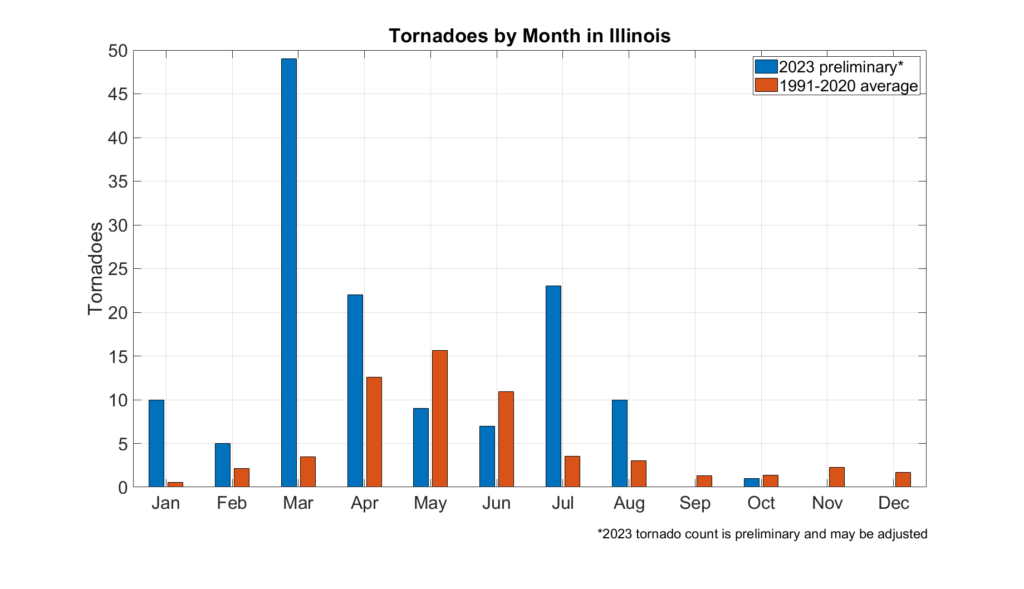
Severe weather came early and often in 2023, with all of our 102 counties affected by strong wind, hail, tornadoes, or heavy rain (Figure 7). Overall, the NOAA Storm Prediction Center reported a preliminary 135 tornadoes in Illinois in 2023, which–if confirmed–would set a new annual tornado record, breaking the 124-event record in 2006. Figure 7 shows the monthly frequency of tornadoes in 2023 compared to the 1991–2020 average frequency. The first four months of the year had well above average tornado frequency, including the largest March tornado outbreak on record in the state (https://www.weather.gov/ilx/TornadoEvent_3-31-23). The 49 tornadoes in March 2023 represent 20 percent of all March tornadoes in Illinois since 1950. Dry weather in May and June was not conducive to severe weather, but tornado frequency was above average in July and August. Only one torando was reported in the last four months of the year. It is likely the 2023 tornado total will be adjusted, but irrespective of changes, 2023 was an extremely active tornado year.
The NOAA Storm Prediction Center also had 303 hail reports and 699 severe wind reports in Illinois in 2023. Many of the wind reports came from a strong derecho that moved through the state on June 29. Some of the worst wind damage from the event was in Springfield, and many residents went without power for nearly a week: https://www.weather.gov/ilx/june29_derecho.
Extreme precipitation and resultant flooding have become a mainstay in Illinois. Last year brought several very heavy precipitation events across the state. Among these events was a series of storms that moved over Chicago on July 2, producing 4 to 8 inches in less than a day: https://www.weather.gov/lot/2023_07_02_Flooding. The resulting flooding on the west side of the city affected thousands of residents and spurred a disaster declaration. Later in the same month, a series of storms produced extremely heavy rainfall across southern Illinois and western Kentucky: https://www.weather.gov/pah/FloodingJuly19_2023. Widespread totals of 6 to 10 inches produced dangerous flash flooding in parts of Pulaski County. The same storm broke the Kentucky state single-day precipitation total with 12.76 inches in Graves County.