
The preliminary statewide average March temperature was 42.5 degrees, 1.5 degrees above the 1991–2020 average and tied for the 40th warmest on record going back to 1895. The preliminary statewide average total March precipitation was 4.54 inches, 1.32 inches above the 1991–2020 average and the 21st wettest on record statewide.
Data are provisional and may change slightly over time
Variable, But Warm March
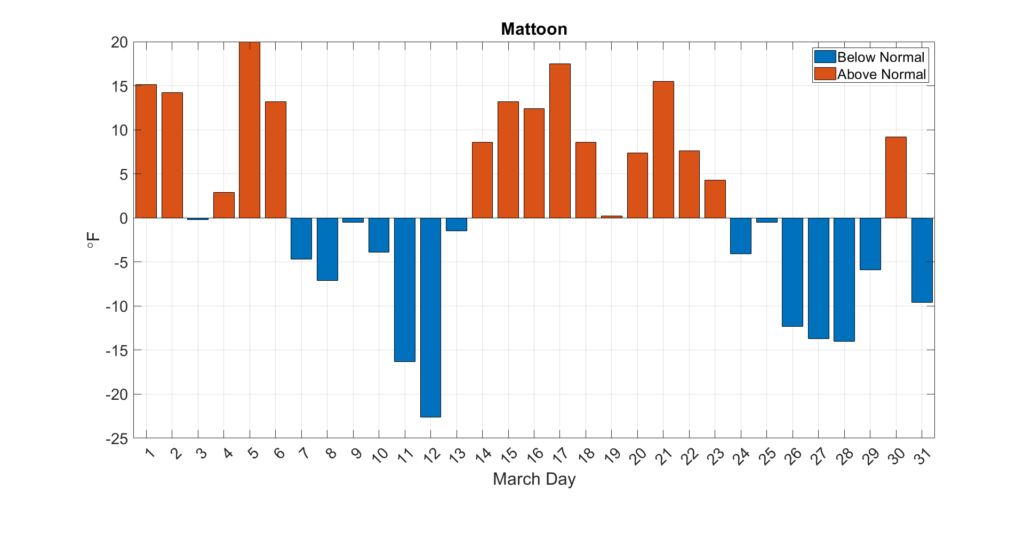
Climatologically, March temperatures are among the most variable, day-to-day. This past month followed suit, as is shown in daily temperature departures from Mattoon (Figure 1).
March brought typical large temperature swings, with temperatures 10 to 15 degrees above normal in the first and third weeks of the month, and 10 to 15 degrees below normal in the second and fourth weeks. Only 10 out of the 31 days of the month had average temperatures that were within 5 degrees of the 30-year normals.
March average temperatures ranged from the high 30s in northern Illinois to the high 40s in southern Illinois, between 1 and 4 degrees above the 1991–2020 normal (Figure 2). Several stations saw high temperatures in the high 70s early in the month, and even highs of over 80 degrees in St. Clair and Randolph counties. Meanwhile, many places in northern and central Illinois saw nighttime low temperatures in the single digits, including 3 degrees in Knox County.
Altogether, daily high maximum temperature records were broken at 14 stations in March, and daily high minimum temperature records were broken at one station. Daily low maximum temperature records were broken at 11 stations and daily low minimum temperature records were broken at 9 stations last month.

Overall, the preliminary statewide average March temperature was 42.5 degrees, 1.5 degrees above the 1991–2020 average and tied for 40th warmest on record going back to 1895.
Wet End to March
The first two-thirds of March were quite dry in northern and southern Illinois, to the tune of 0.5 to 1 inch drier than normal through March 21. A series of storms moved through the Midwest in the last week of March and brought significant precipitation across the state in the form of rain, sleet, and snow.
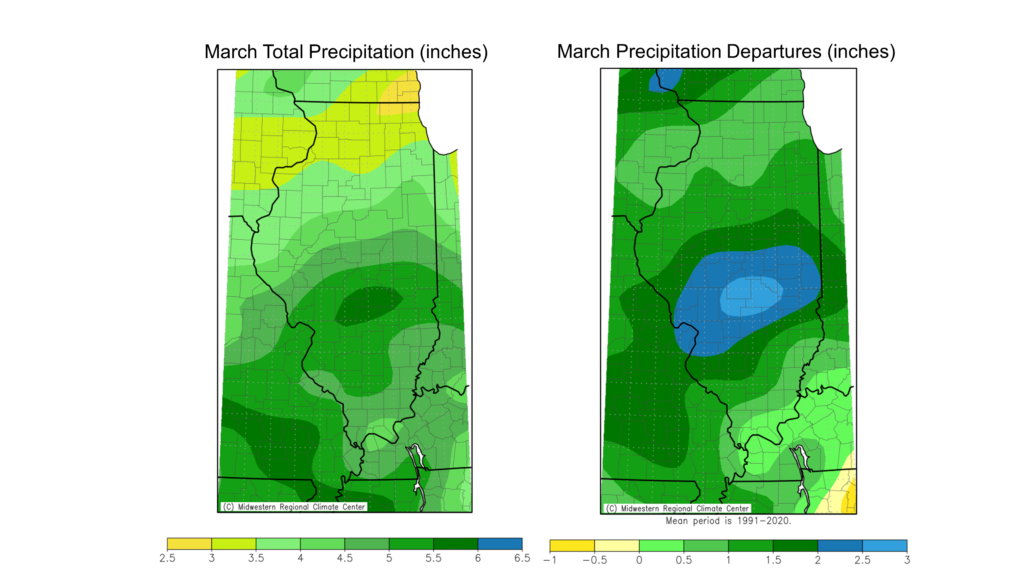
In the end, March total precipitation ranged from just over 3 inches in northern Illinois to nearly 6 inches in south-central Illinois, between one-half and 3 inches above the 1991–2020 normal (Figure 3). Stations in Alton, Mt. Vernon, and Mattoon received over 7 inches of precipitation in March, over 4 inches above normal.
Although the March precipitation was a bit lighter in northern and northwest Illinois, the late-month precipitation considerably improved drought conditions. The latest U.S. Drought Monitor, published March 31, improved the McHenry and Lake county listing from severe to moderate drought and completely removed drought in parts or all of Mercer, Henry, and Lee counties.
Meanwhile, the additional late March precipitation on already wet soils in central and south-central Illinois has caused more extensive standing water in fields and more areas reaching above flood stage along the Illinois, Wabash, and Kaskaskia rivers.
The preliminary statewide average total March precipitation was 4.54 inches, 1.32 inches above the 1991–2020 average and the 21st wettest on record statewide.
Yes, It Snows in March
After a virtually snowless December and holiday season, the snow finally arrived in February. Now that most folks are getting ready for spring and summer, Mother Nature said, “here’s that snow you ordered.” However, last month was certainly not the snowiest March on record, and only western Illinois had above normal March snow accumulation. Overall, March total snowfall ranged from over 4 inches in northern Illinois to less than a tenth of an inch in south-central Illinois (Figure 4).
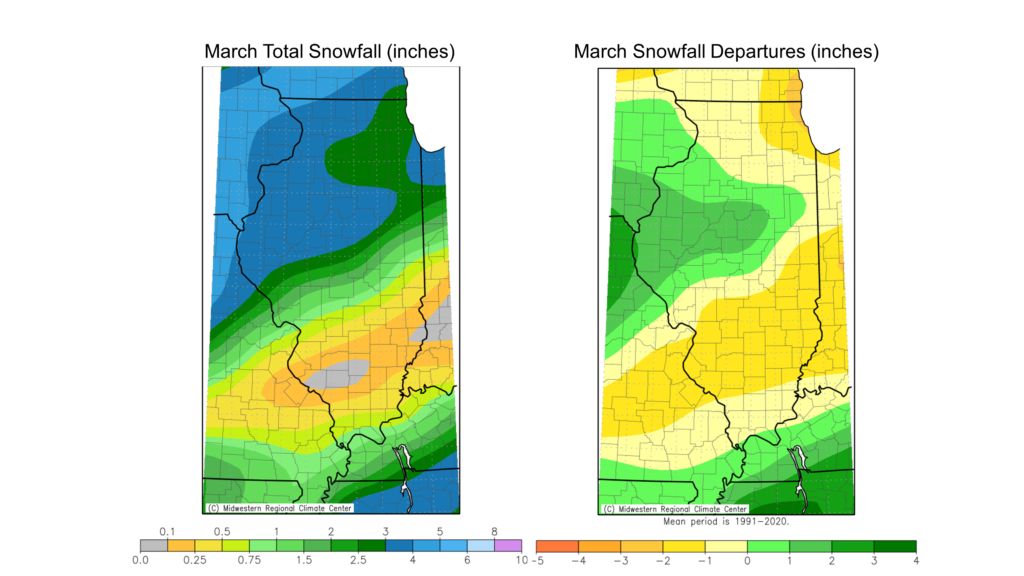
Figure 4. Maps show (left) total March snowfall and (right) March snowfall departure from normal.
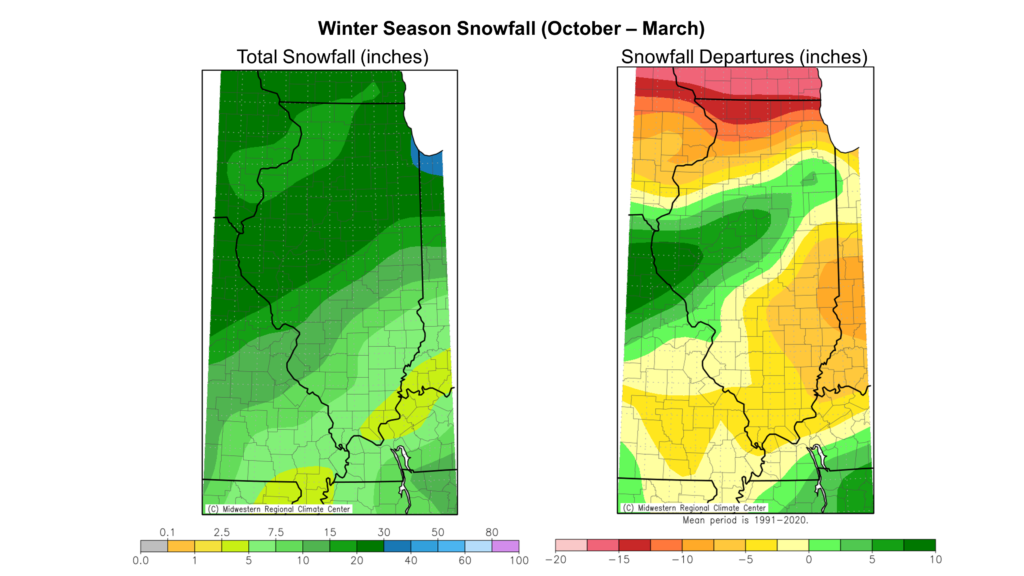
The technical climatological winter season is from December through February; however, as we all know, the snowfall season can begin much earlier and end much later. A good estimate of the full winter snowfall season in Illinois is from October 1 through May 1. Figure 5 shows the winter season-to-date total snowfall and departures from normal. Since October 1, snowfall totals have ranged from just under 5 inches in far southeastern Illinois to over 30 inches in northeast Illinois.
The area of the highest February snowfall from the northern edge of the St. Louis Metro East area to the southern edge of Chicagoland has been 1 to 10 inches snowier than normal since October 1, while snowfall in much of the rest of the state has been 2 to 7 inches below normal. The season’s total deficits are highest north of Interstate 80, with much of northern Illinois having 10 to 15 inches less snow than normal by the end of March.
April & Beyond Outlooks
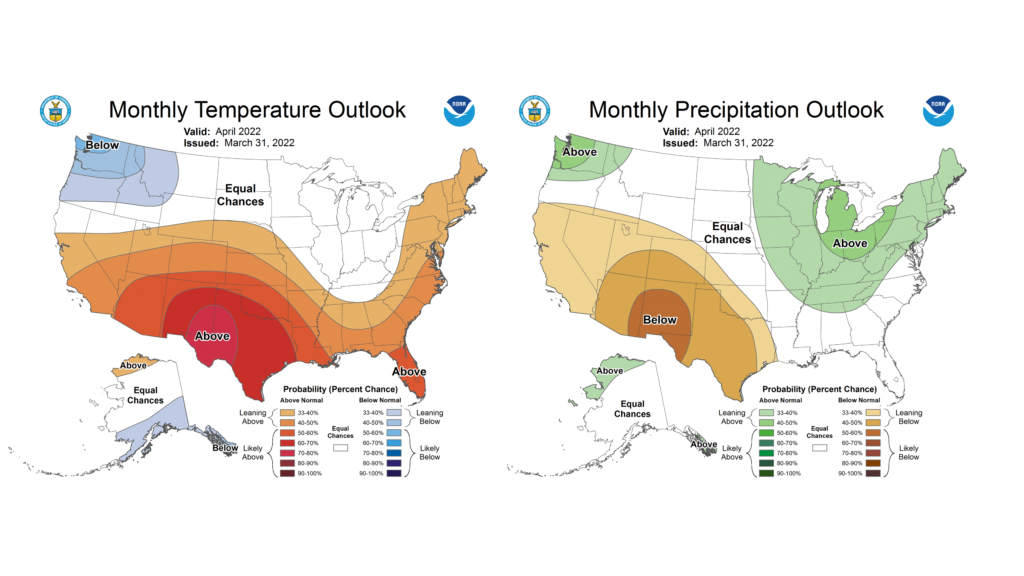
April is truly a transition month as we say goodbye to winter weather and look ahead to summer. Final outlooks for the entire month of April show equal chances of above and below normal temperatures, and a continuation of leaning to likely above normal precipitation.
This is good news in northern Illinois to help continue drought improvement. However, a continuation of frequent precipitation events in April could further delay agriculture activity and fieldwork in the wetter parts of central and southern Illinois.
Meanwhile, the seasonal outlook for April through June still leans to warmer than normal weather for the spring-summer transition. Notice that for the April to June period we’re sandwiched between areas with higher chances of drier conditions west and wetter conditions east. This reflects the potential of a tight precipitation gradient as we move into summer, and we’ll see how these outlooks adjust in the coming weeks.