The preliminary statewide average December temperature was 39.2 degrees, 7.6 degrees above the 1991–2020 average and the 3rd warmest on record going back to 1895. The preliminary statewide average total December precipitation was 2.99 inches, 0.56 inches above the 1991–2020 average and the 30th wettest on record statewide.
Data are provisional and may change slightly over time.
Where is Winter?
For the second time in three years Illinois has experienced an extremely mild December. All but three days last month were warmer than normal in Decatur, and several days in the second and fourth weeks of the month were 10 to 20 degrees warmer than normal (Figure 1).

Table 1 shows the December average temperature, departure from normal, and ranking for several locations in Illinois. Last month was the 2nd warmest December in Rockford, the 3rd warmest in Peoria, and the 4th warmest in Chicago and Moline. None of the 120+ National Weather Service stations in Illinois recorded a low temperature in the single digits last month, and many places hit the freezing mark only a handful of nights.

When taken altogether, December average temperatures ranged from the low 30s in northern Illinois to the low 40s in southern Illinois, between 6 and 10 degrees above normal (Figure 2). The warmest place in the state last month was Du Quoin with an average December temperature of 46.1 degrees. The coolest place in the state was Stockton in Jo Daviess County with an average December temperature of 33.9 degrees. It is important to note that the nighttime low temperatures last month were much higher than normal. The preliminary average December minimum temperature in Illinois is 32.2 degrees, which would be the 2nd highest on record statewide.

The mild weather last month broke 20 daily high maximum temperature records and an incredible 99 daily high minimum temperature records. No daily low maximum or daily low minimum temperature records were broken last month.
Overall, the preliminary statewide average December temperature was 39.2 degrees, 7.6 degrees below the 1991–2020 average and the 3rd warmest on record going back to 1895.
Split December Precipitation Pattern
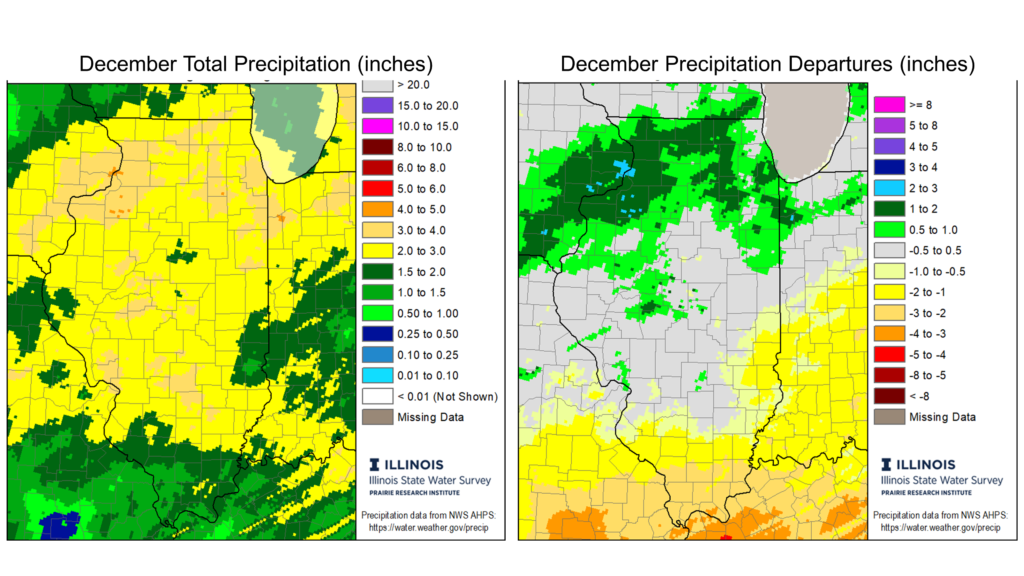
The first month of climatological winter brought a more active storm track to the Midwest than for most of fall. December total precipitation ranged from just over 4 inches in parts of northern Illinois to less than 1 inch in parts of far southern Illinois. Most of northern Illinois was around 1 inch wetter than normal, while most of the state south of Interstate 64 was 1 to 3 inches drier than normal in December (Figure 3).

Overall, the preliminary statewide average total December precipitation was 2.99 inches, 0.56 inches above the 1991–2020 average and 30th wettest on record statewide.
As is often the case in milder Decembers, snowfall was hard to come by across Illinois last month. December total snowfall ranged from around 4 inches in far northwest Illinois to less than a tenth of an inch in southern Illinois, between 1 and 8 inches below normal (Figure 4).

Outlooks
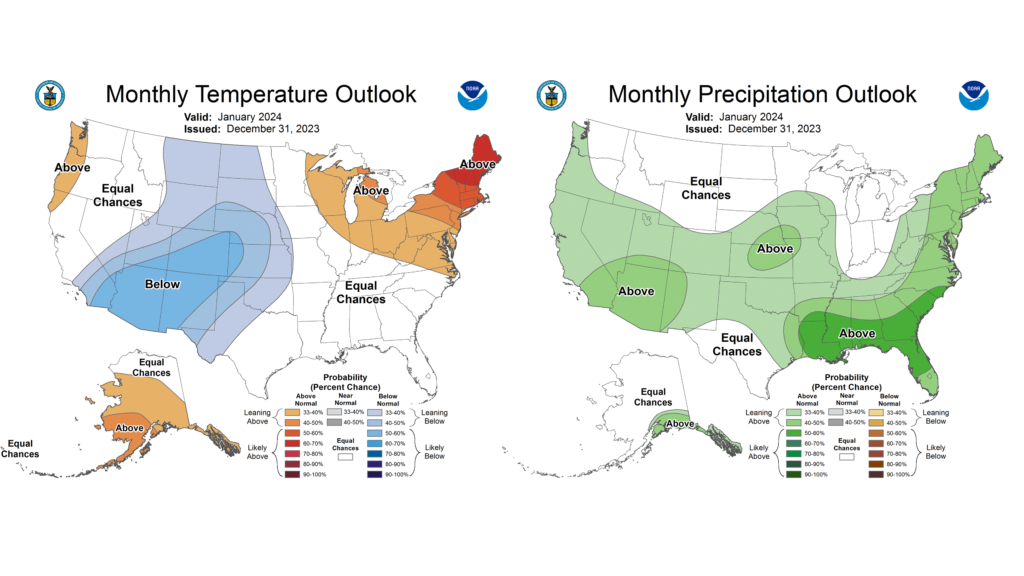
Climate Prediction Center outlooks for January are a bit different than the El Niño-esque patterns we’ve seen recently. Outlooks show mostly equal chances of above and below normal temperatures and precipitation for the first month of the season (Figure 5).


