
The preliminary statewide average January temperature was 25.7 degrees, 1.0 degree above the 1991–2020 average and tied for the 57th coldest on record going back to 1895. The preliminary statewide average total January precipitation was 4.50 inches, 2.19 inches below the 1991–2020 average and tied for the eighth wettest on record statewide.
Data are provisional and may change slightly over time.
Big (but Fleeting) January Chill
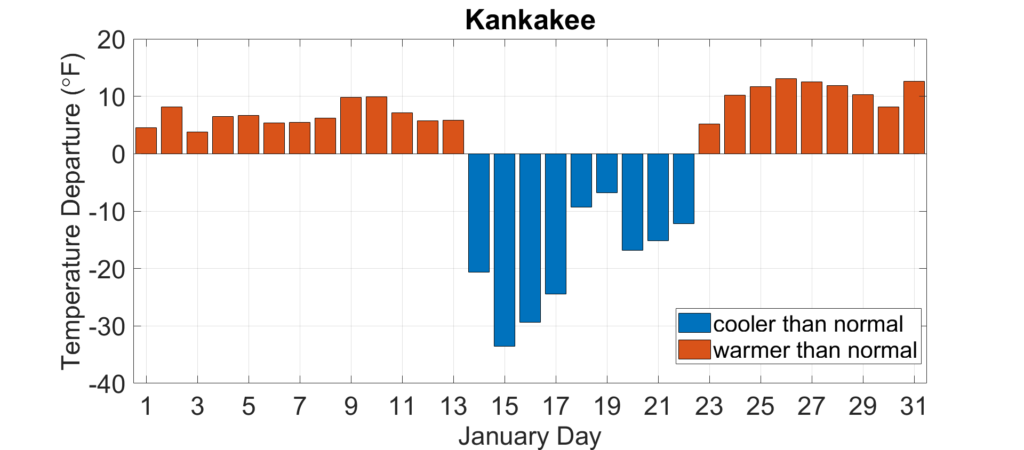
The very mild December weather spilled over into the new year as the first 10 to 12 days of January had temperatures near to slightly above normal. Extremely cold air moved into Illinois following a series of winter storms and brought frigid weather across the state for the middle part of the month. Daily temperature departures from normal in Figure 1 showed average temperatures were 10 to 30 degrees below normal in Kankakee between January 14 and 21. Some of the more impressive actual temperature values from that week included -25 degrees in Altona and -19 degrees in Moline. Strong northerly and northwesterly winds added to the cold and pushed wind chills into the -30- to -40-degree range. Water main breaks were reported across the state, and several school districts closed for multiple days because of the cold. Numerous deaths in the state were attributed to the cold as well. Temperatures moderated in the final week of the month, providing a well-deserved break from an Arctic winter.
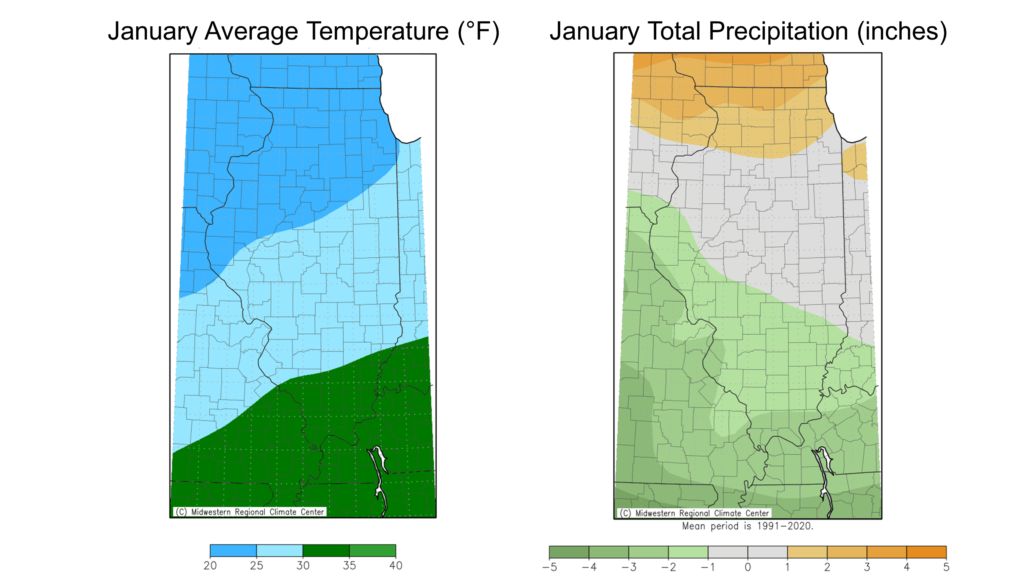
January temperatures ranged from the low 20s in northern Illinois to the mid-30s in southern Illinois (Figure 2). The southern half of the state was 1 to 3 degrees colder than normal last month, and, despite the extreme cold in mid-month, northern Illinois was 1 to 2 degrees warmer than normal in January. The coldest point in the state last month was Stockton in Jo Daviess County at 20.1 degrees, and the “warmest” point was Olmstead in Pulaski County at 32.7 degrees.
A Wet Start to 2024
Precipitation was hard to come by for much of Illinois in the last few months of 2023. Drought impacts are usually minimal in winter, but even so there were many reports of unusually dry soils and low streams and ponds at the start of the new year. While January did not completely replenish all water lost last year, it took a big bite out of drought.
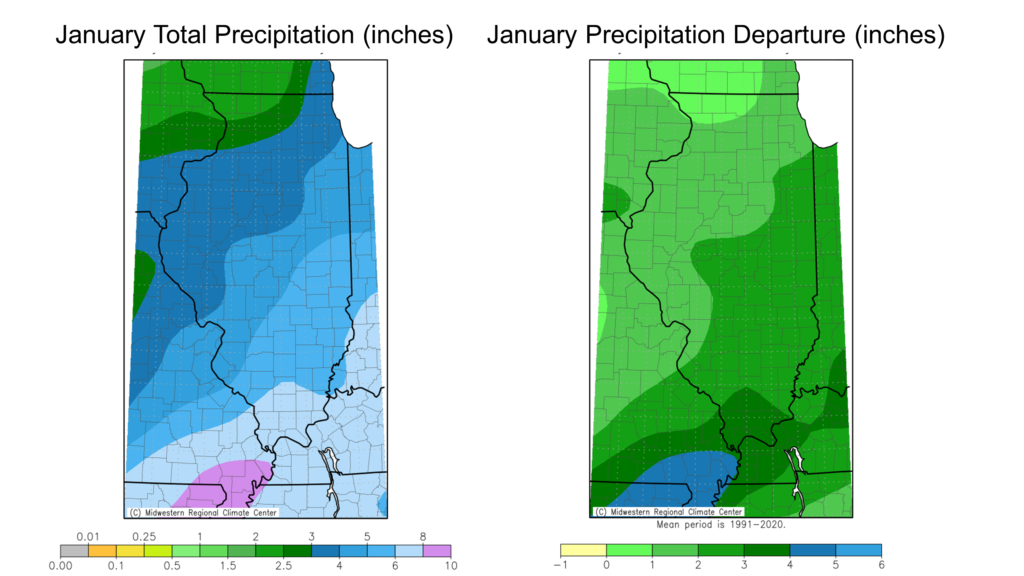
January total precipitation ranged from around 2.5 inches in northwest Illinois to nearly 10 inches in far southern Illinois (Figure 3). Everywhere in Illinois was wetter than normal in January, to the tune of 1 to 4 inches, between 150% and 300% of normal monthly precipitation. The precipitation totals were especially impressive around the Ohio River. Last month was the third wettest January on record in Paducah with 9.43 inches, and the wettest since 1969. It was also the eighth wettest January on record in Champaign and Centralia, both with over 5 inches total.
Overall, the preliminary statewide average total January precipitation was 4.50 inches, 2.19 inches below the 1991–2020 average and tied for the eighth wettest on record statewide.
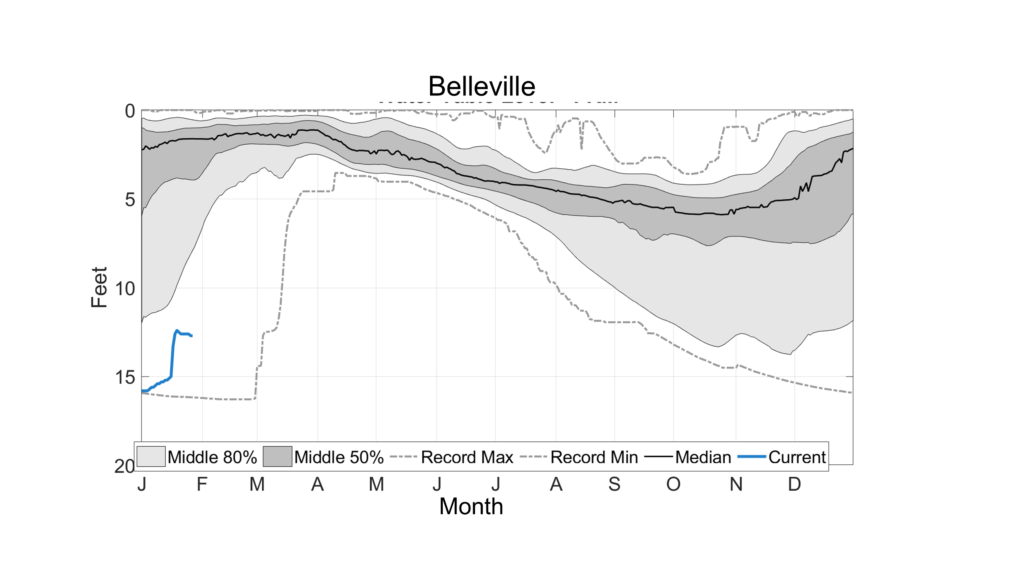
Persistent rain followed by wet, slowly melting snow was perfect for returning moisture to the ground and starting the climb out of drought. Figure 4 shows the water table depth below ground at the Water & Atmospheric Resources Monitoring (WARM) program in Belleville. The water table is the boundary between where the soil is saturated and unsaturated, and its depth is often affected by drought. The average water table depth for this time of the year in Belleville is around 3 feet, meaning that one usually only must dig down 3 feet or so to find completely saturated soil. However, Belleville came into this year with a severely depressed water table that was around 15 feet deep. The water table has begun to inch closer to the surface thanks to the precipitation in January, but as Figure 4 shows, there is much more recovery needed to get closer to average conditions.
Some Snow, At Least
Depending on where you are in our great state, January is either the first or second snowiest month of the year. And if you live north or west of the Illinois River, last month fit that bill quite well. For the rest of us, January just brought more cold rain. Total January snowfall ranged from less than half an inch in southern Illinois to over 25 inches in northwest Illinois; the latter area had 4 to 15 inches above normal snowfall (Figure 5).
Most of the snow in January came immediately ahead of or during the extreme cold in the middle of the month. Moline picked up more snowfall between January 8 and January 18 than in all of 2023, and last month was the second snowiest January on record in Moline, only less than 2019. January 12 was also the second snowiest day on record in Moline, with 15.4 inches; it was only less than on January 3, 1971.
The heavy snowfall in mid-January pushed the northwest corner of the state 1 to 6 inches above normal on season-to-date snowfall. Meanwhile, most of central and southern Illinois have had 2 to 8 inches below normal snowfall (Figure 5).

Outlooks
I’m not one to rely on rodents for my seasonal climate predictions. But as it turns out this year, Punxsutawney Phil and the Climate Prediction Center agree on a mild end to winter. The maps in Figure 6 show the more reliable Climate Prediction Center outlooks for (top) February and (bottom) climatological spring, March through May. Both show higher chances of above normal temperatures. February’s outlook leans a bit more into El Niño with a nod to a drier final month of winter. Meanwhile, the March–May outlook is less confident on precipitation, with equal chances of a wet and dry spring.

