

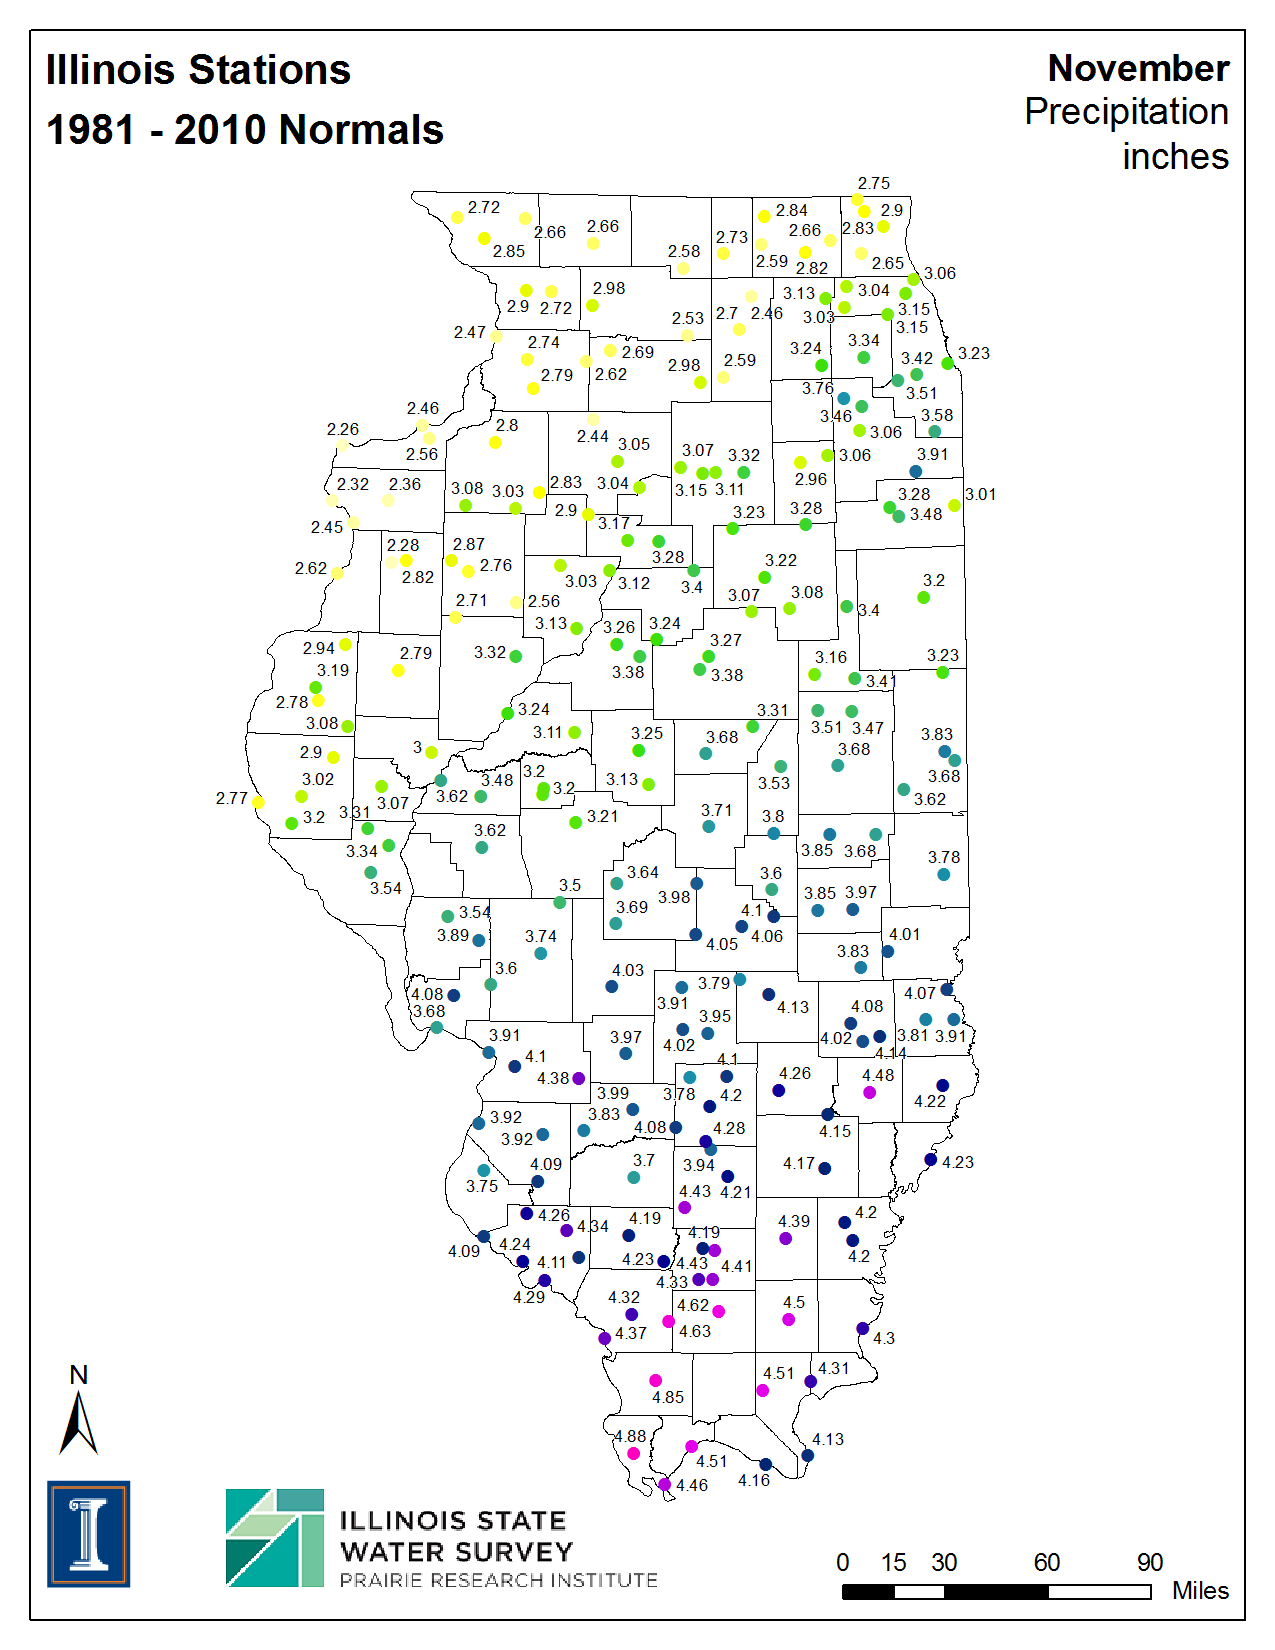
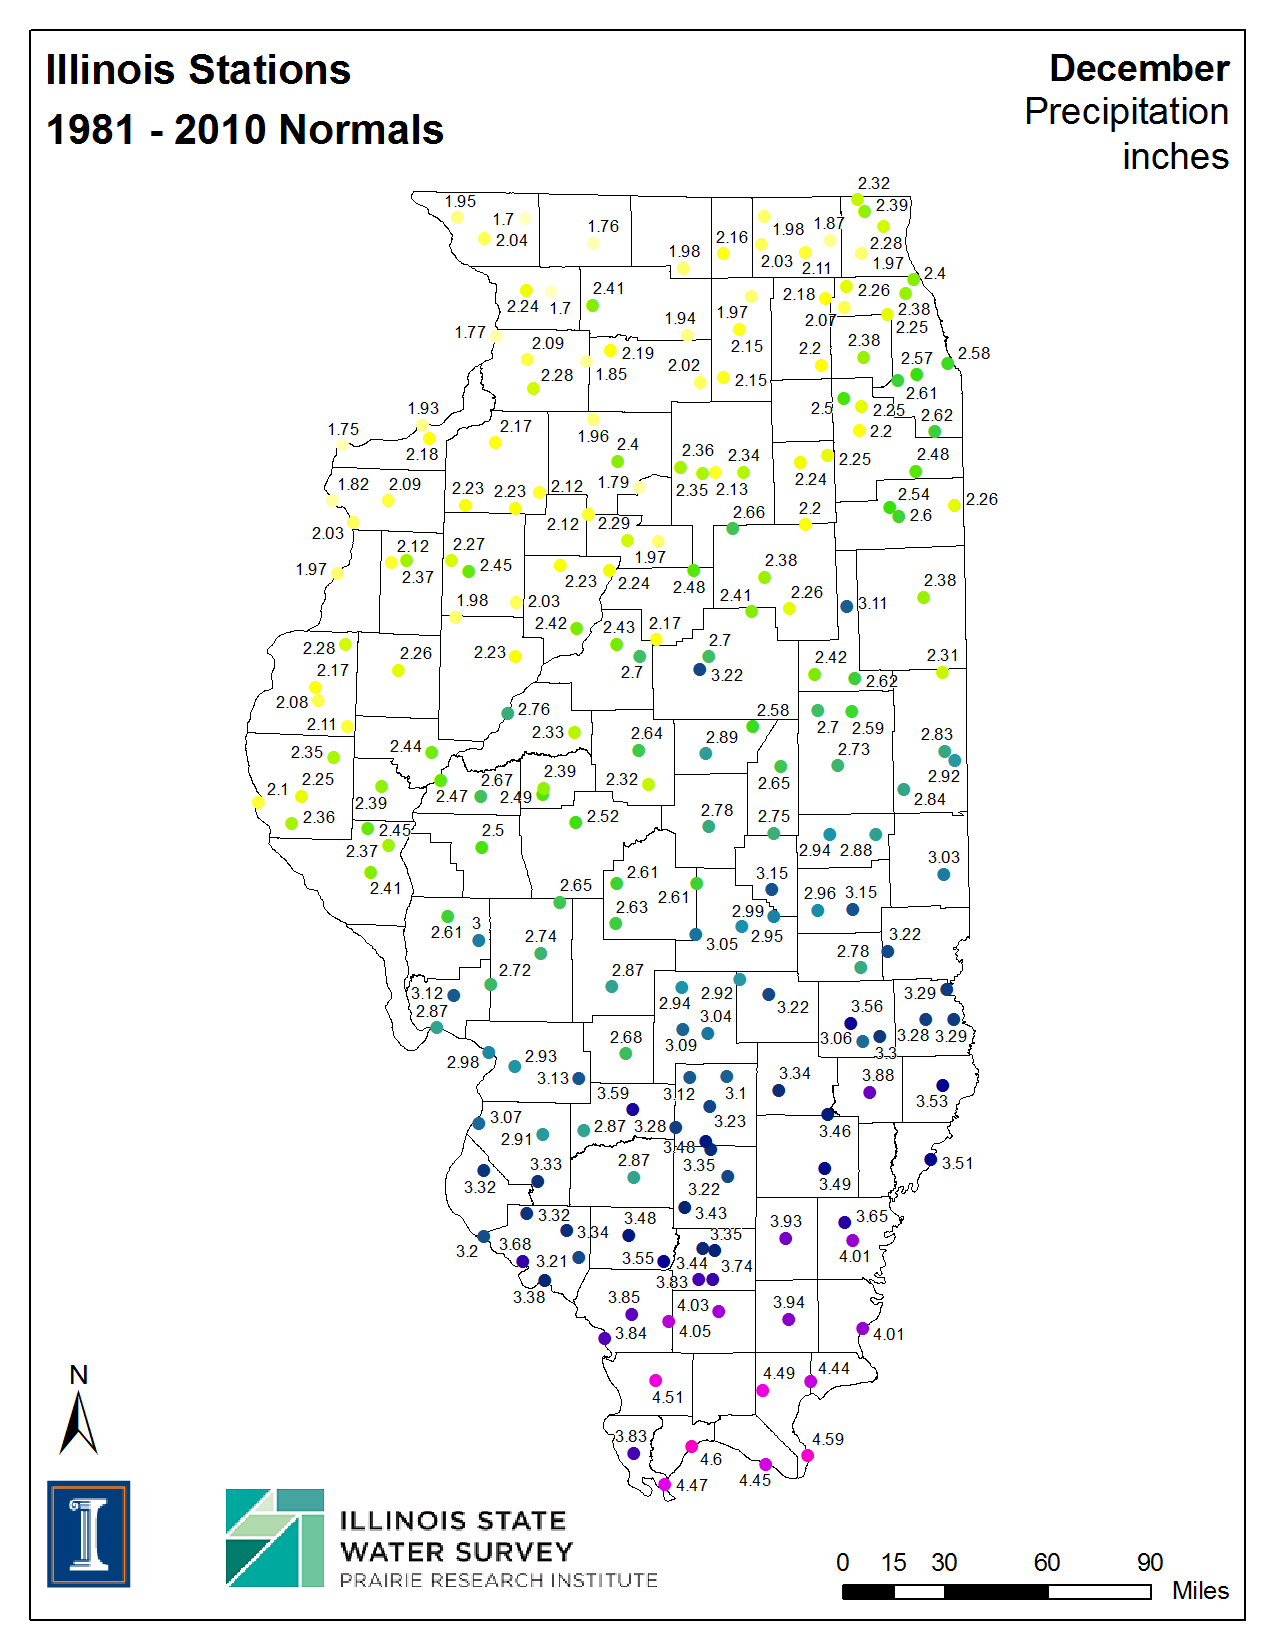
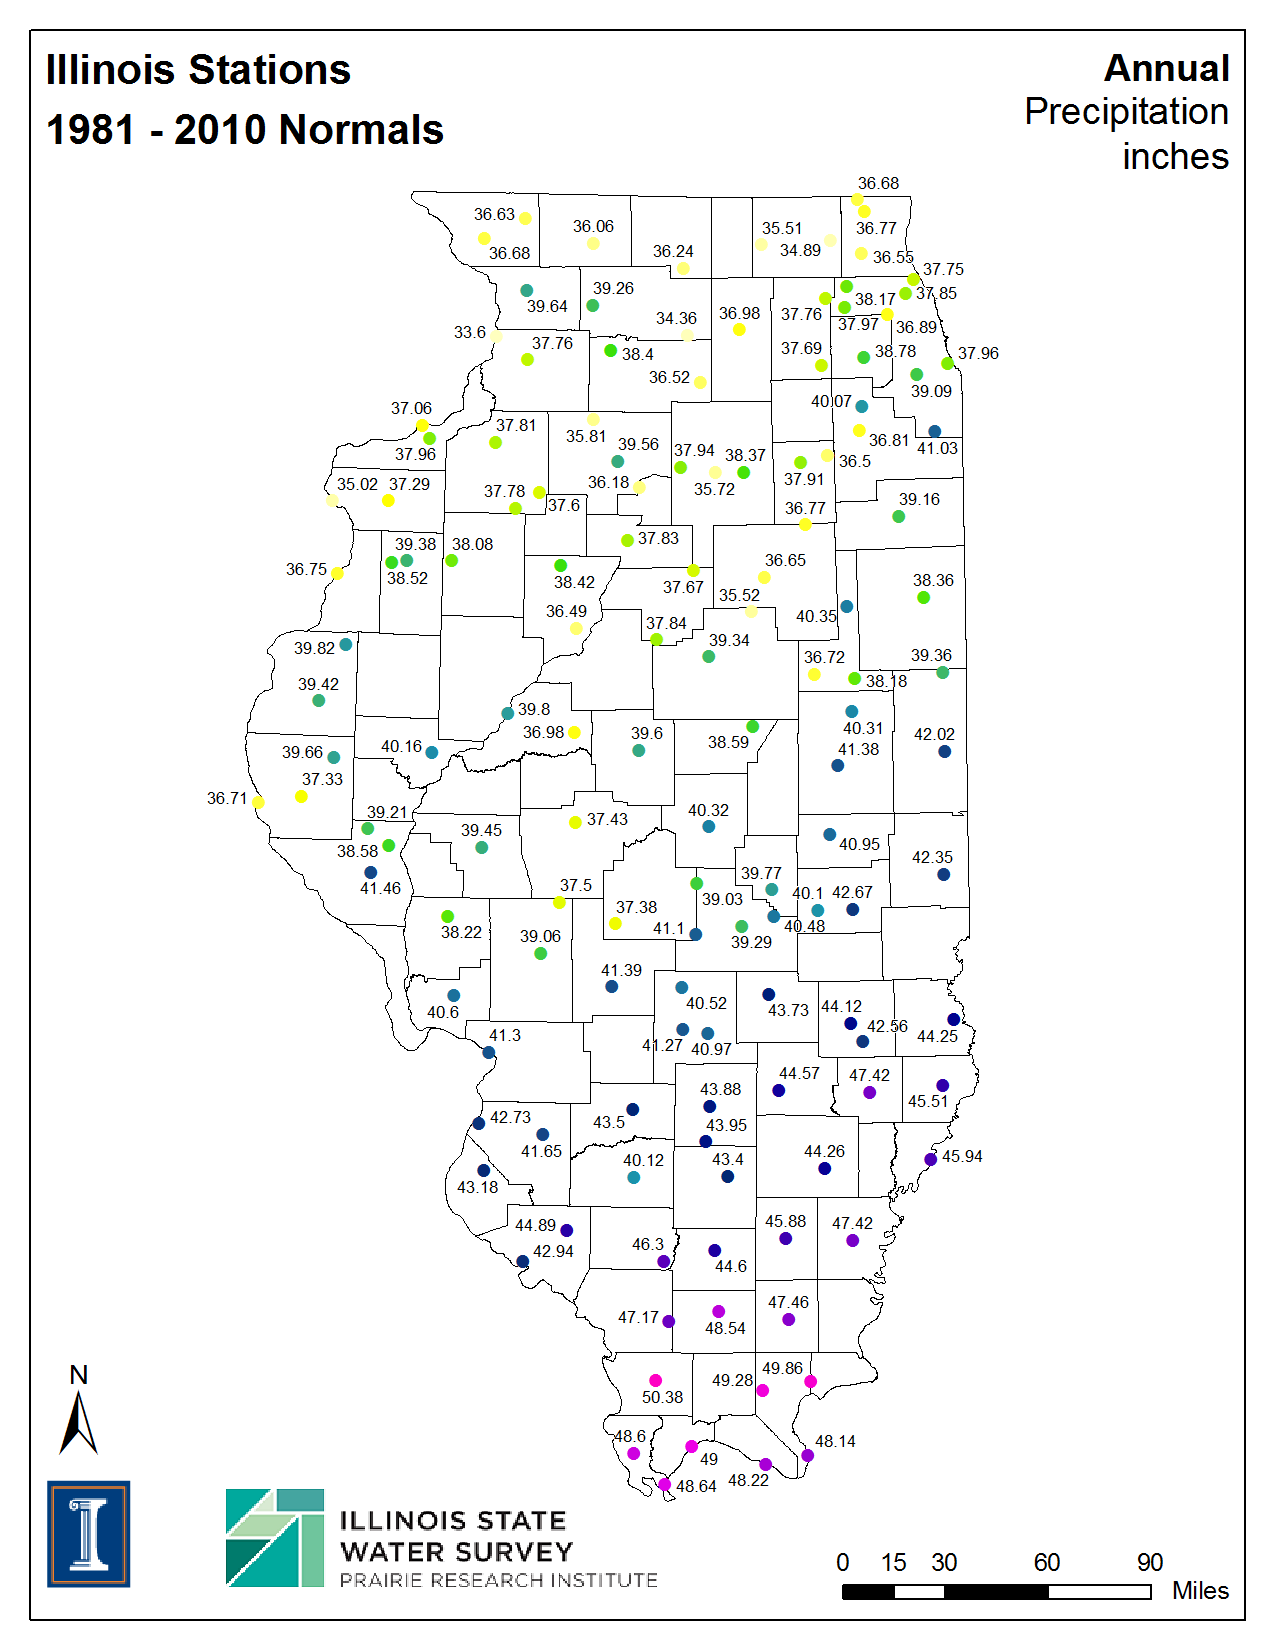
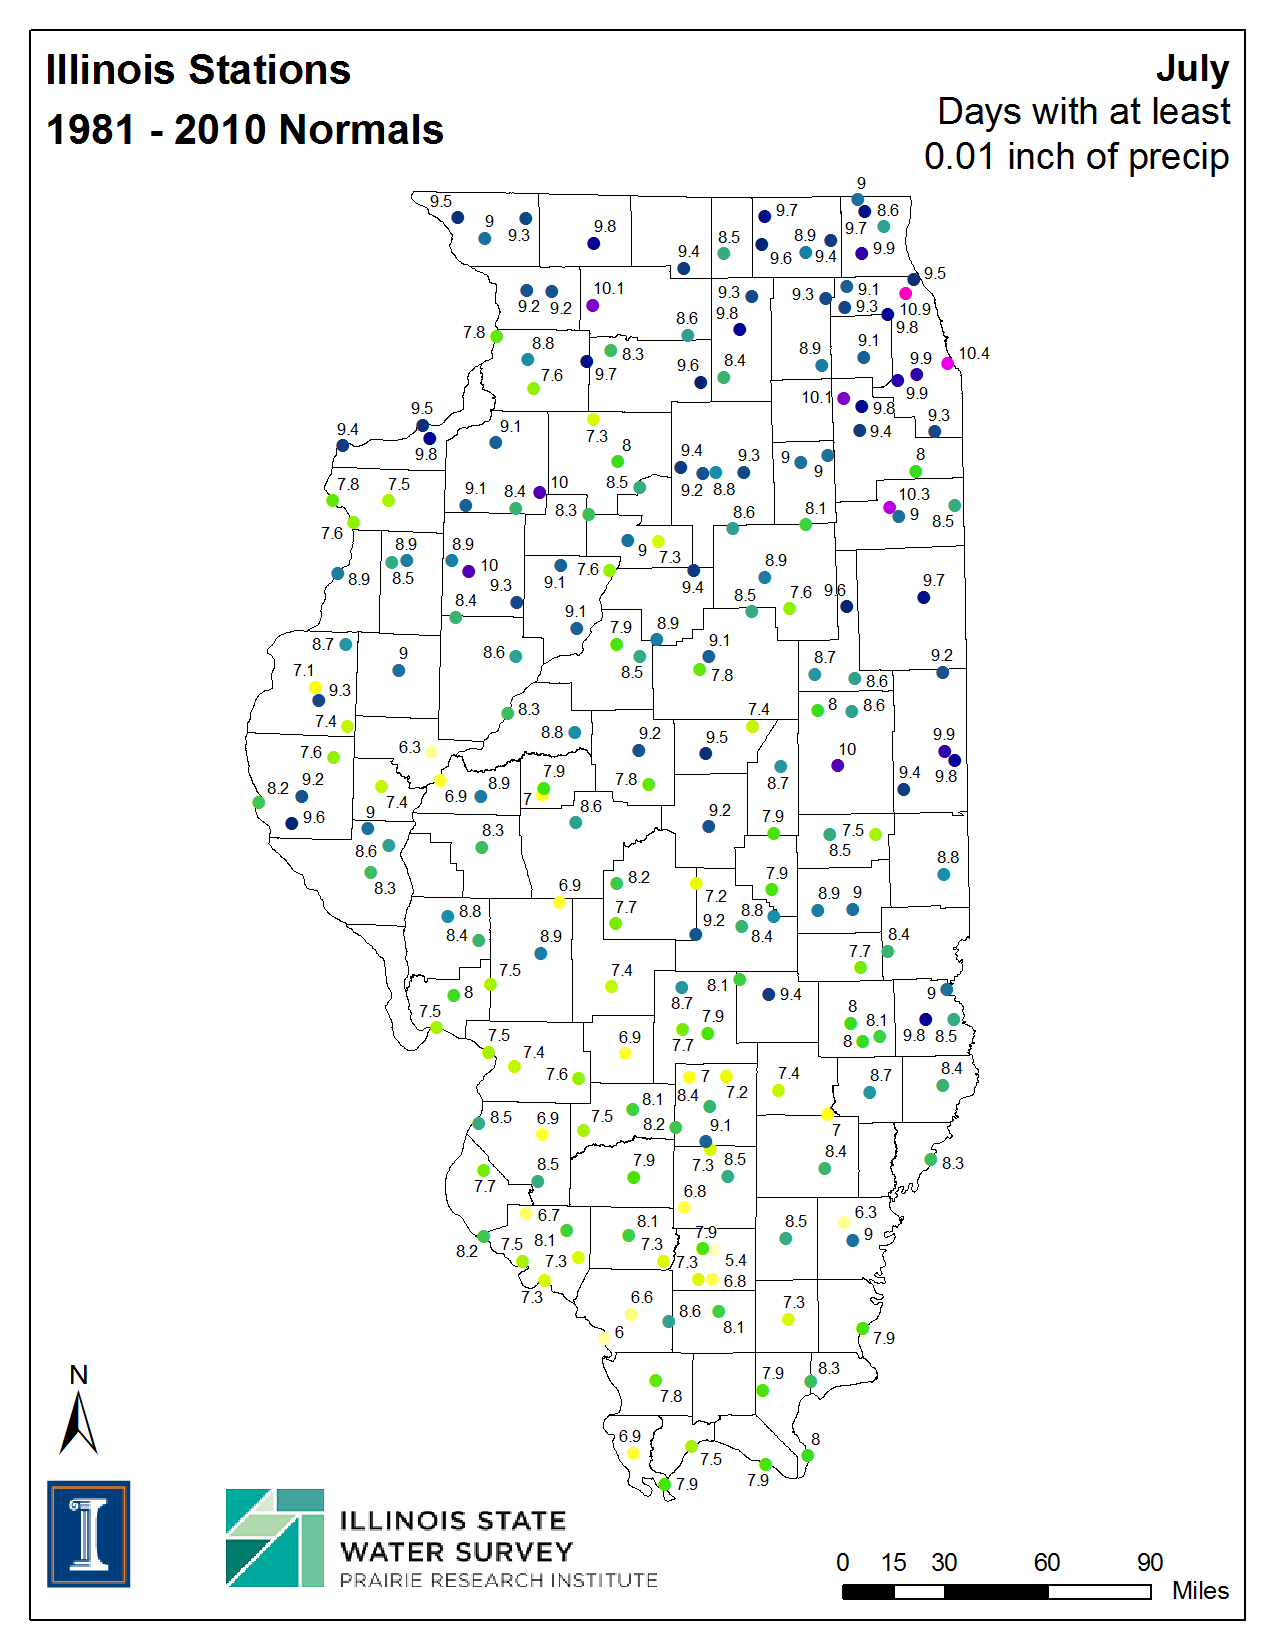
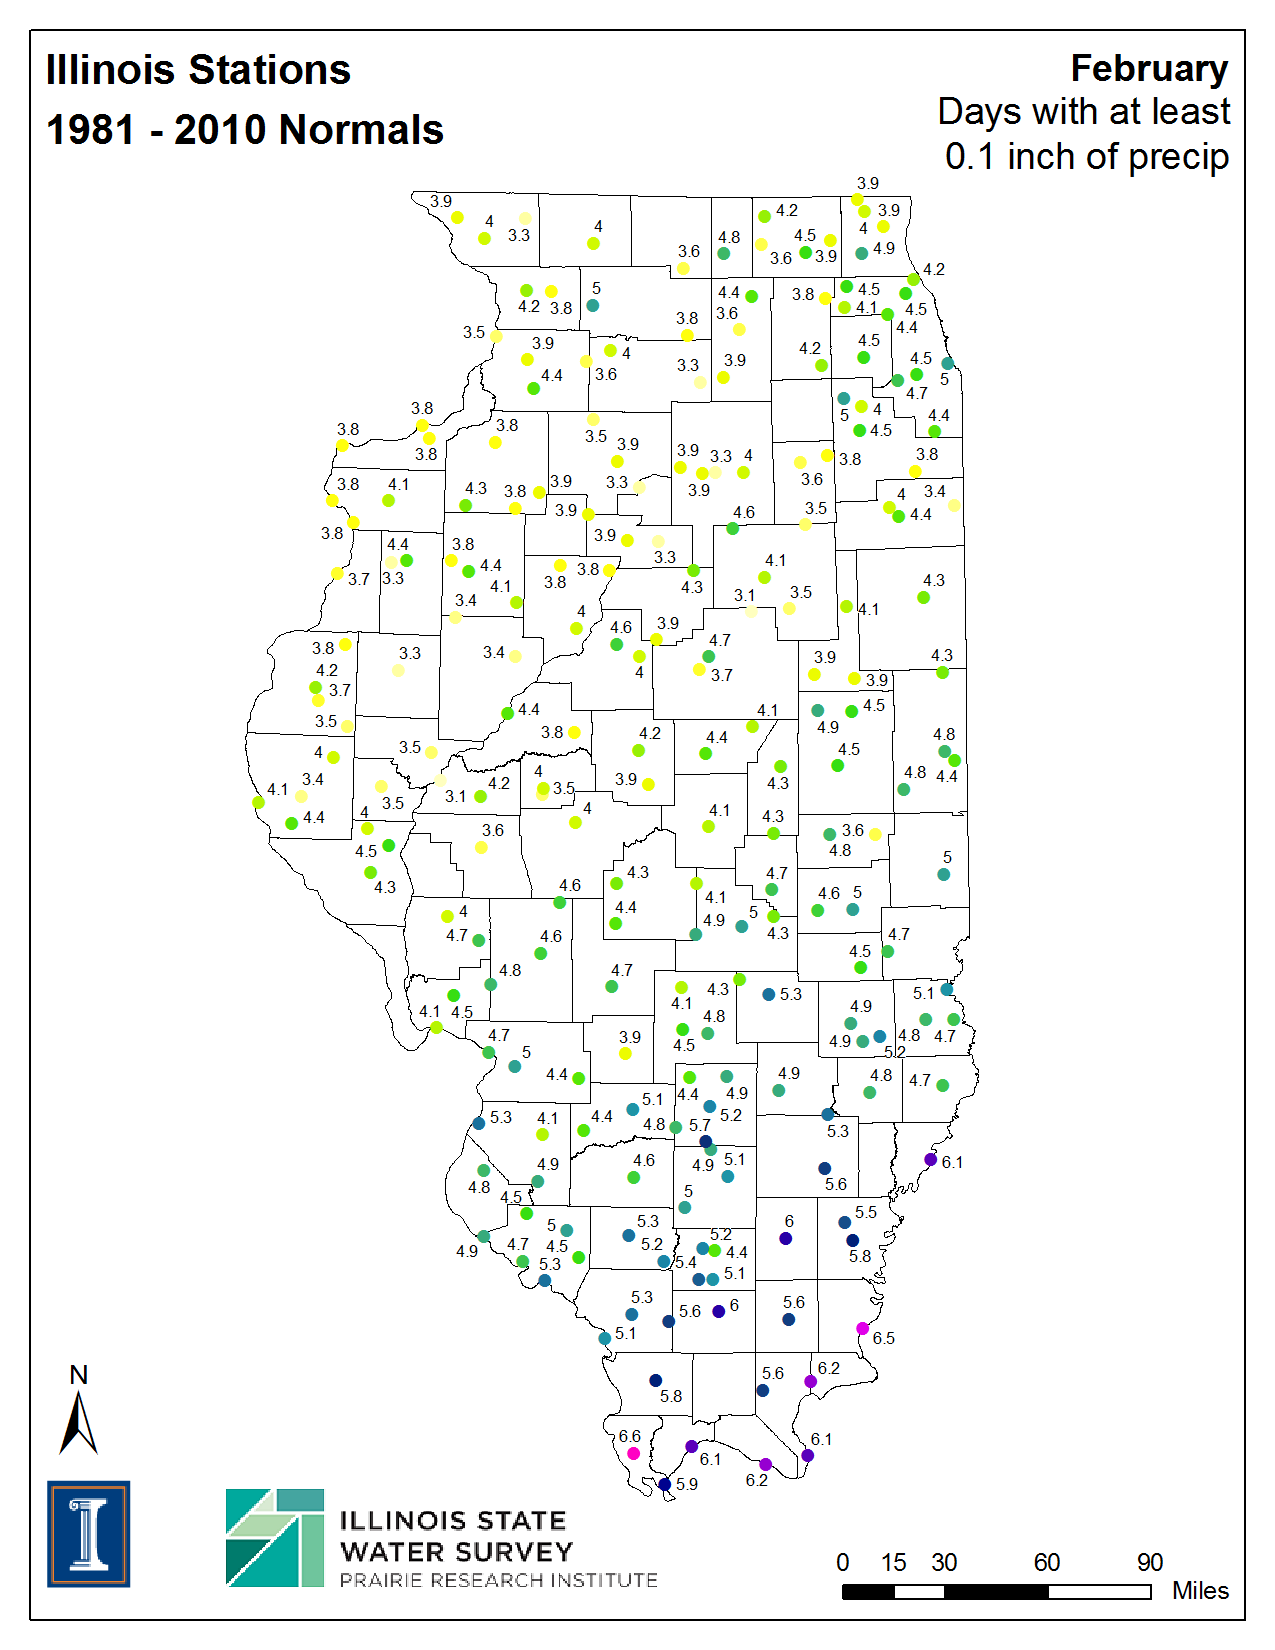
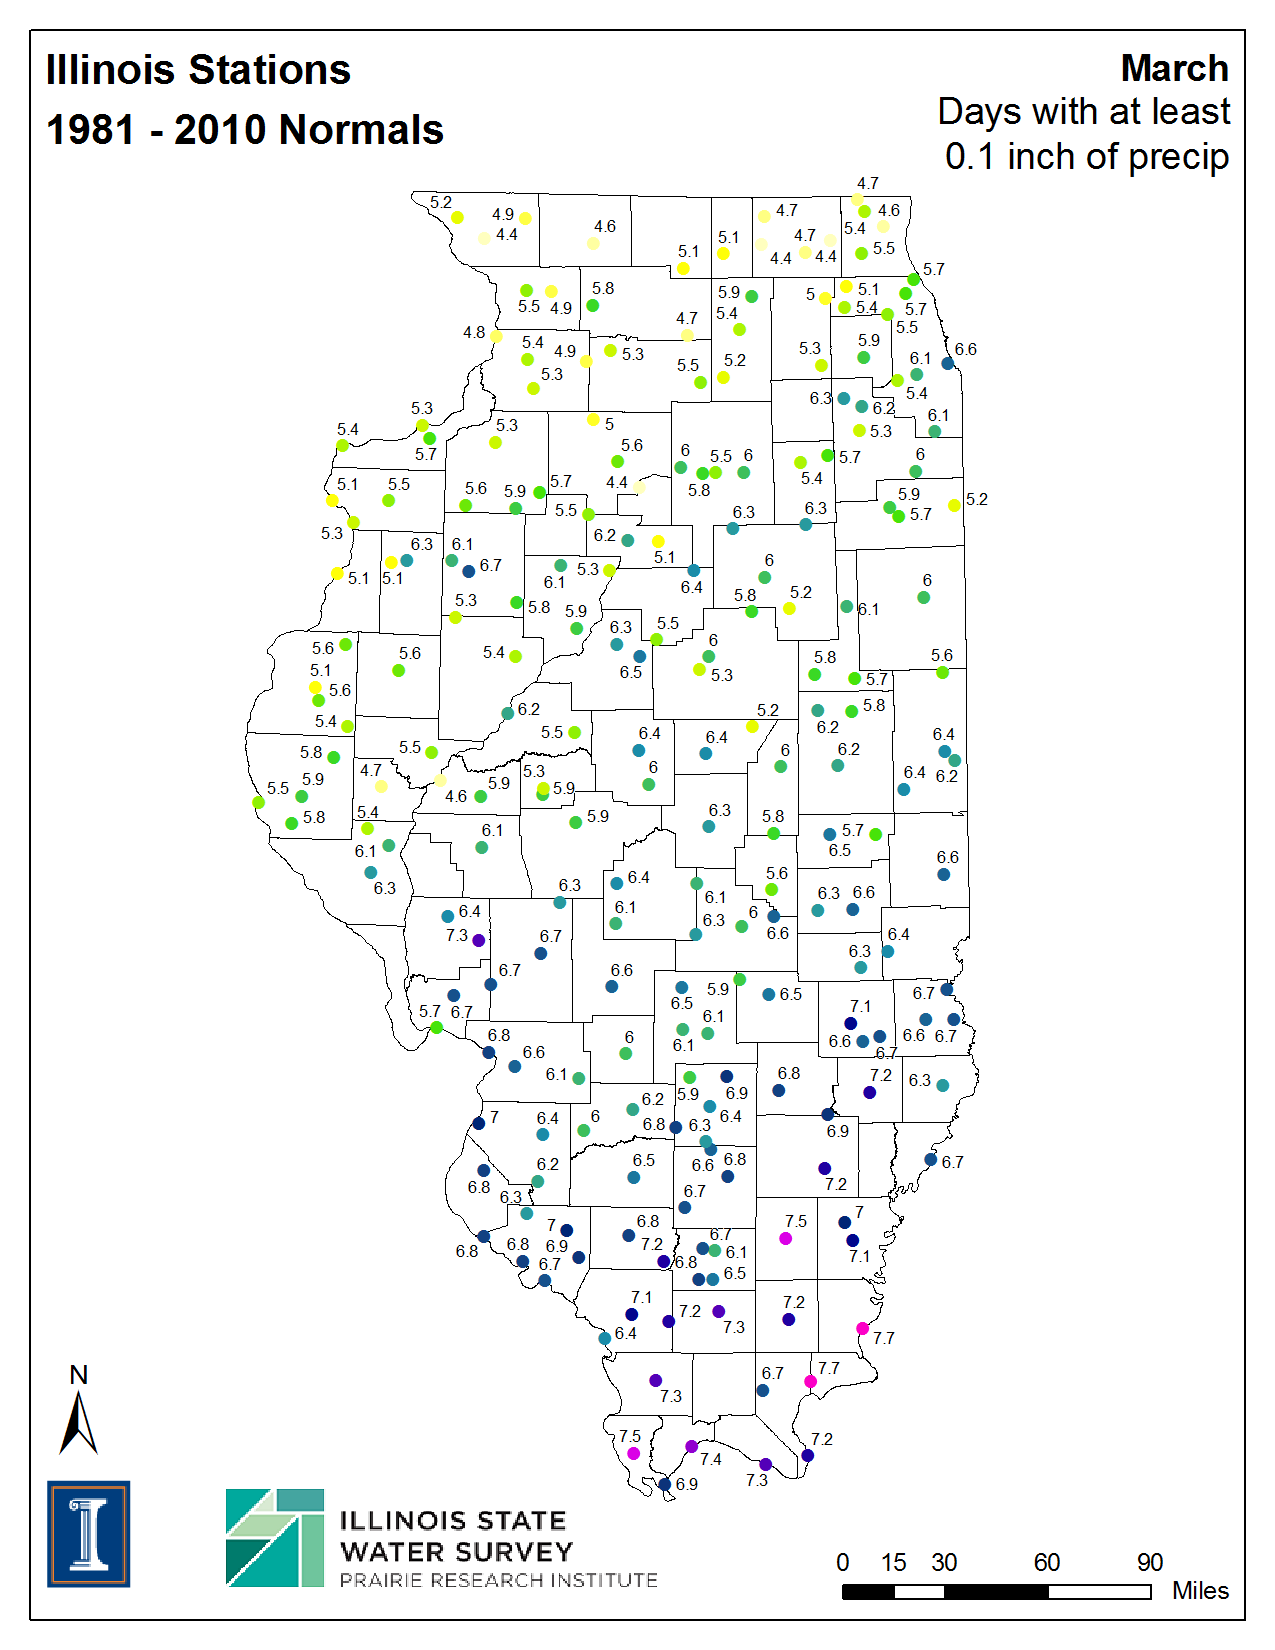
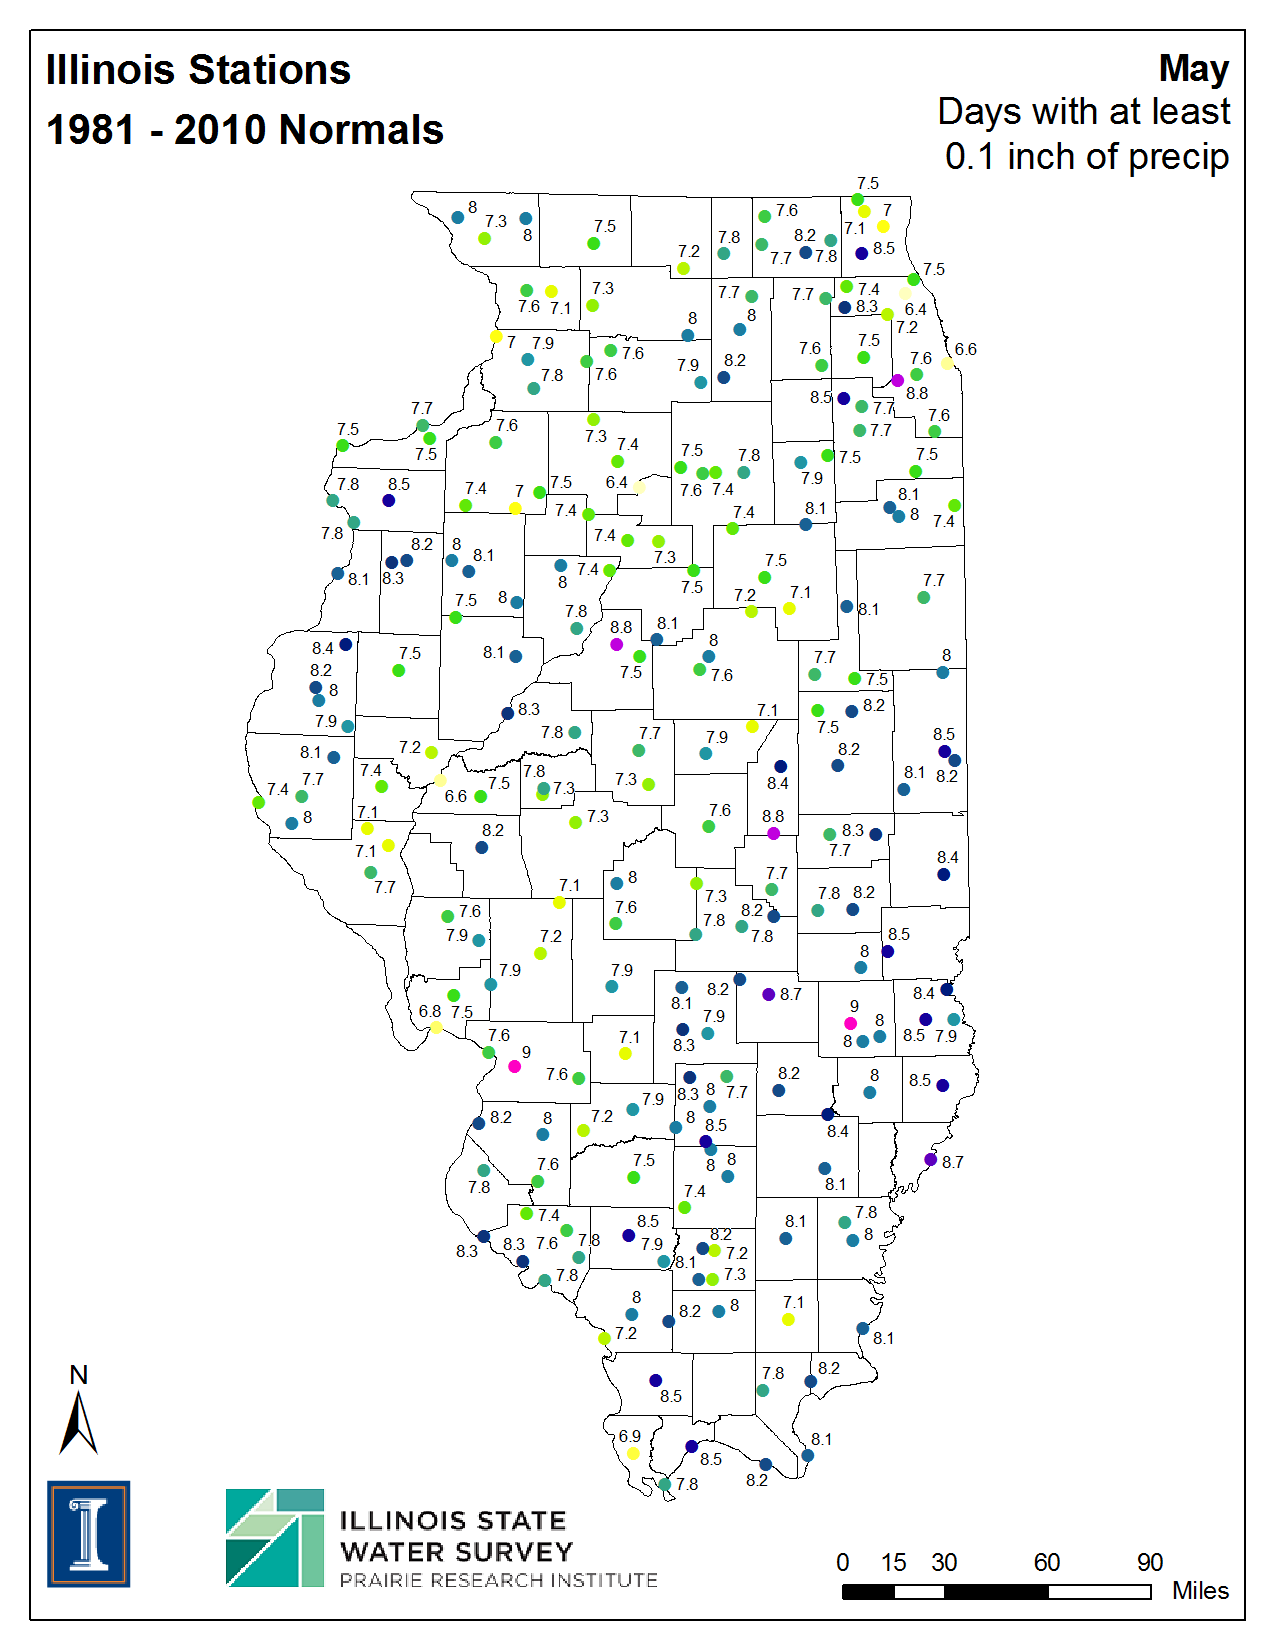
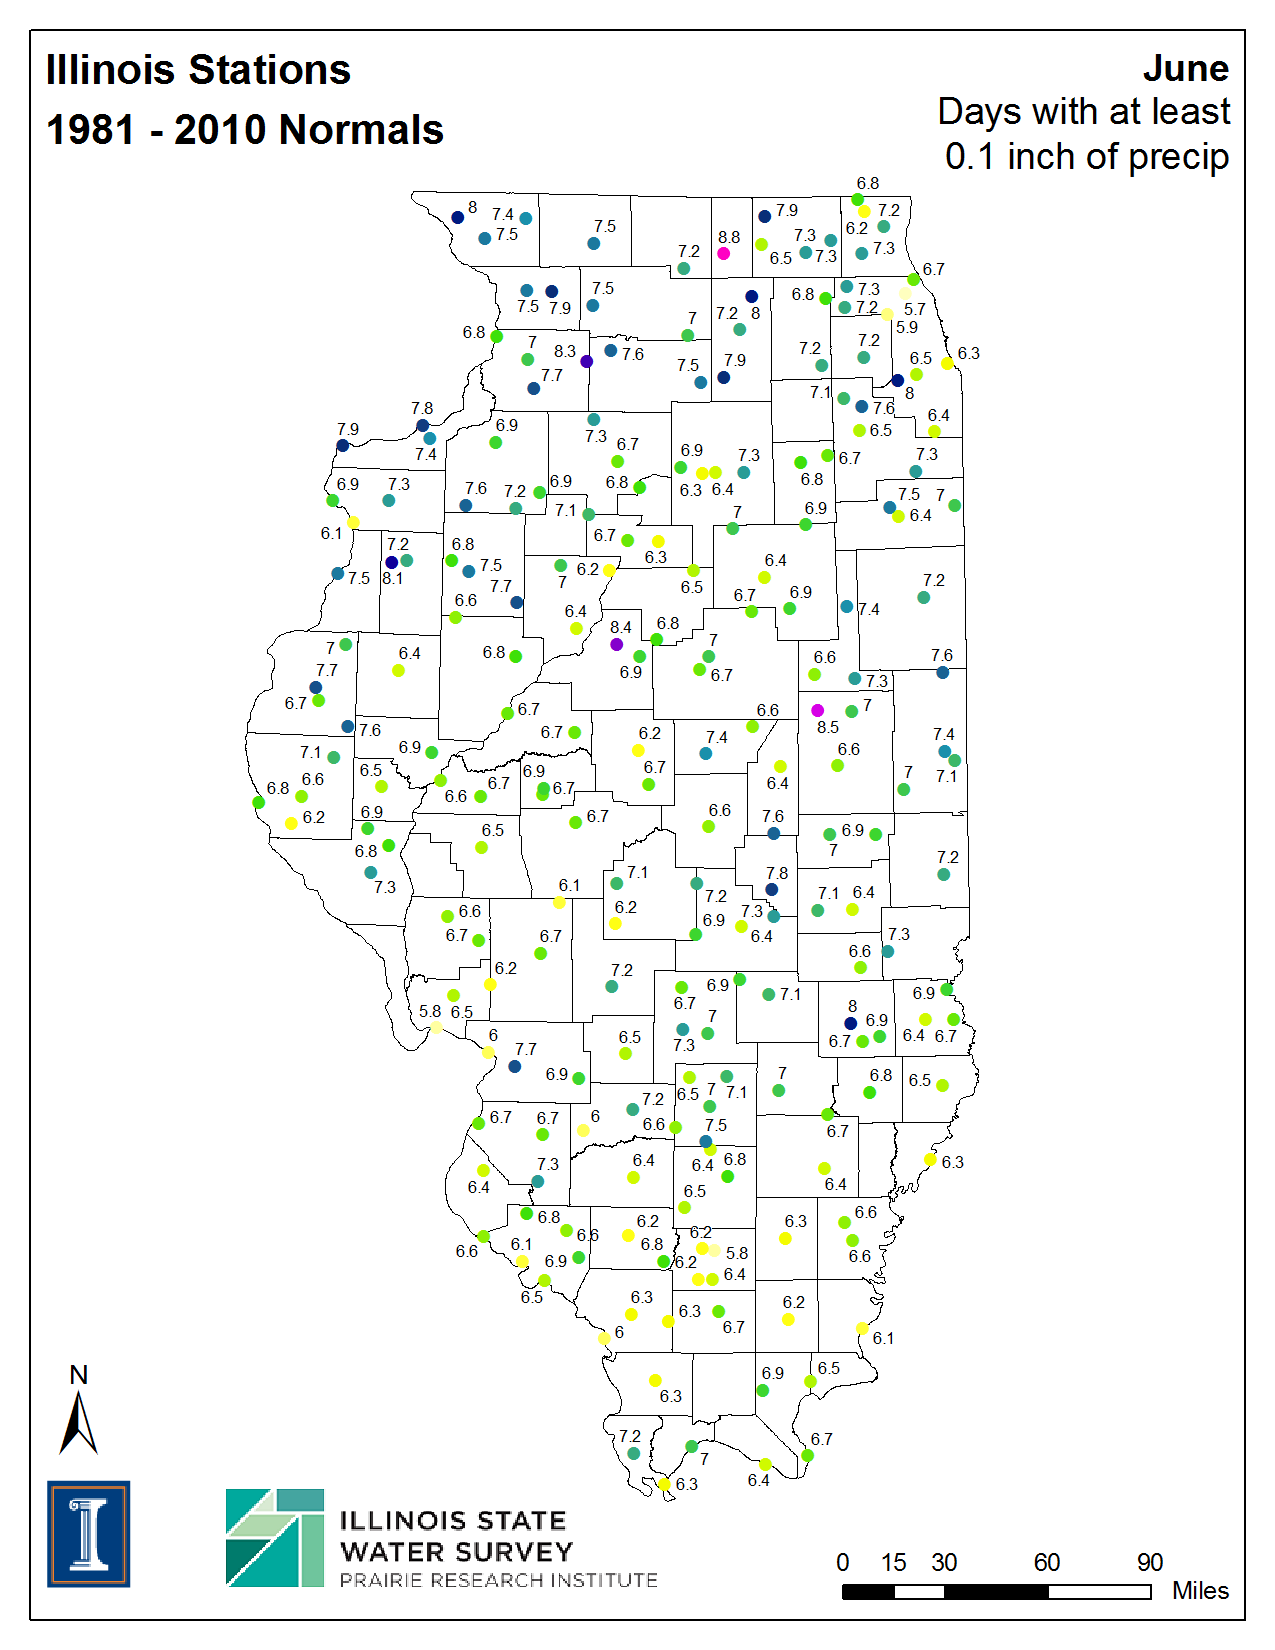
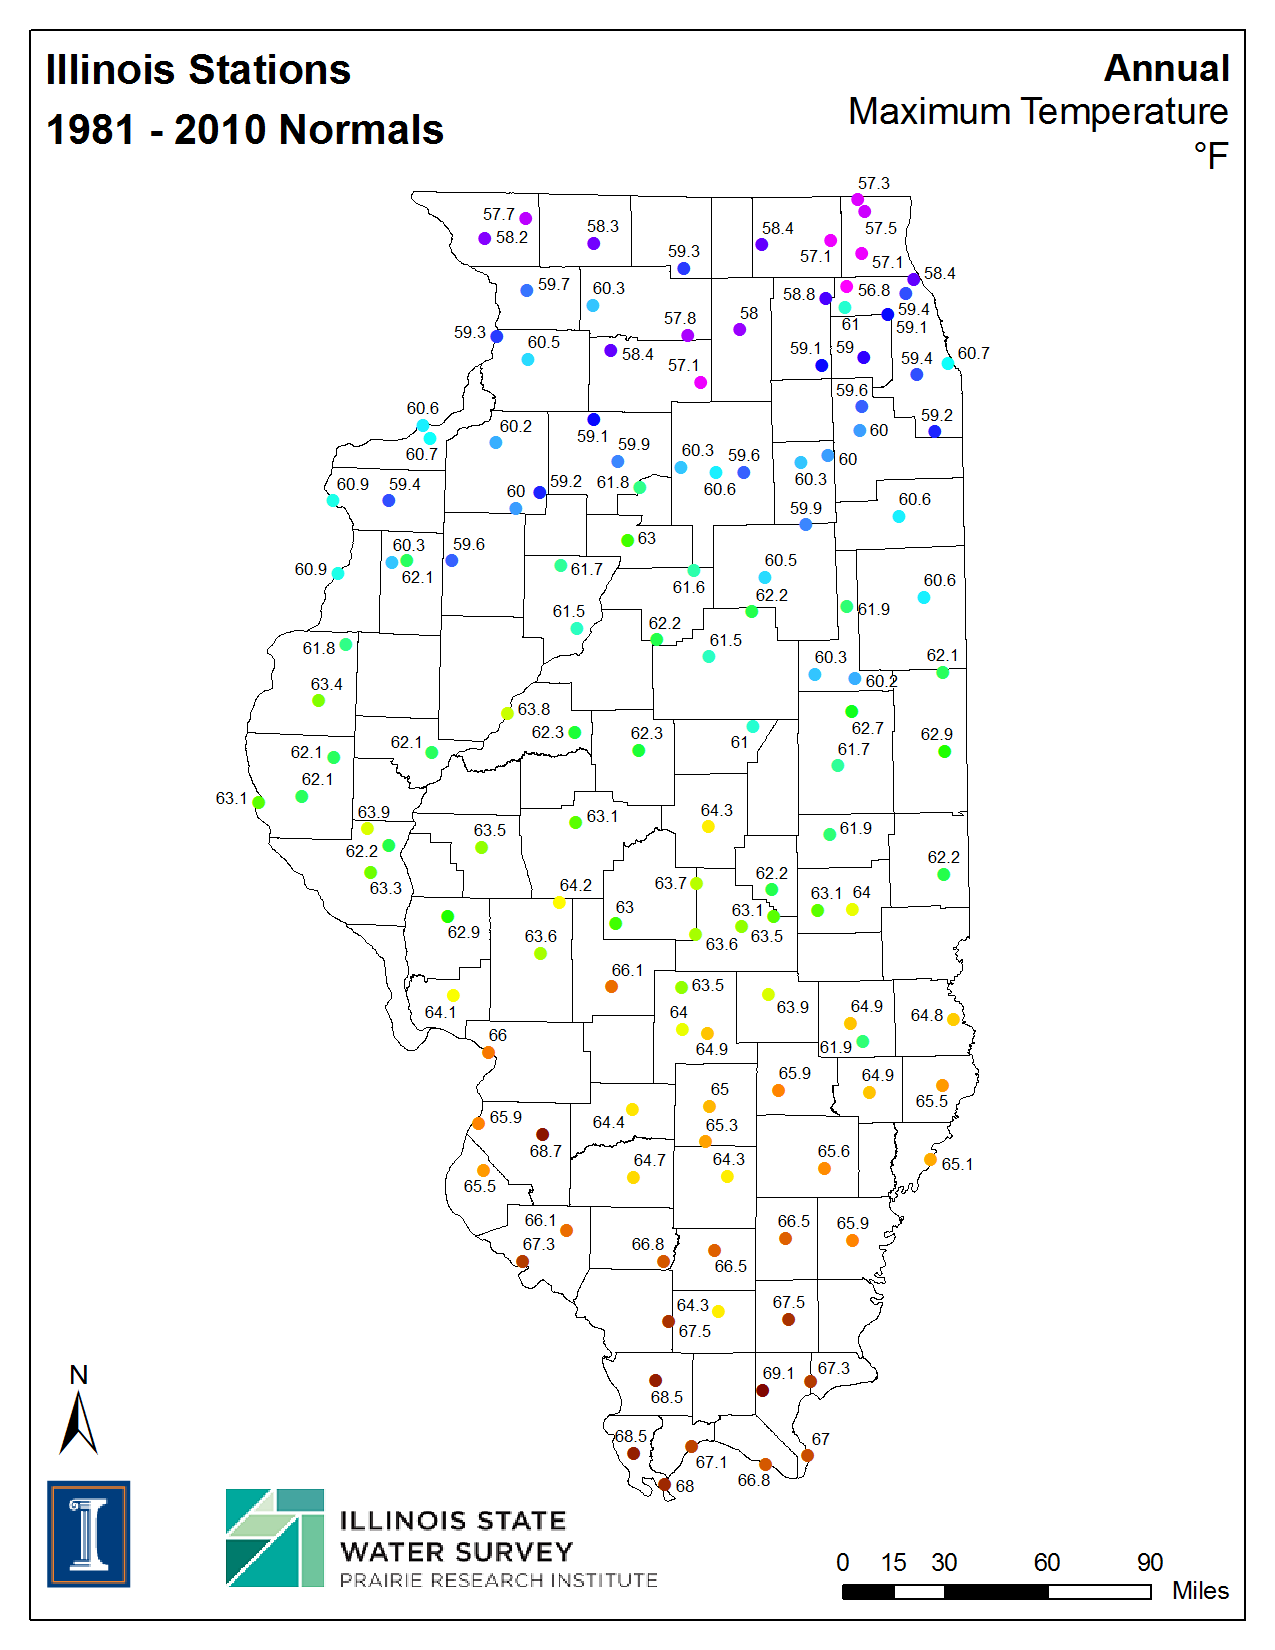
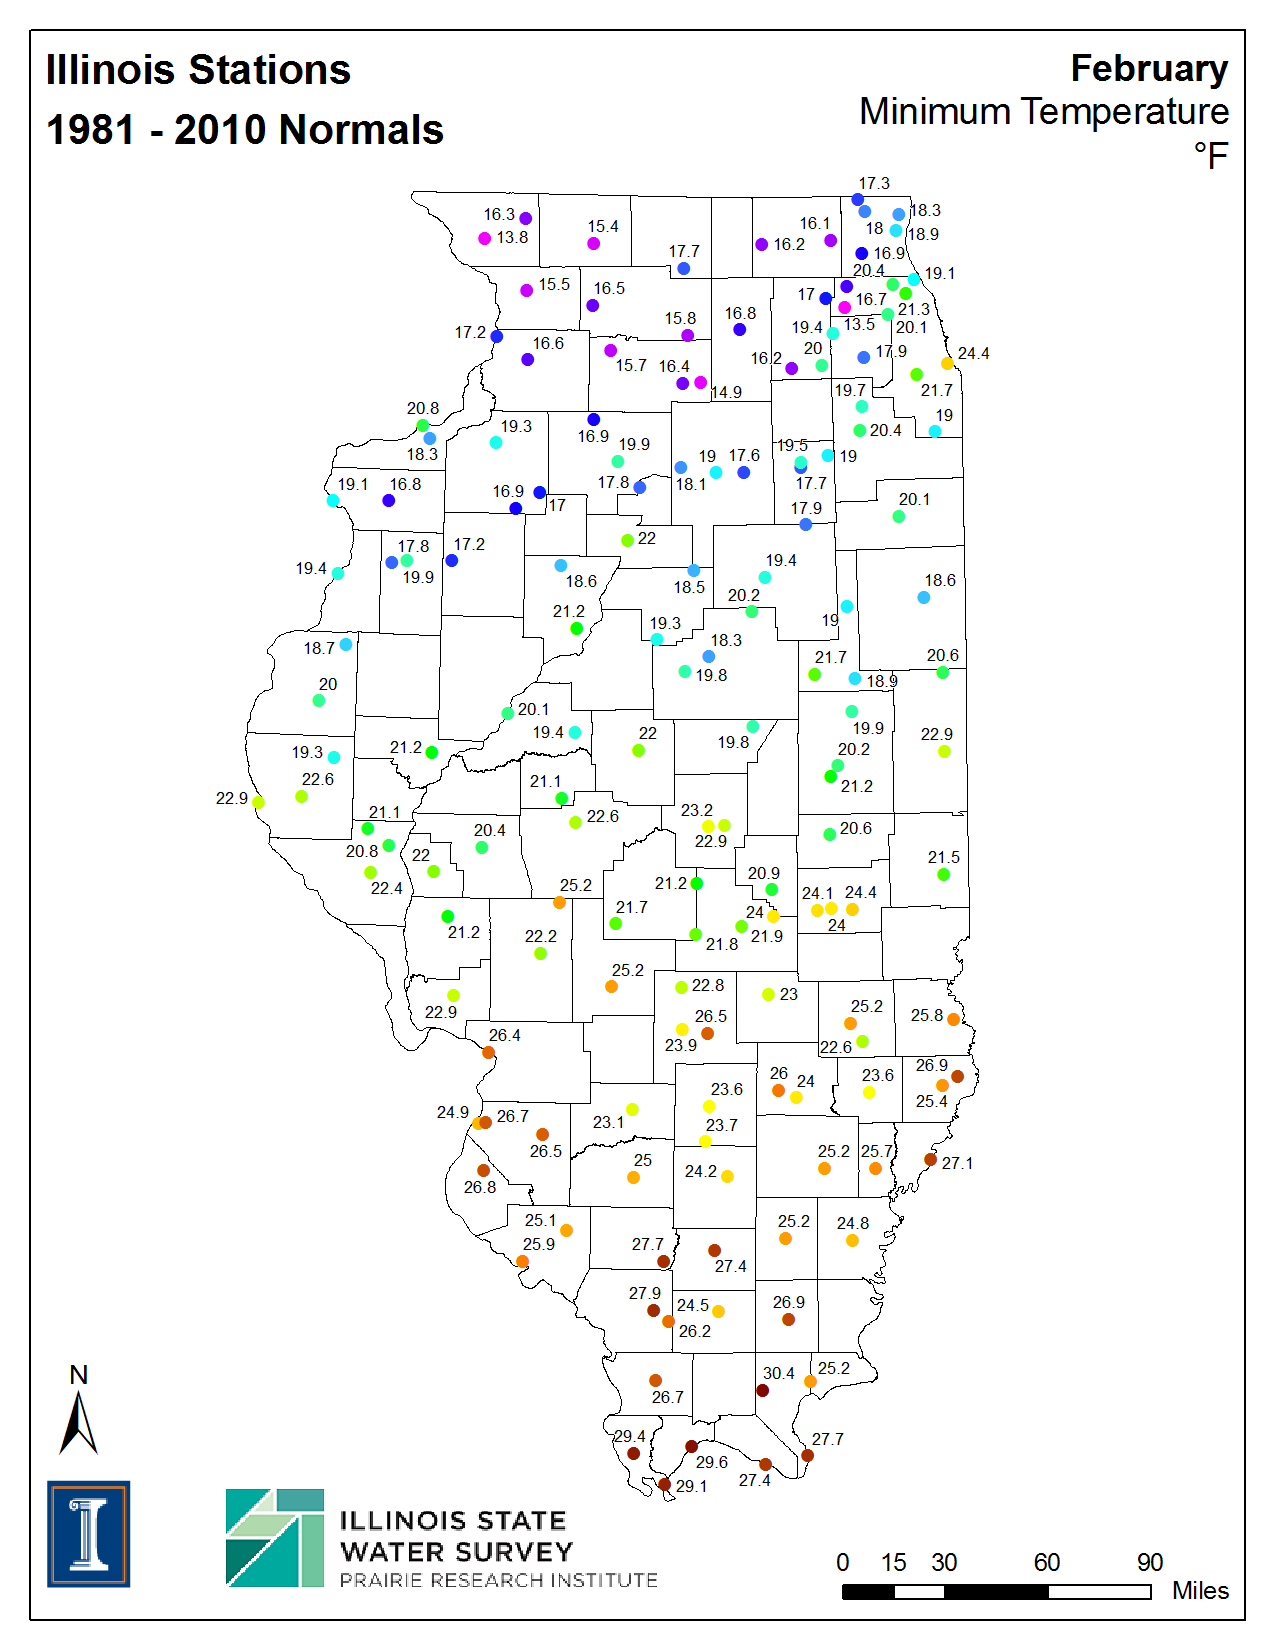
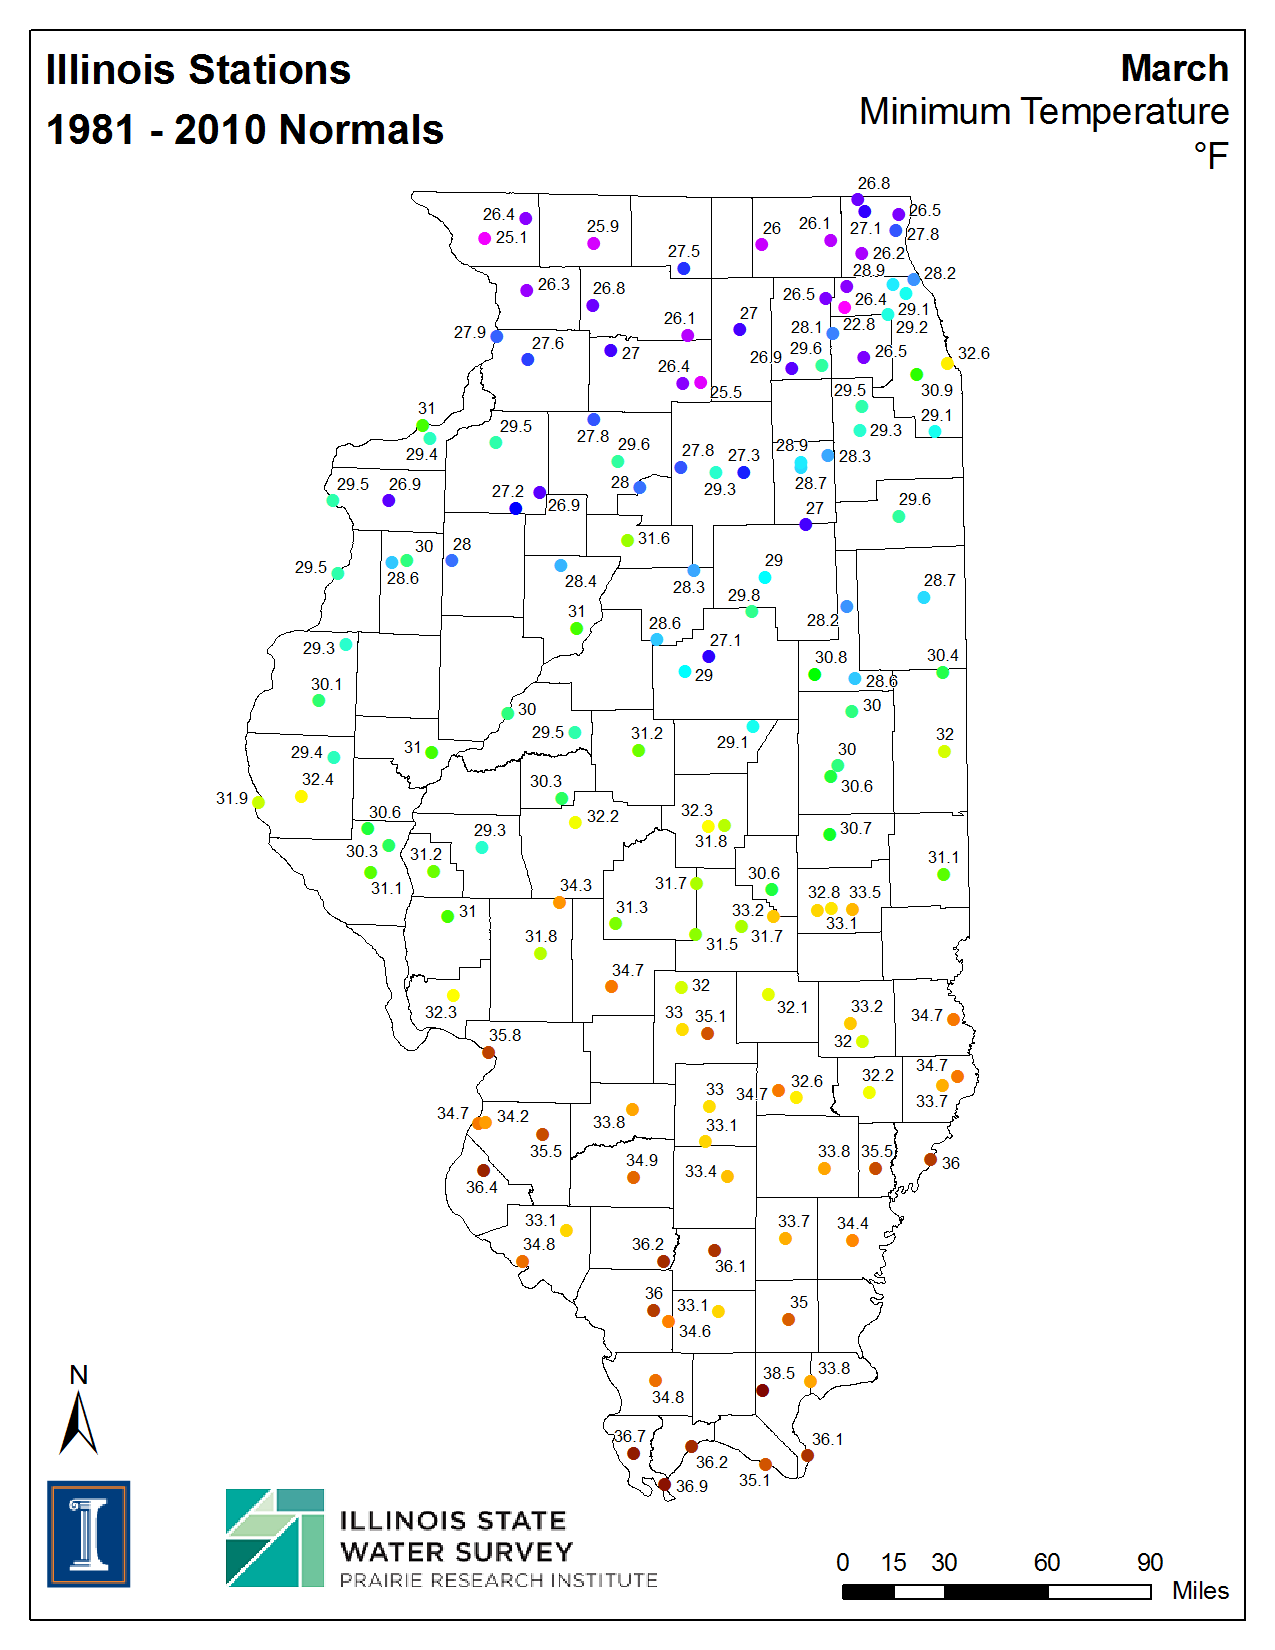
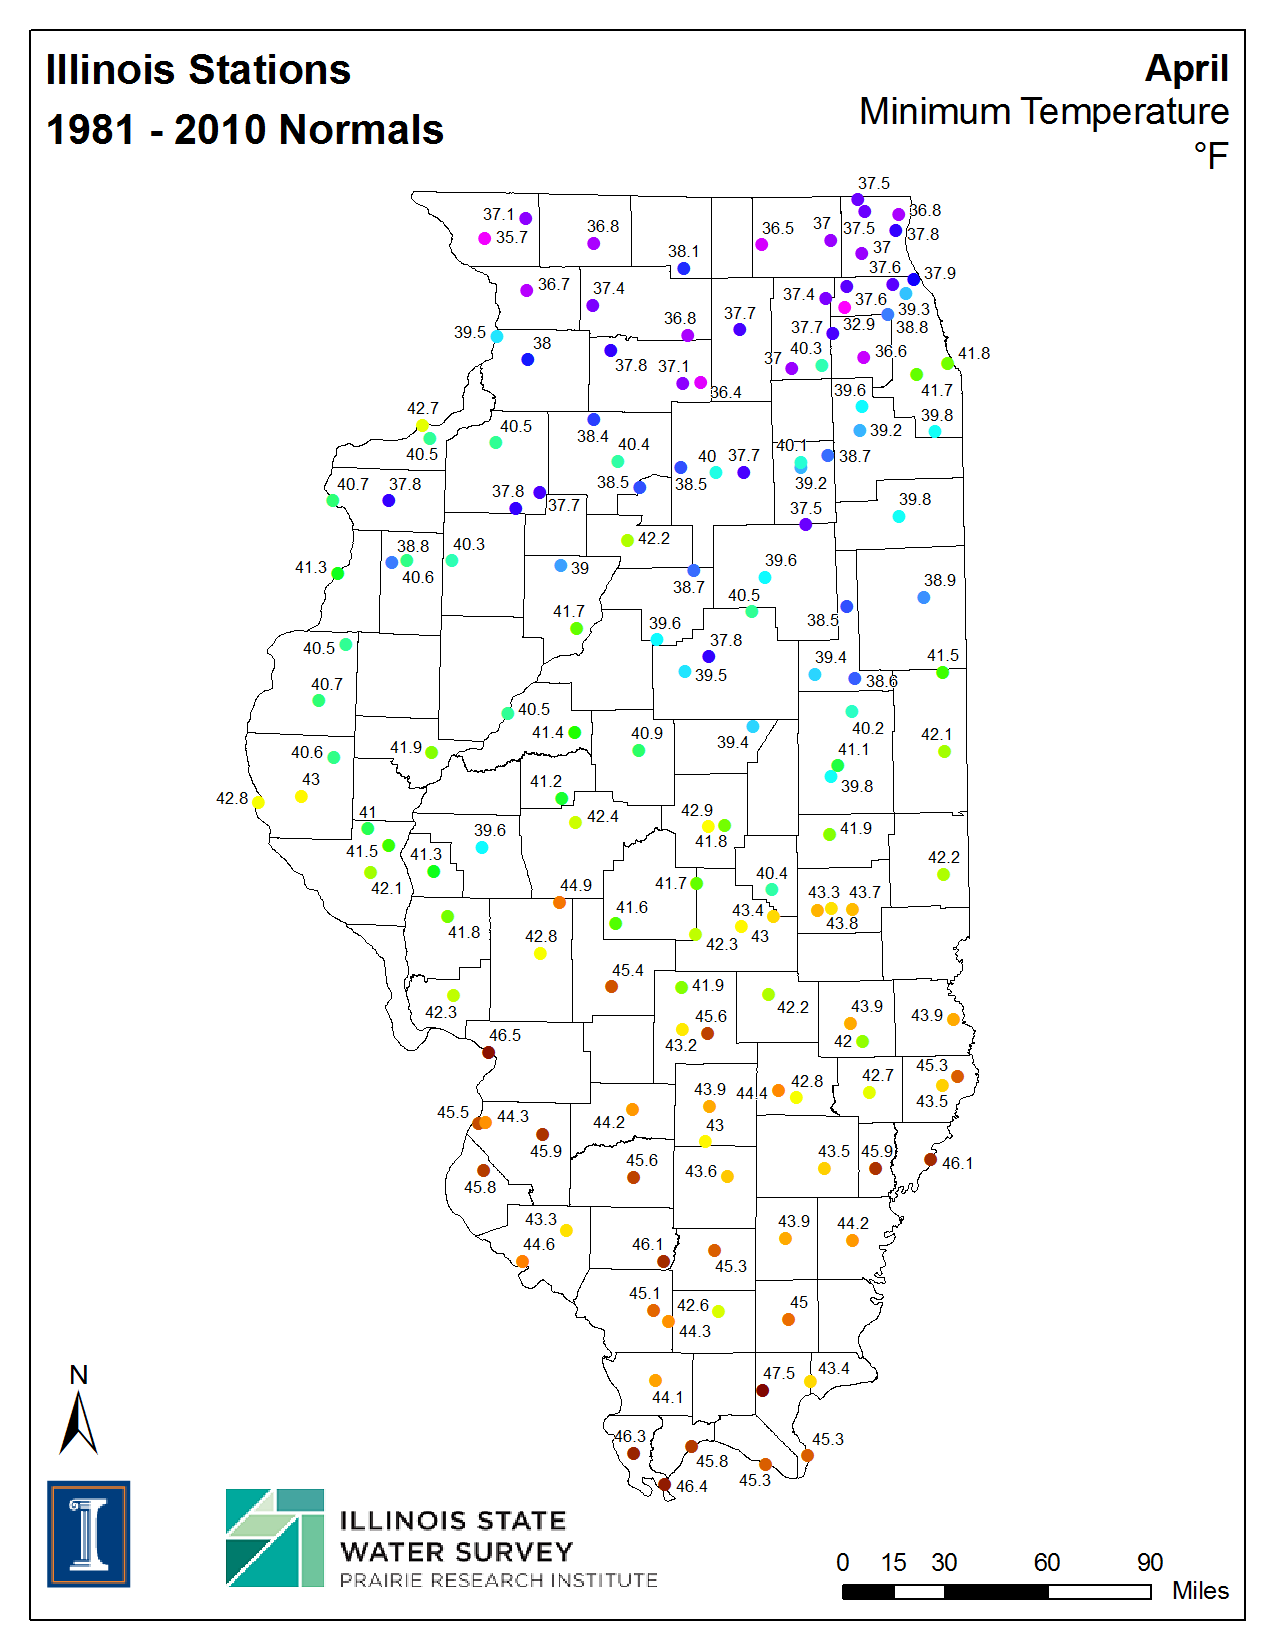
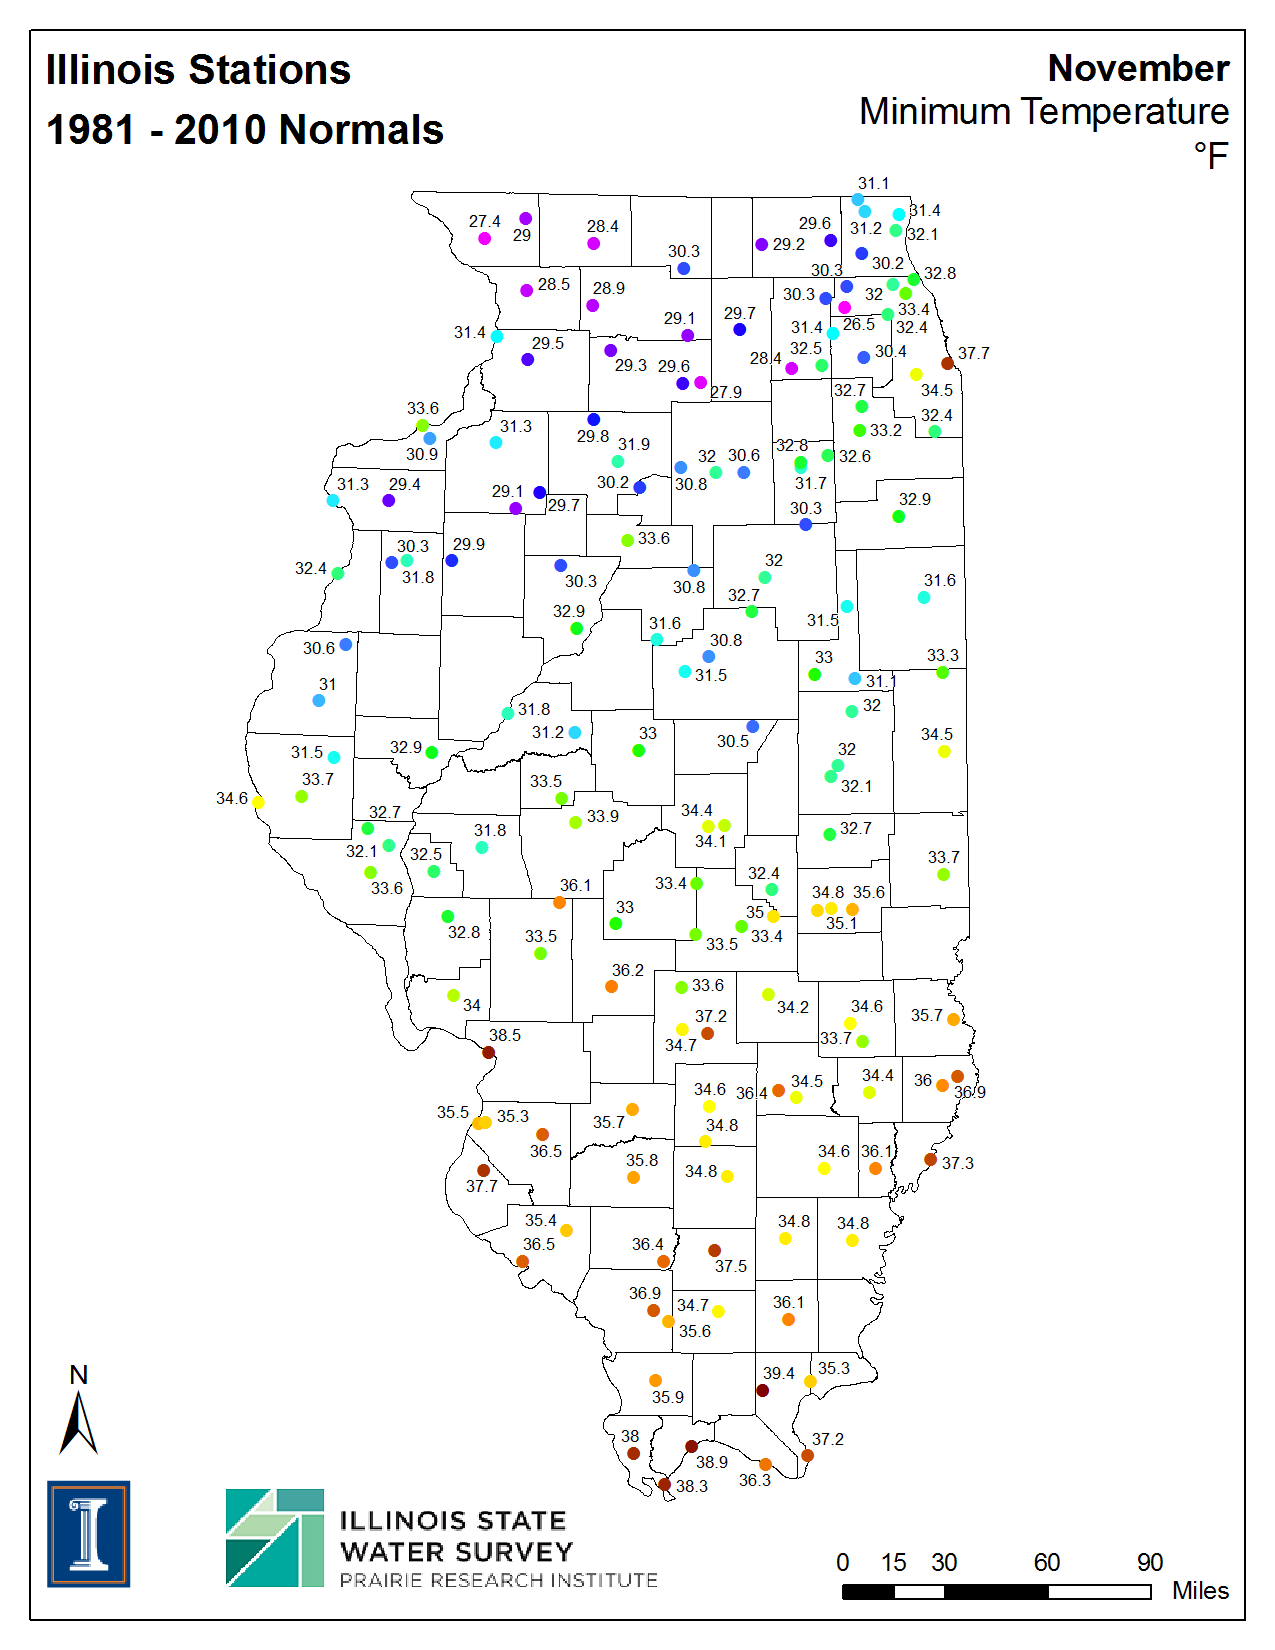
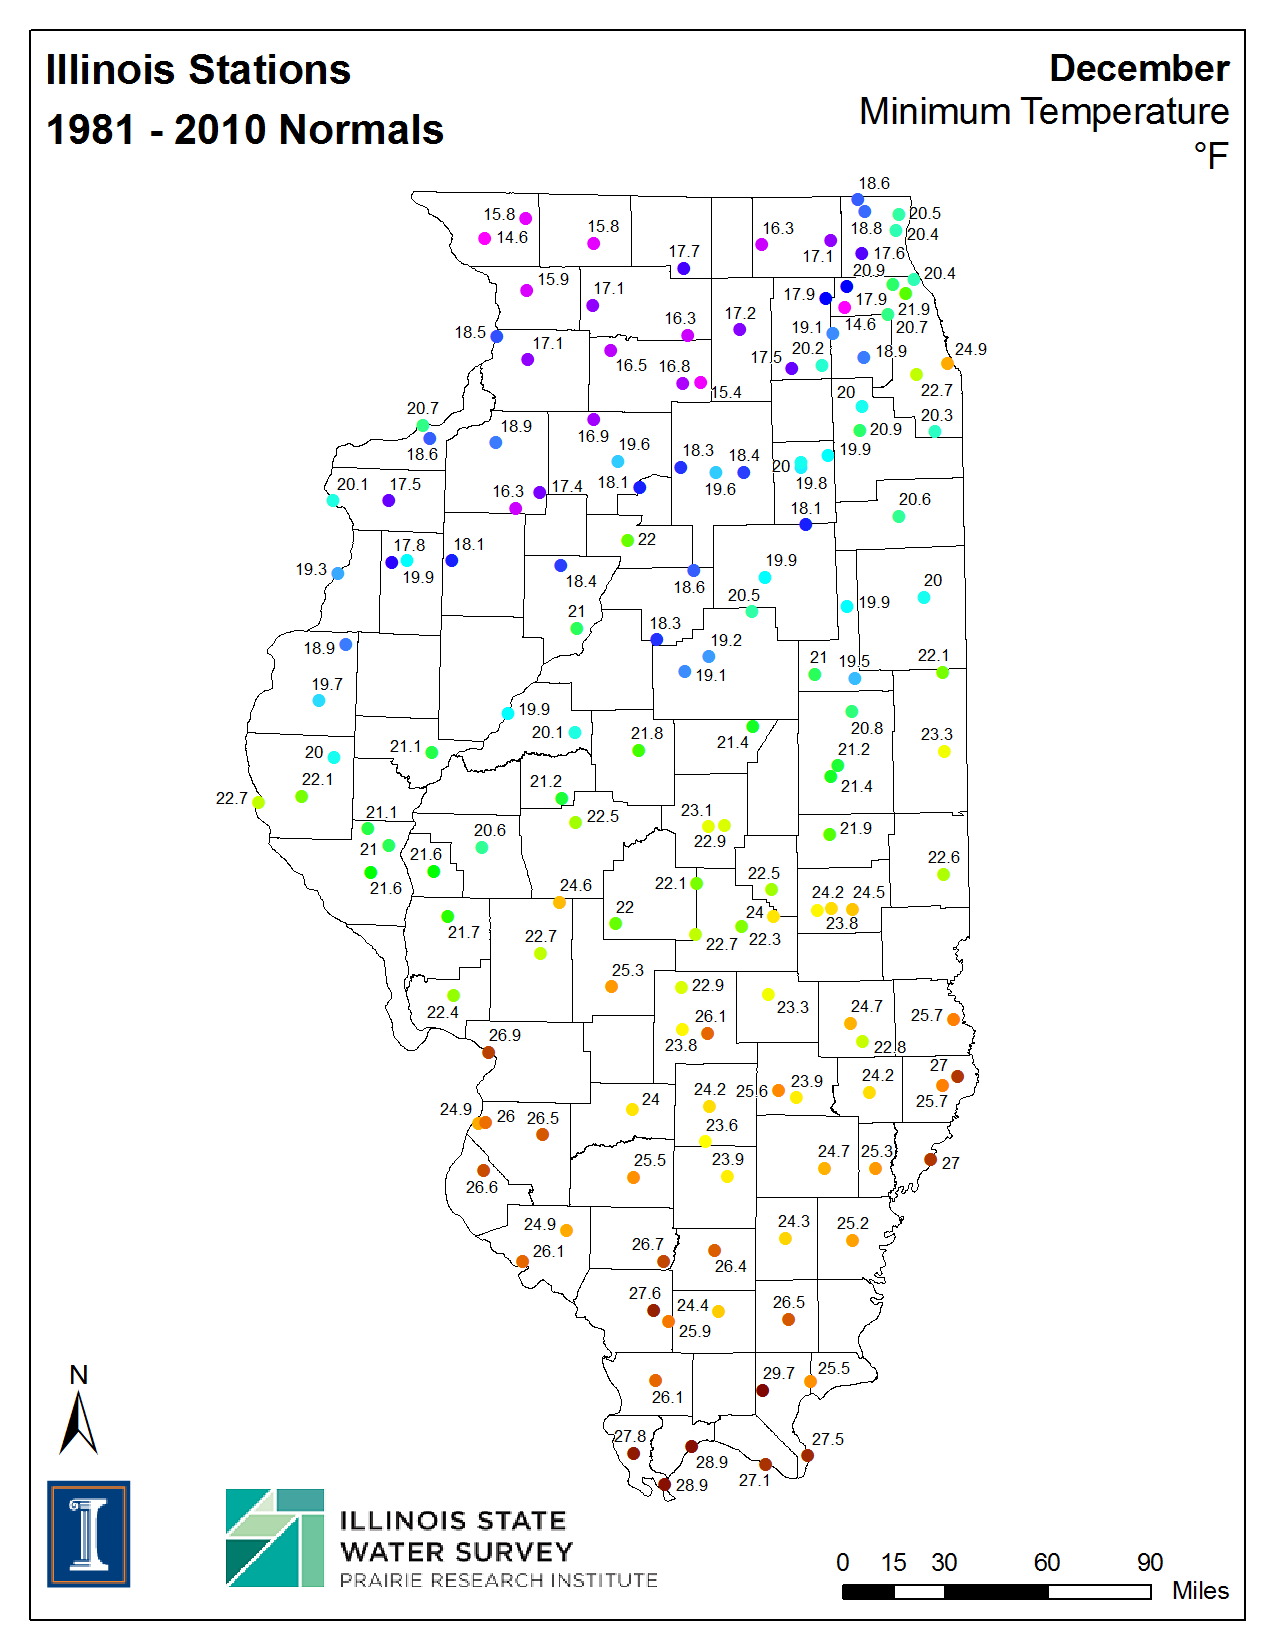
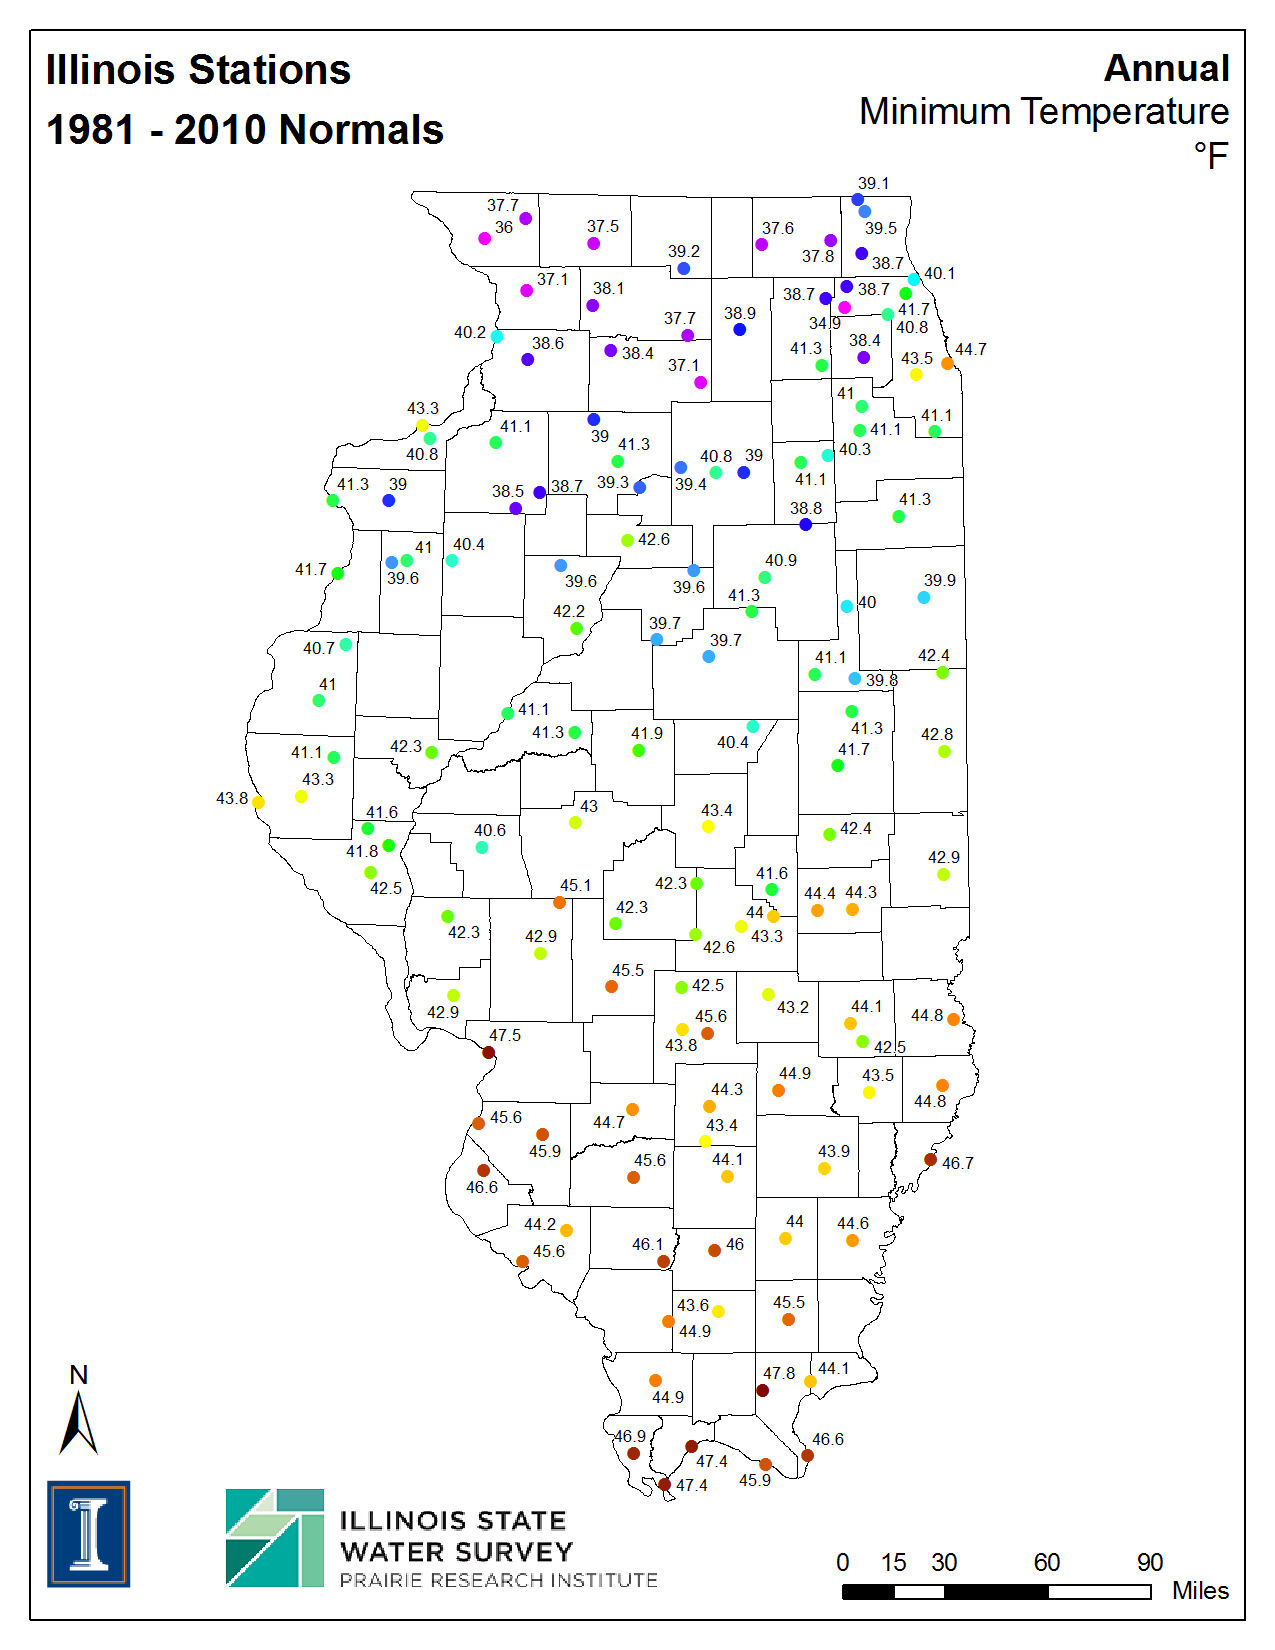
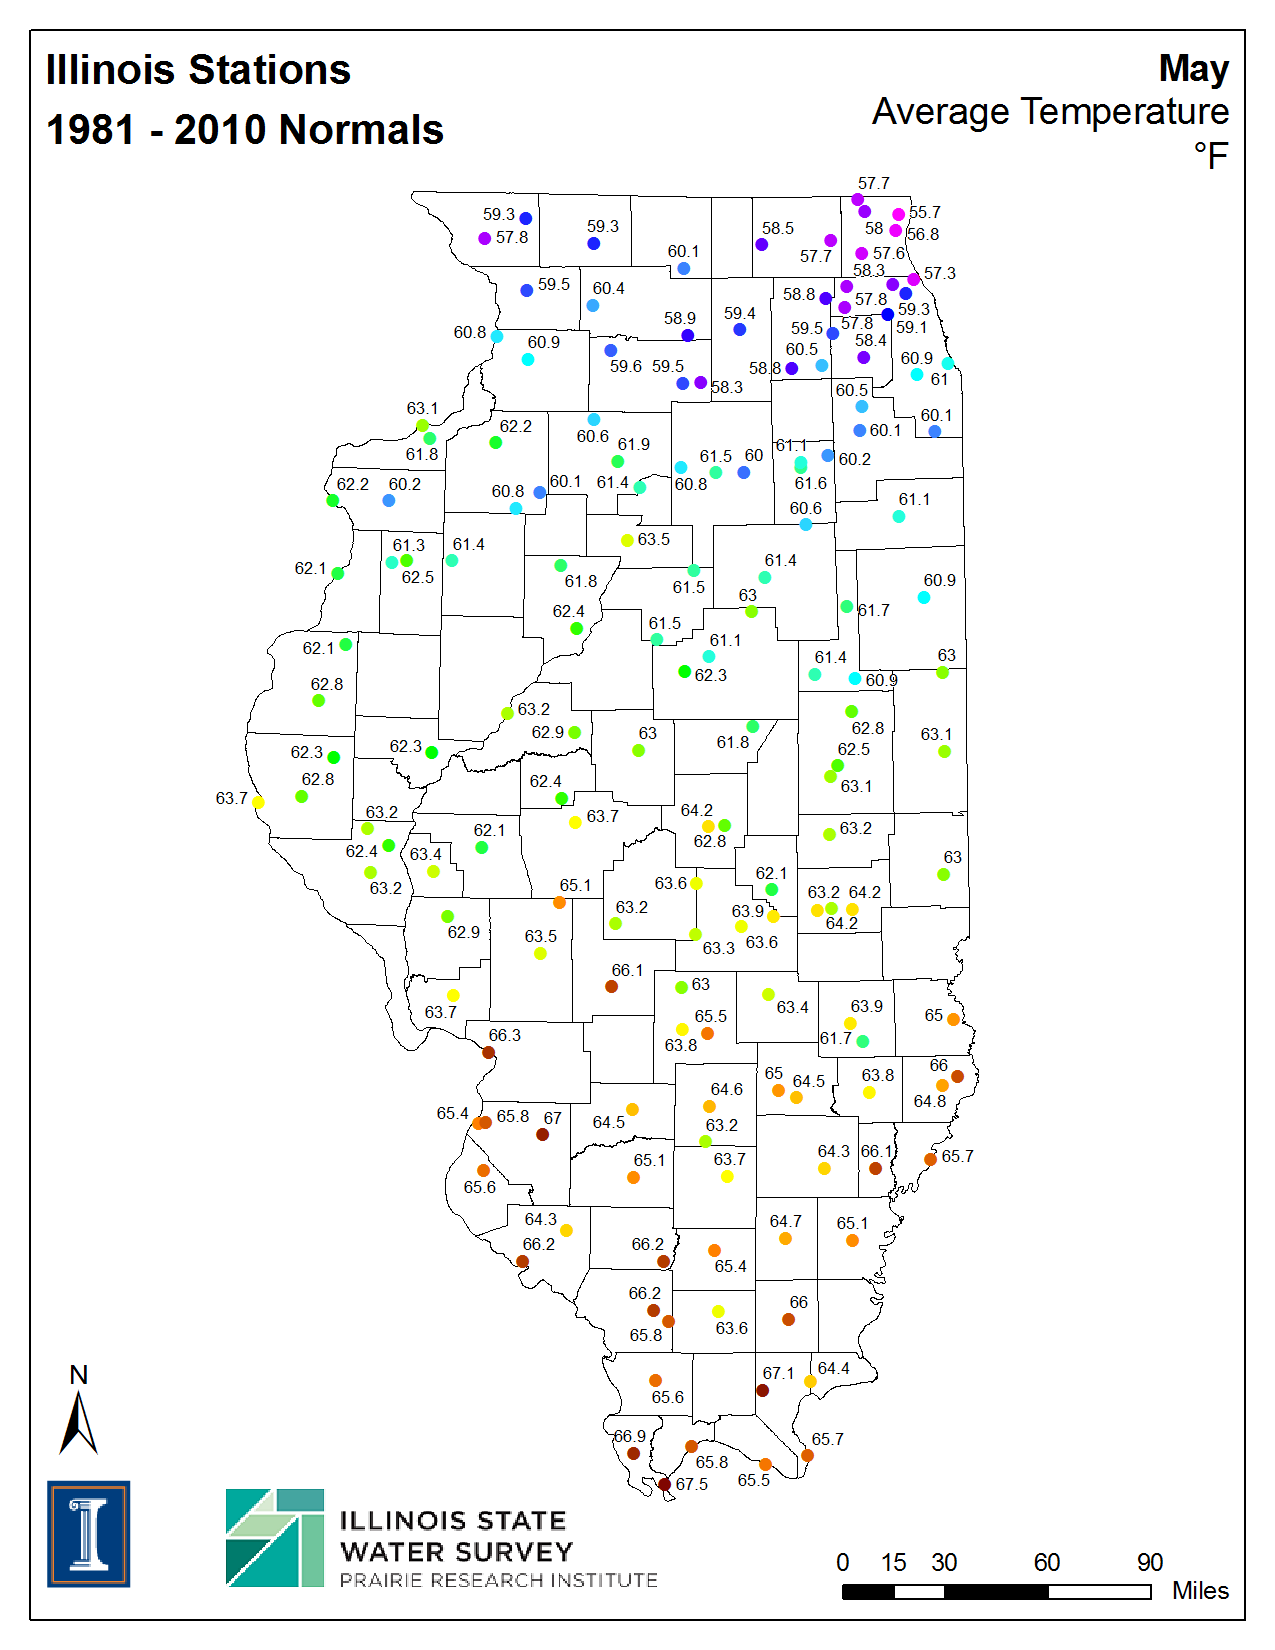
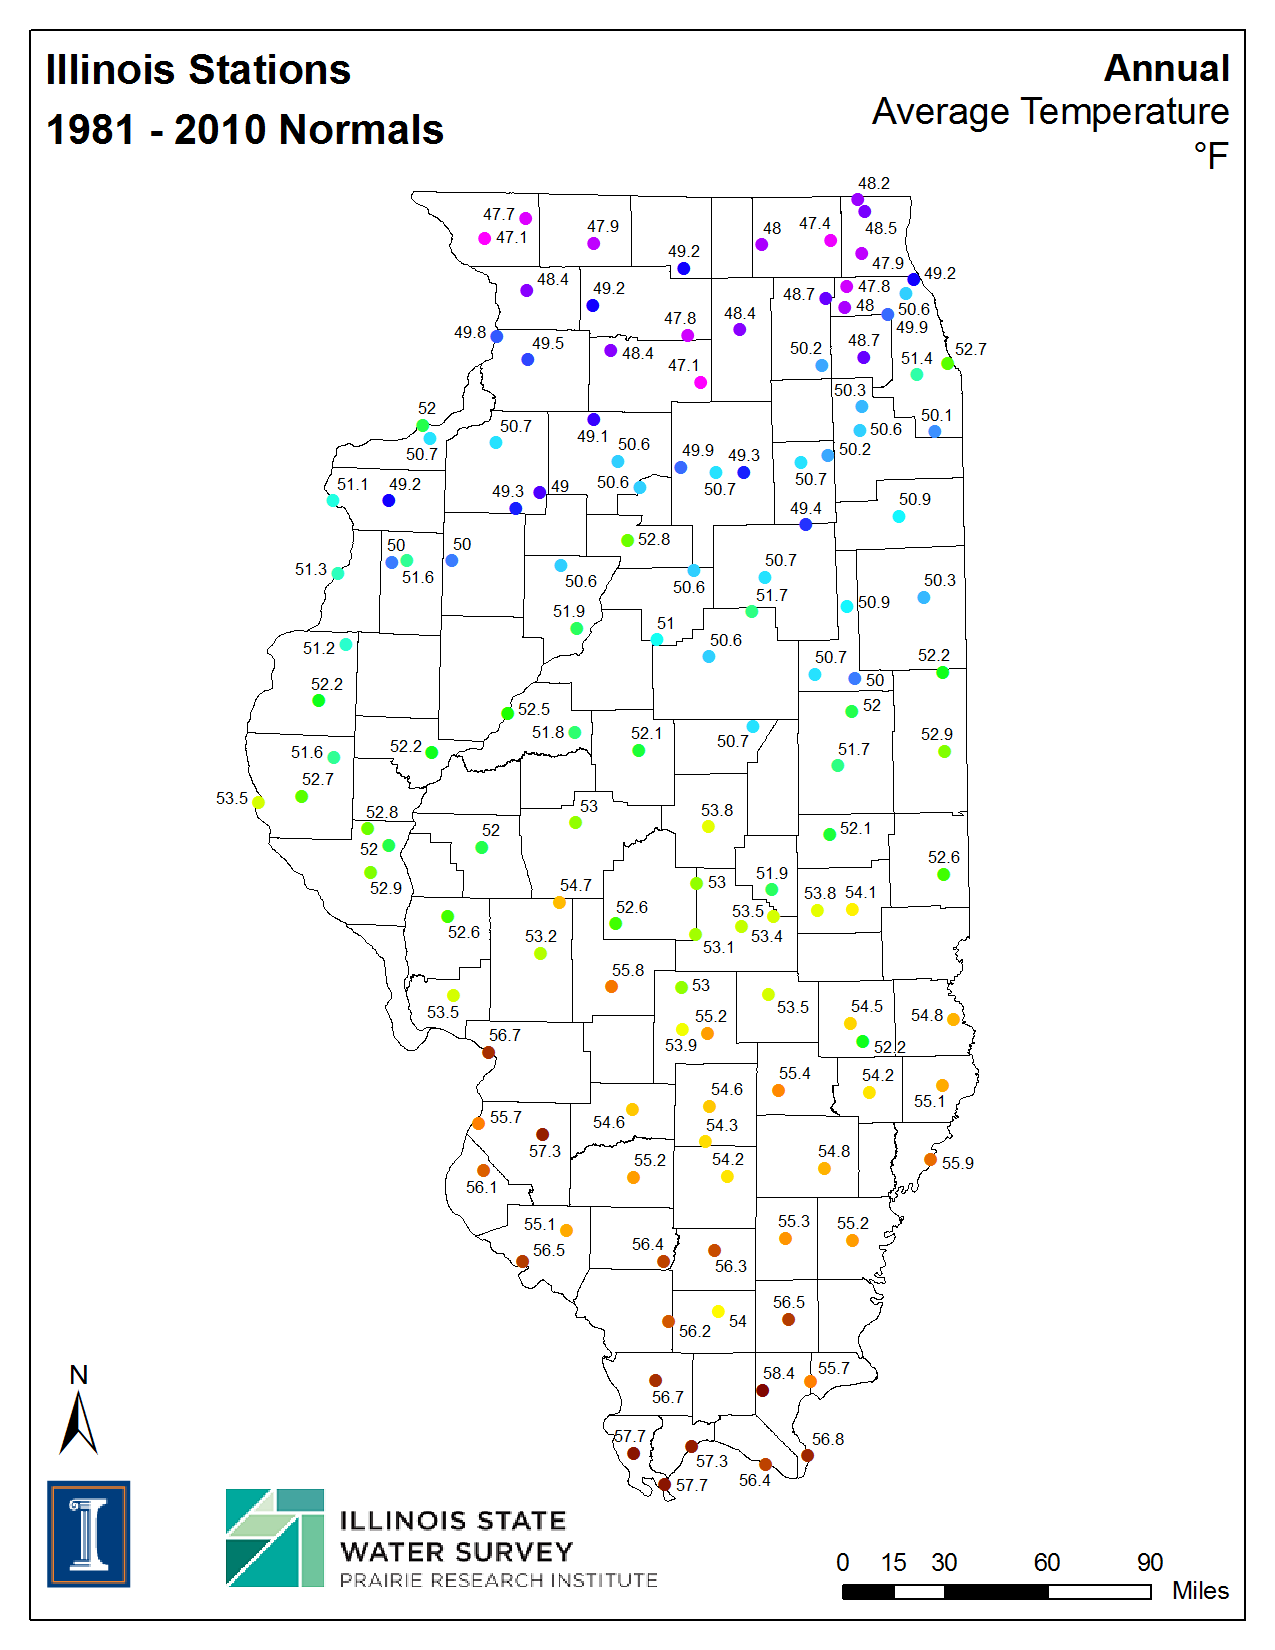
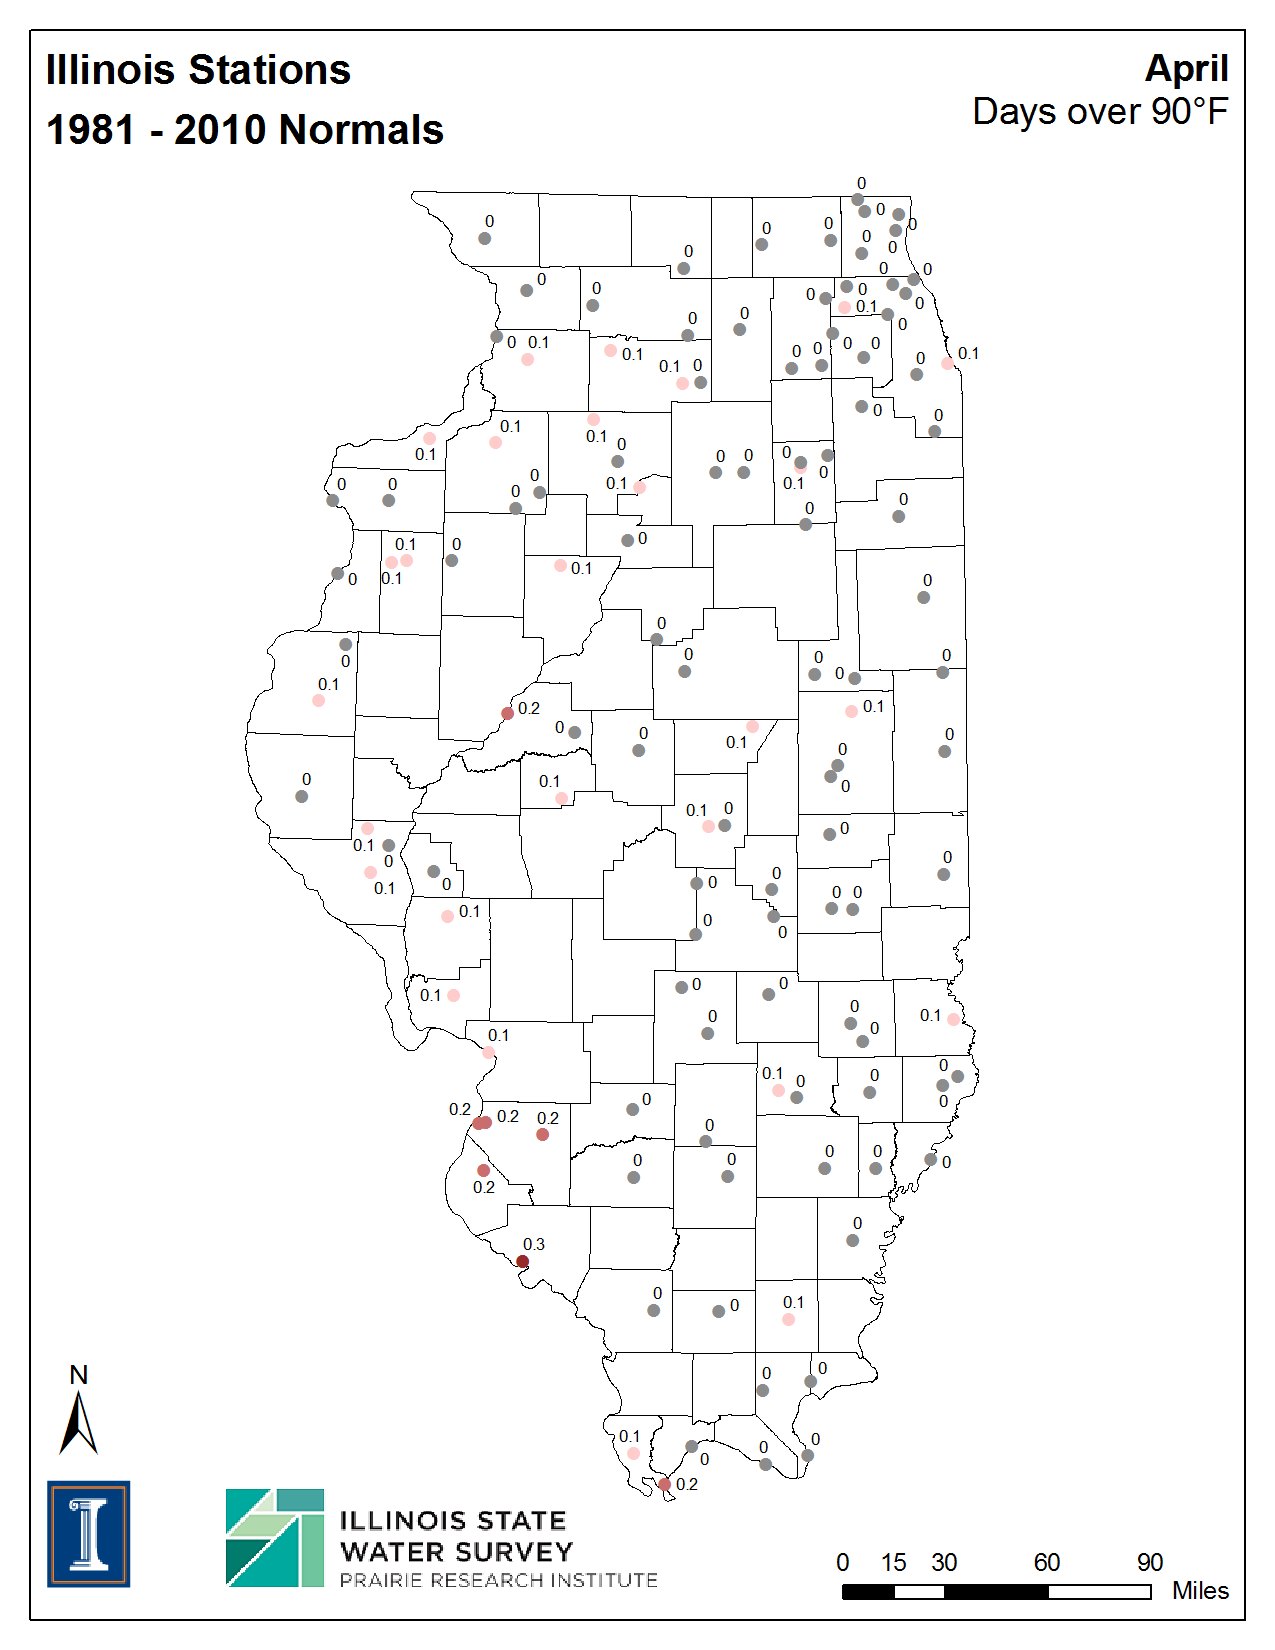
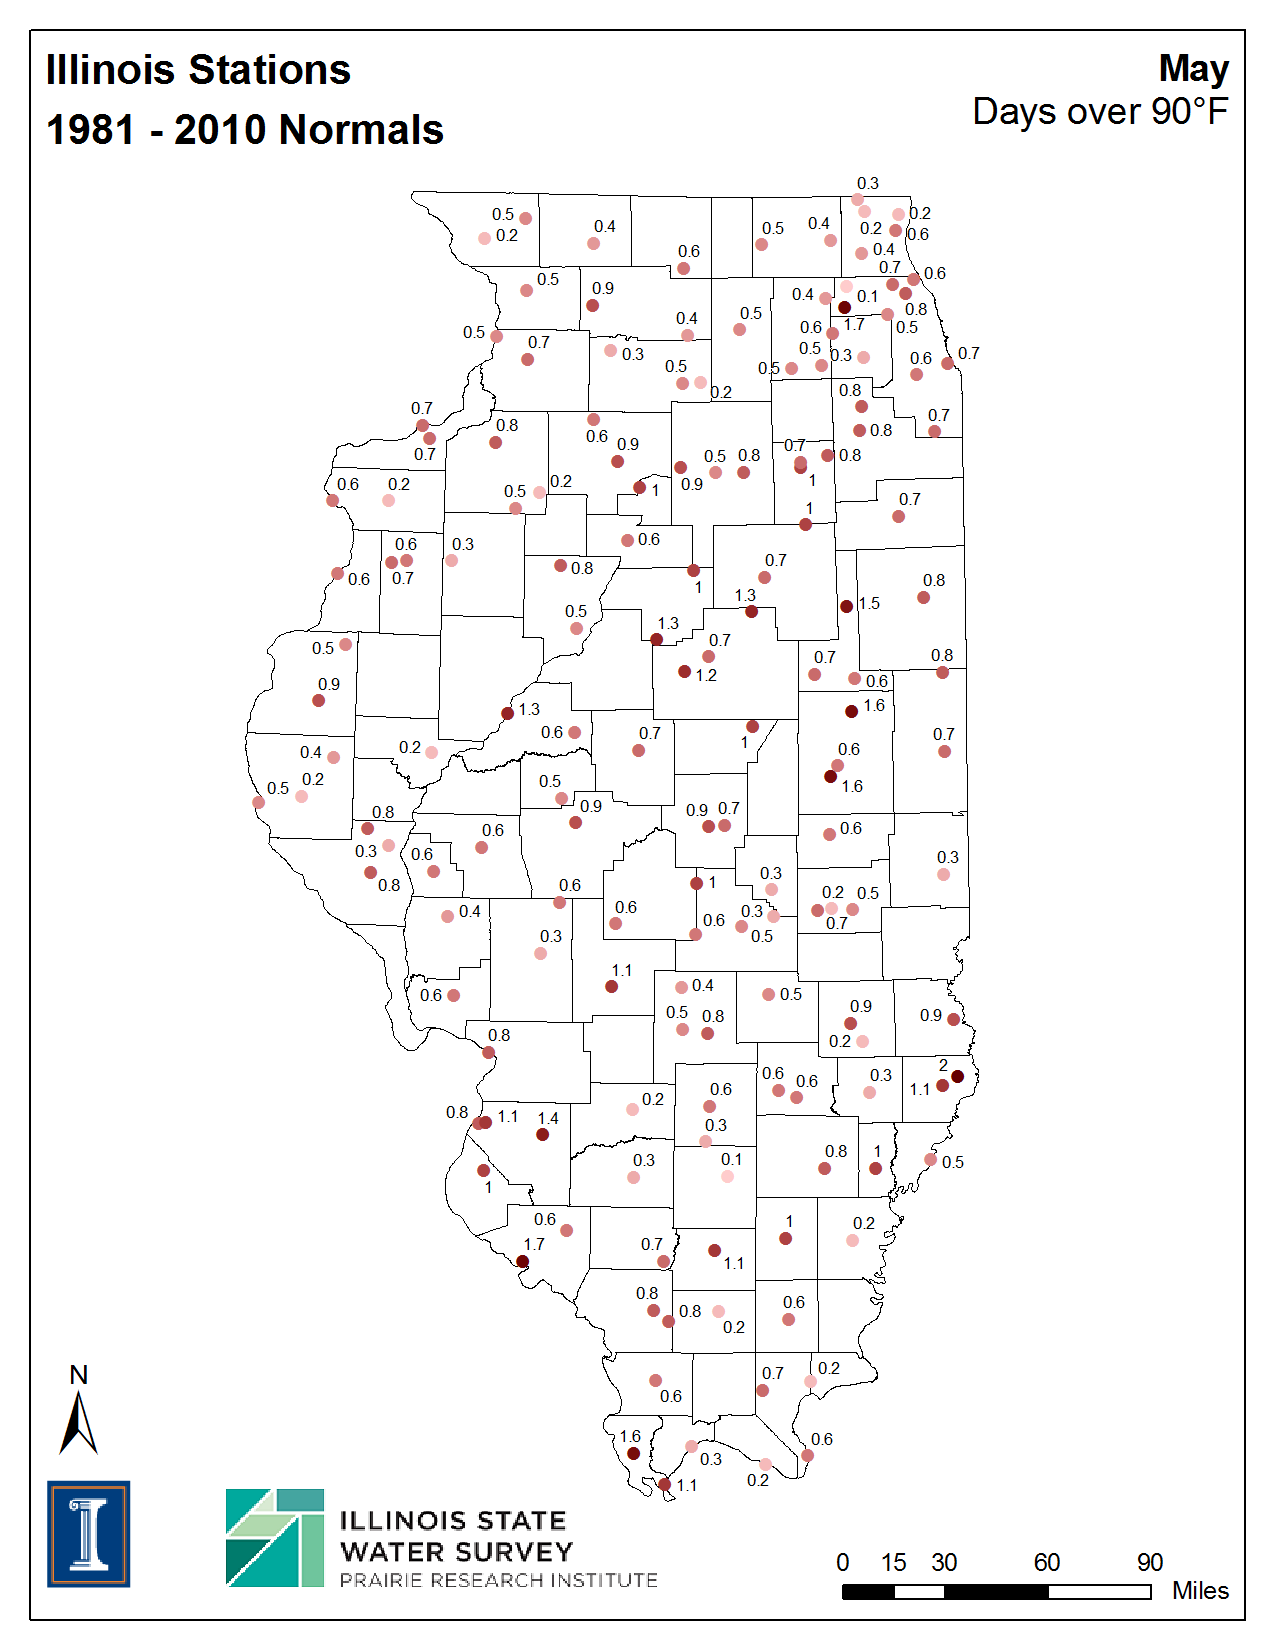
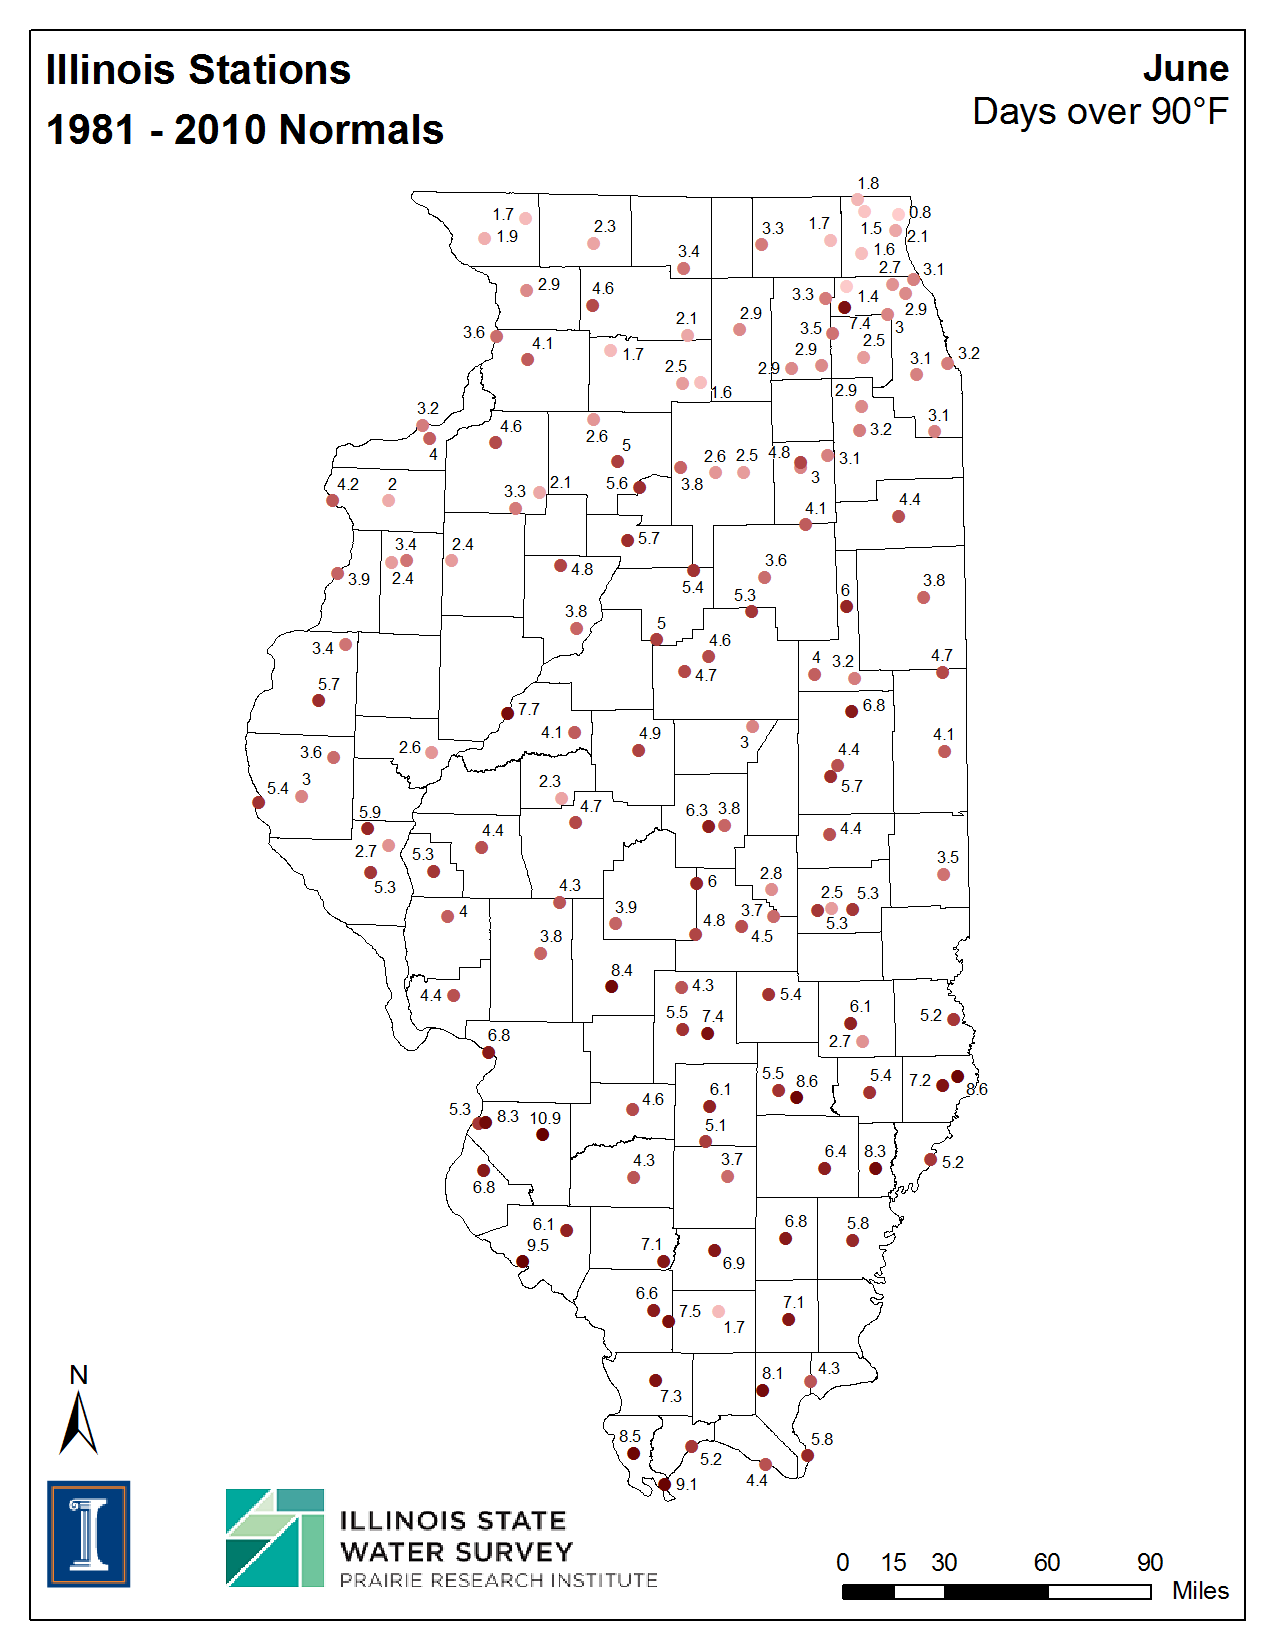
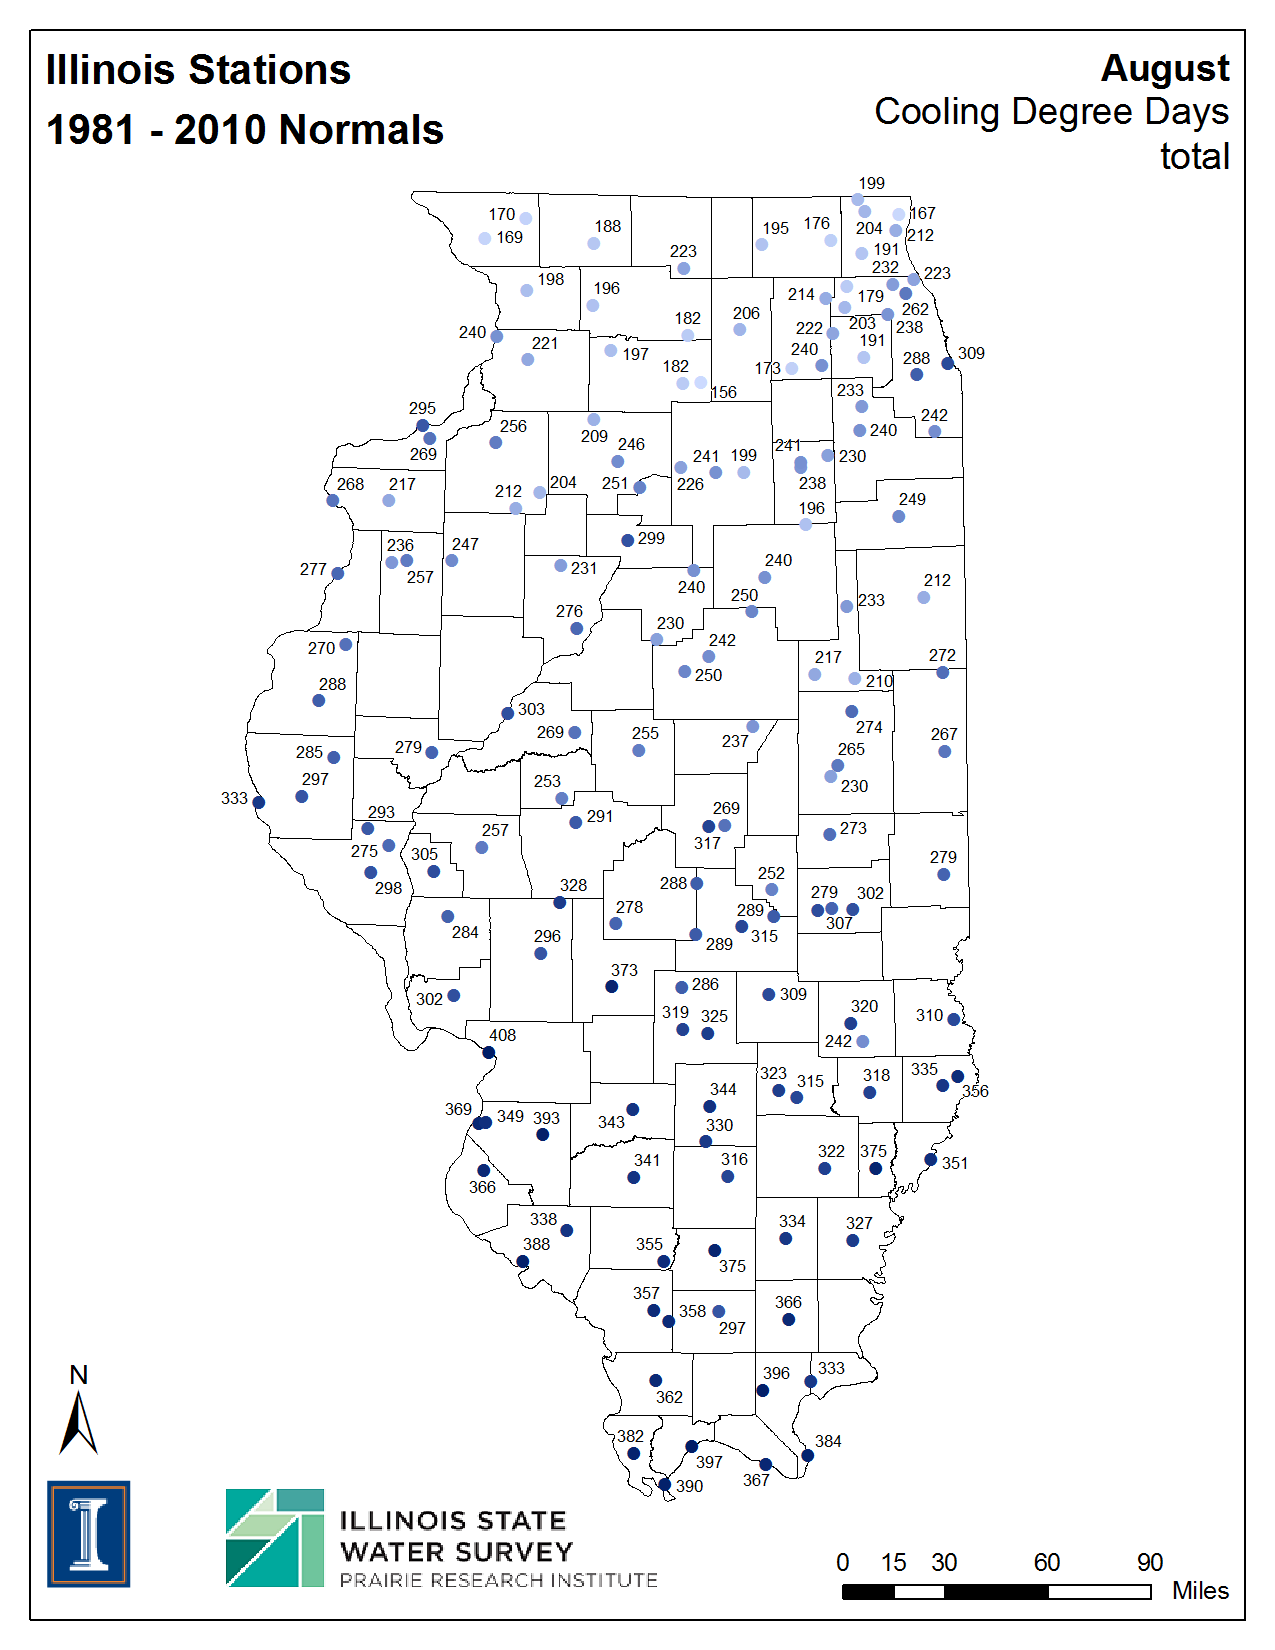
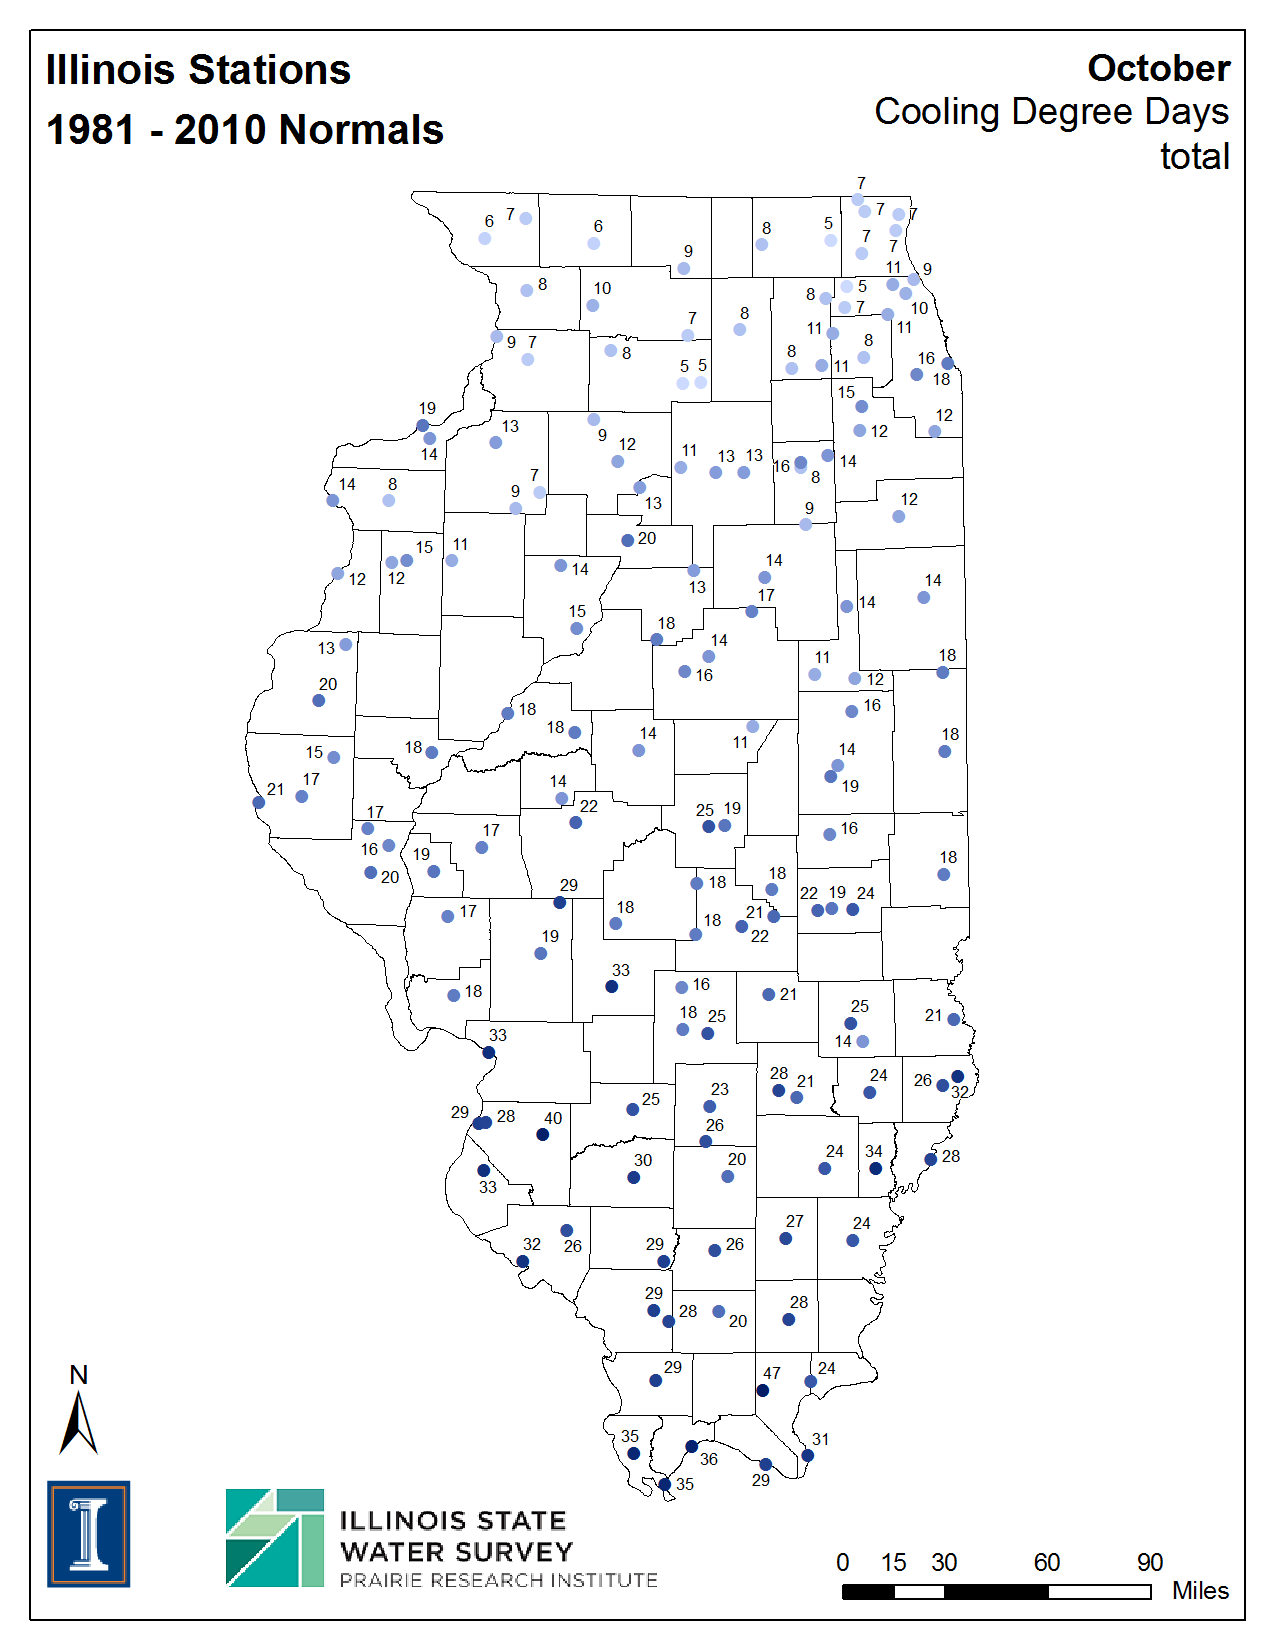
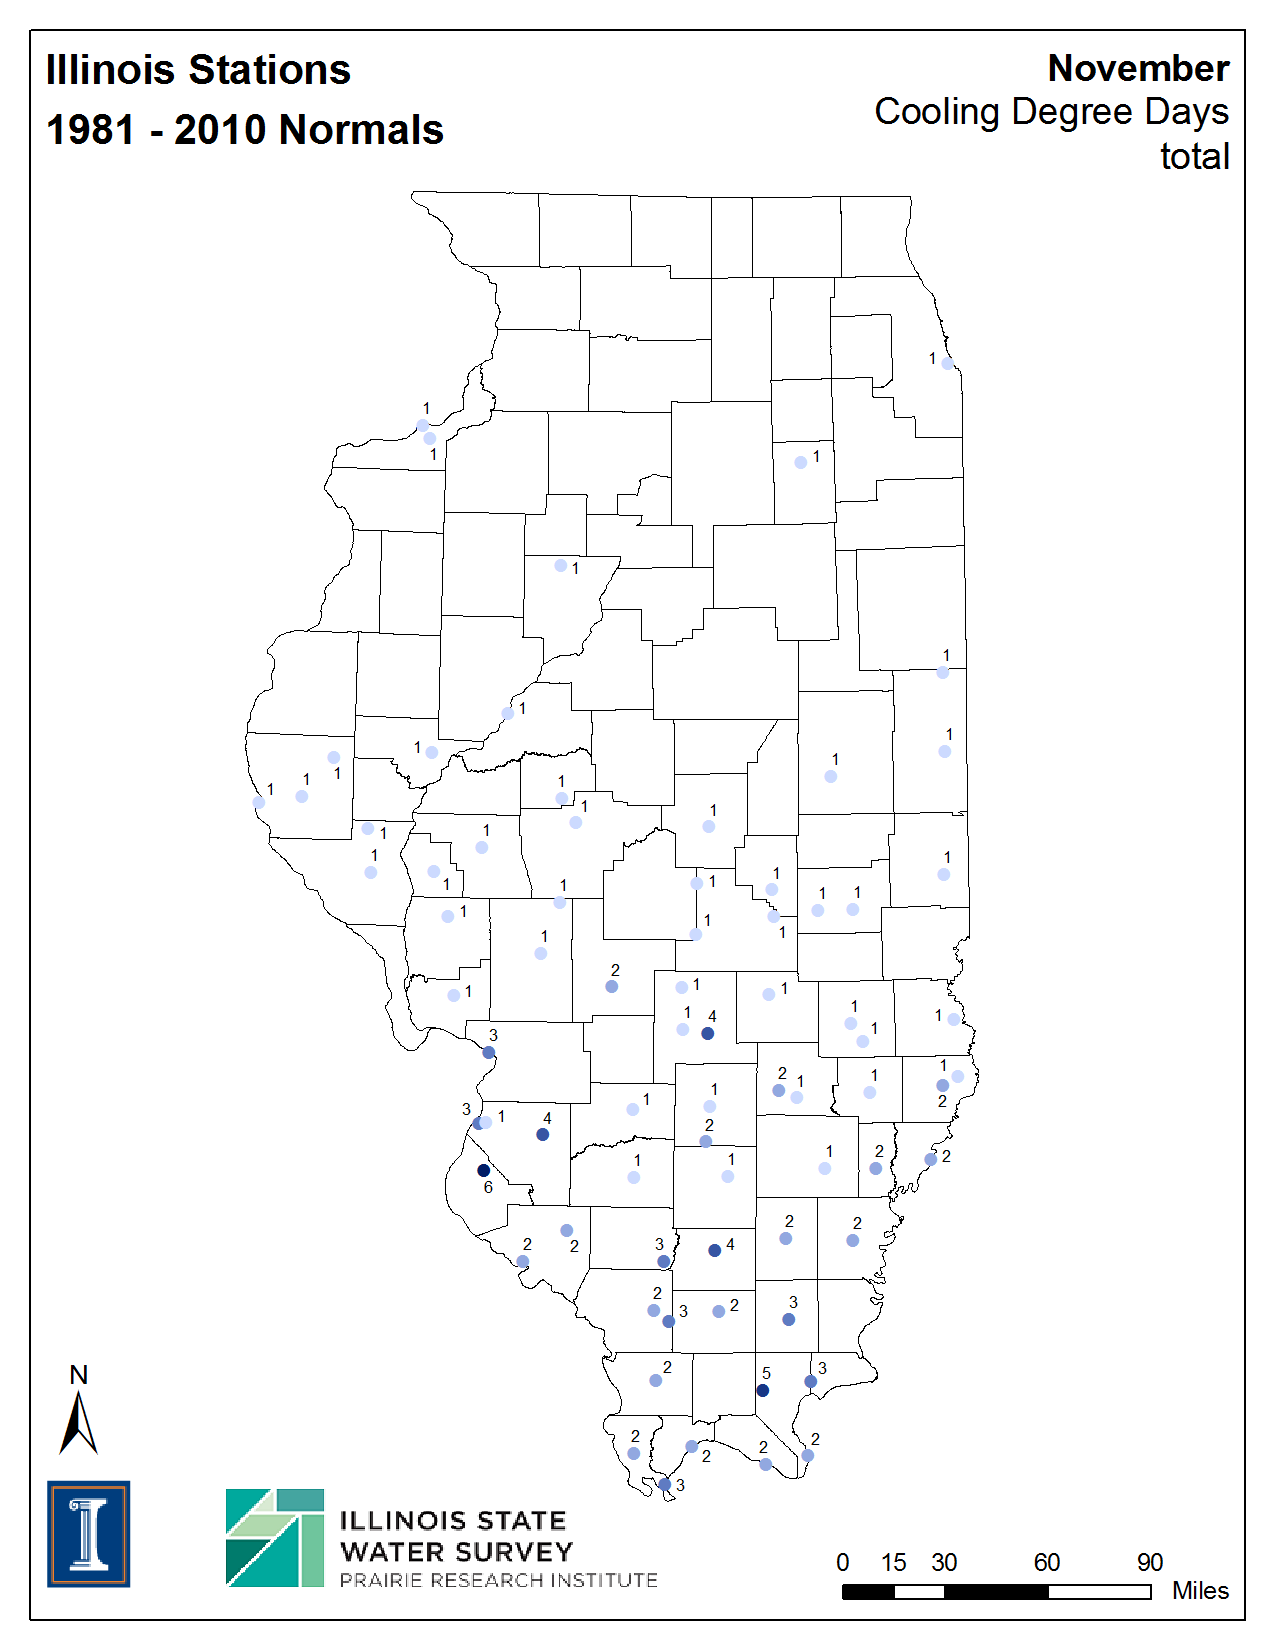
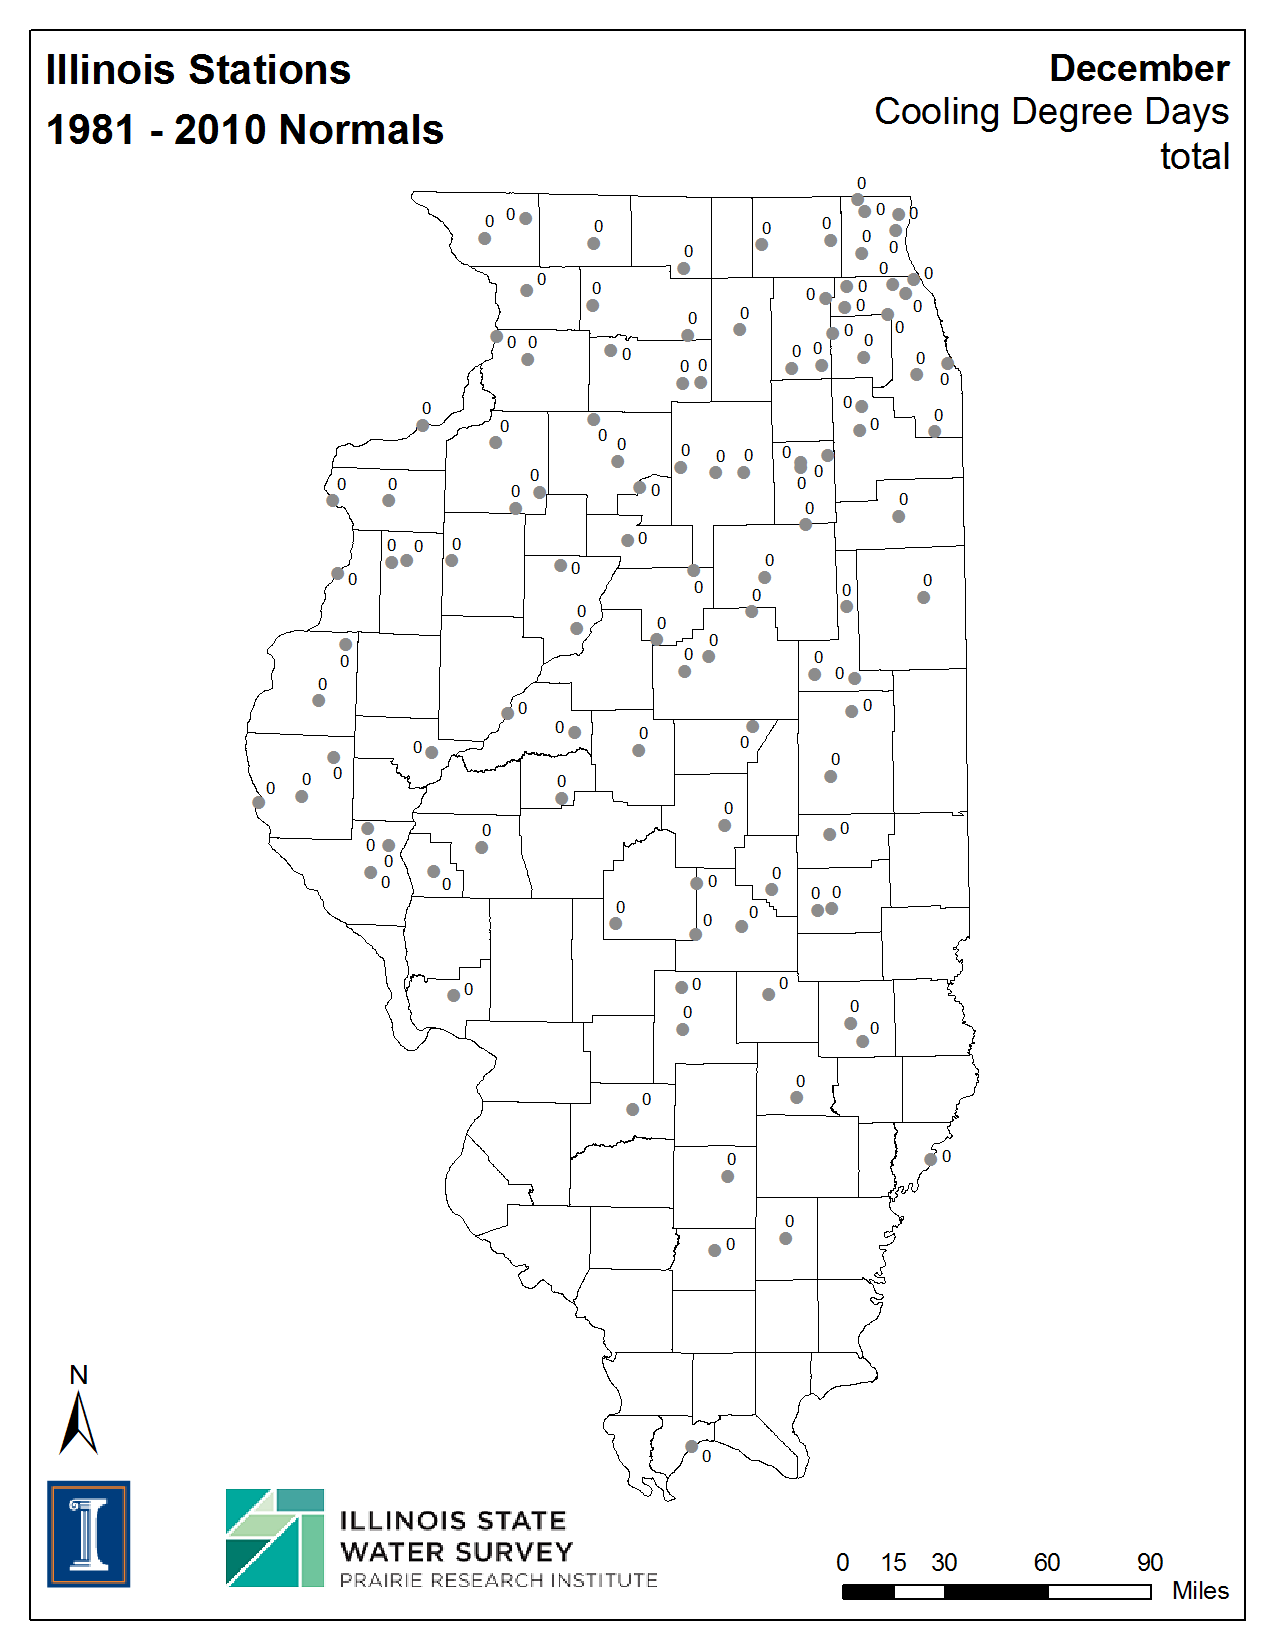
According to the National Oceanic and Atmospheric Administration, the 30-year average of a particular variable (e.g., temperature) is called the “normal.” For example, the minimum temperature normal in January for a station in Chicago, Illinois, would be computed by taking the average of the 30 January values of monthly-averaged minimum temperatures from 1991 to 2020. Each of the 30 monthly values was in turn derived from averaging the daily observations of minimum temperature for the station. In practice, much more goes into the NOAA National Centers for Environmental Information (NCEI) Normals product than simple 30-year averages. Procedures exist to deal with missing and suspect data values.
Normals provide users with many tools to understand typical climate conditions for thousands of locations across the United States. Normals in the U.S. are for 30 years and are updated every decade. You can find more information about climate normals on the NOAA website.
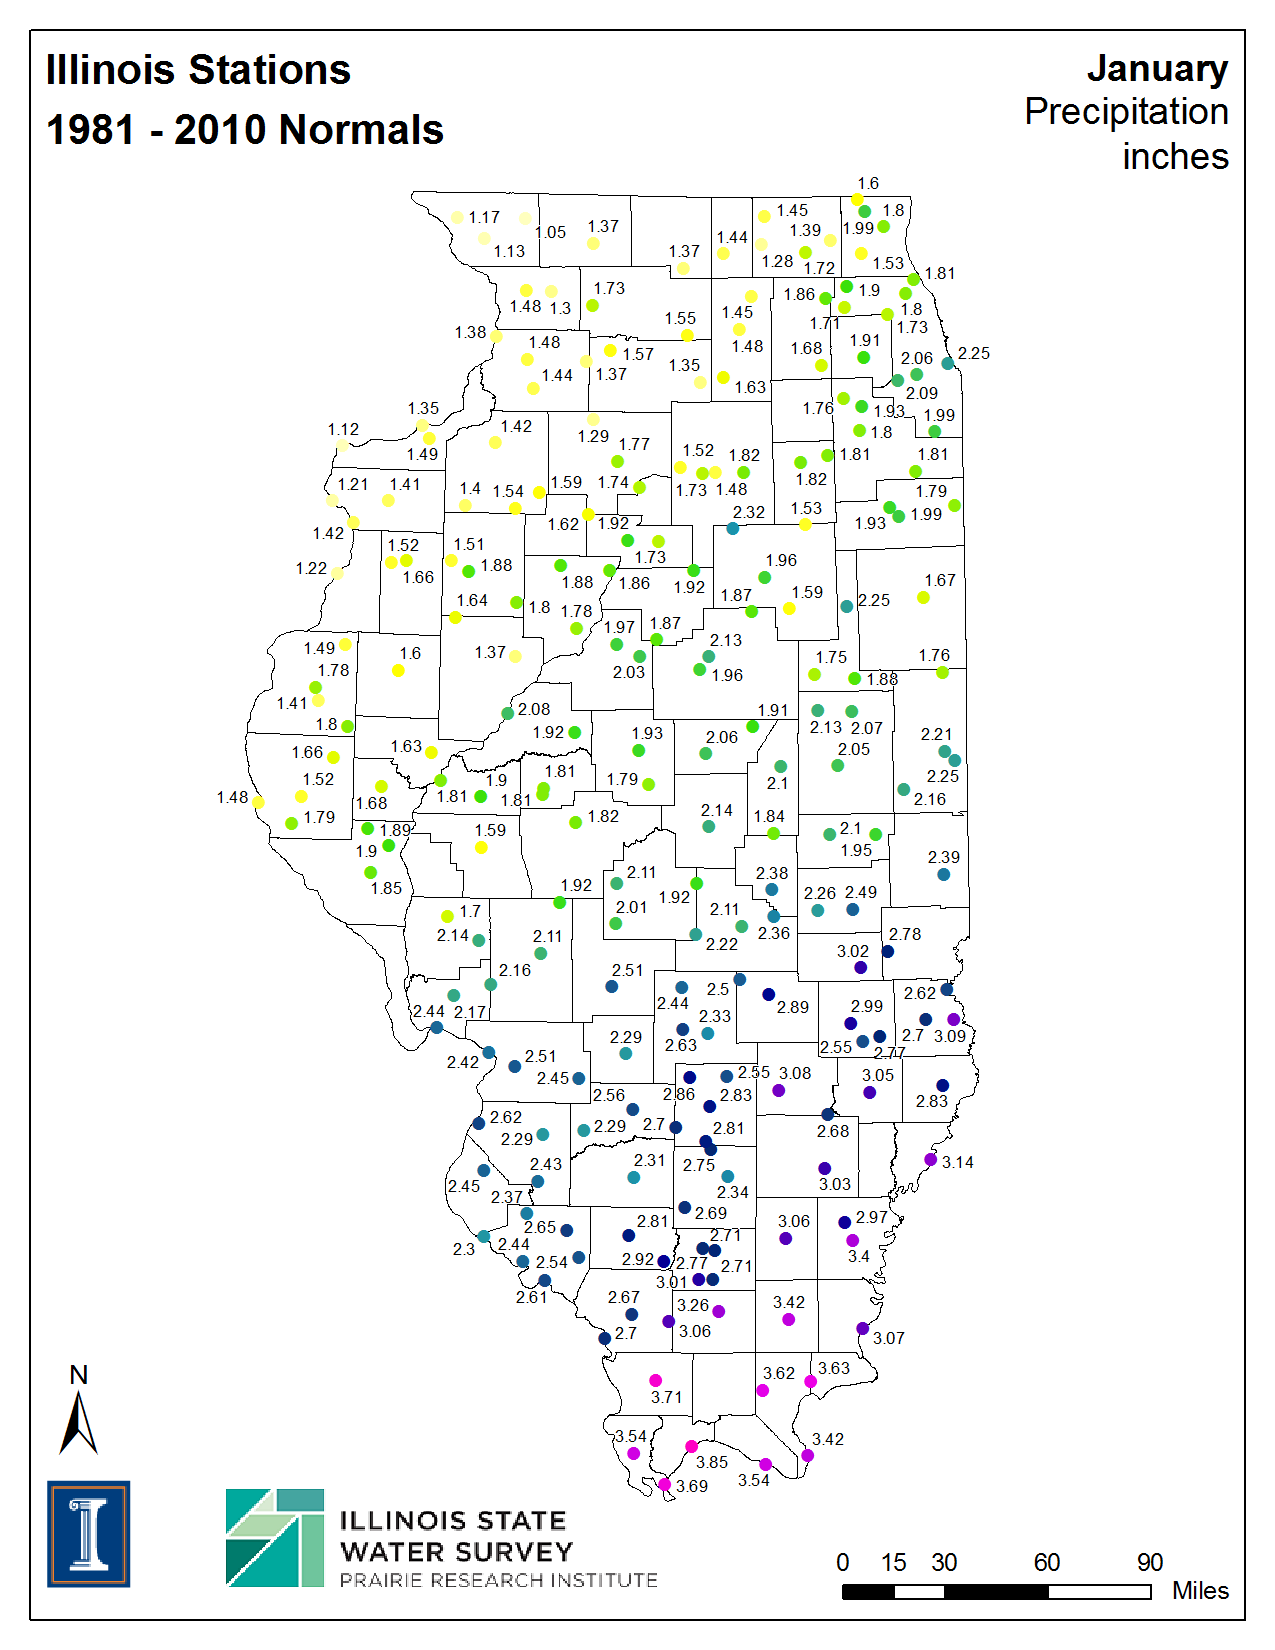
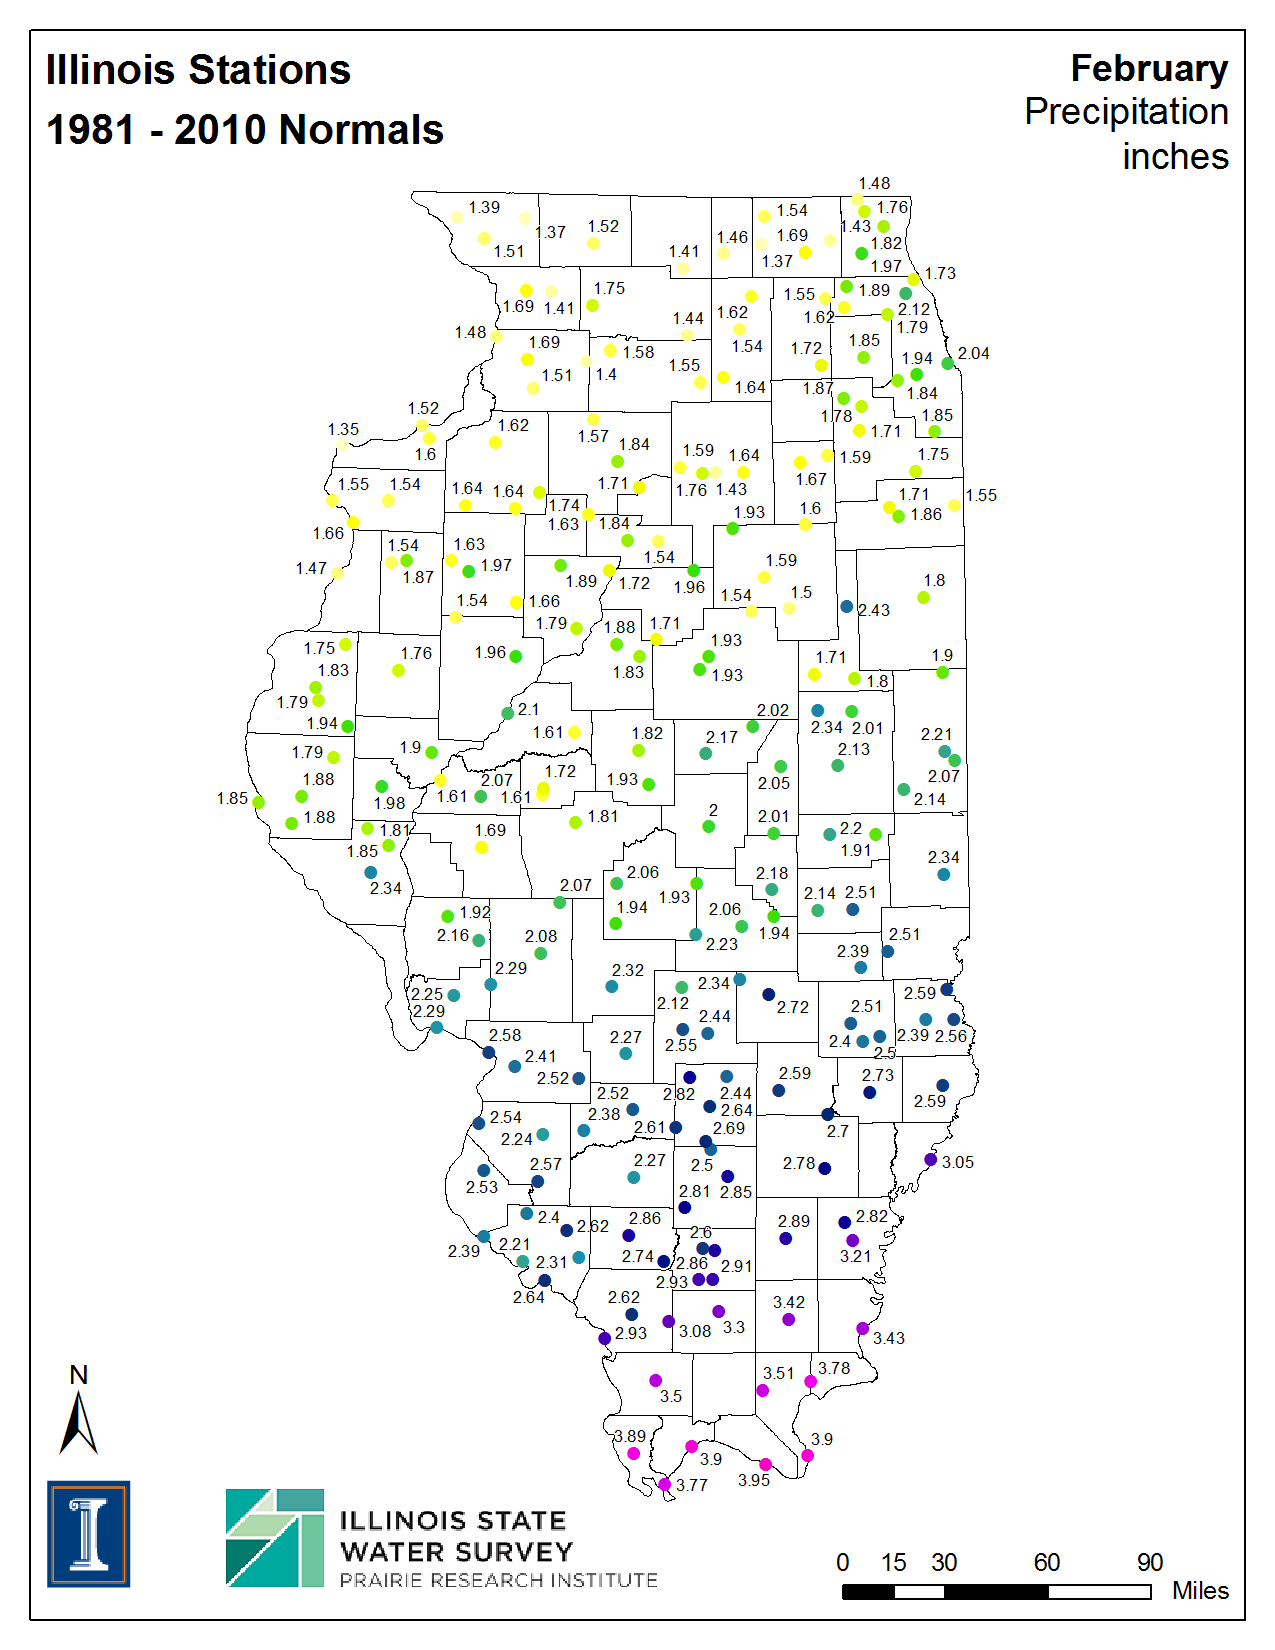
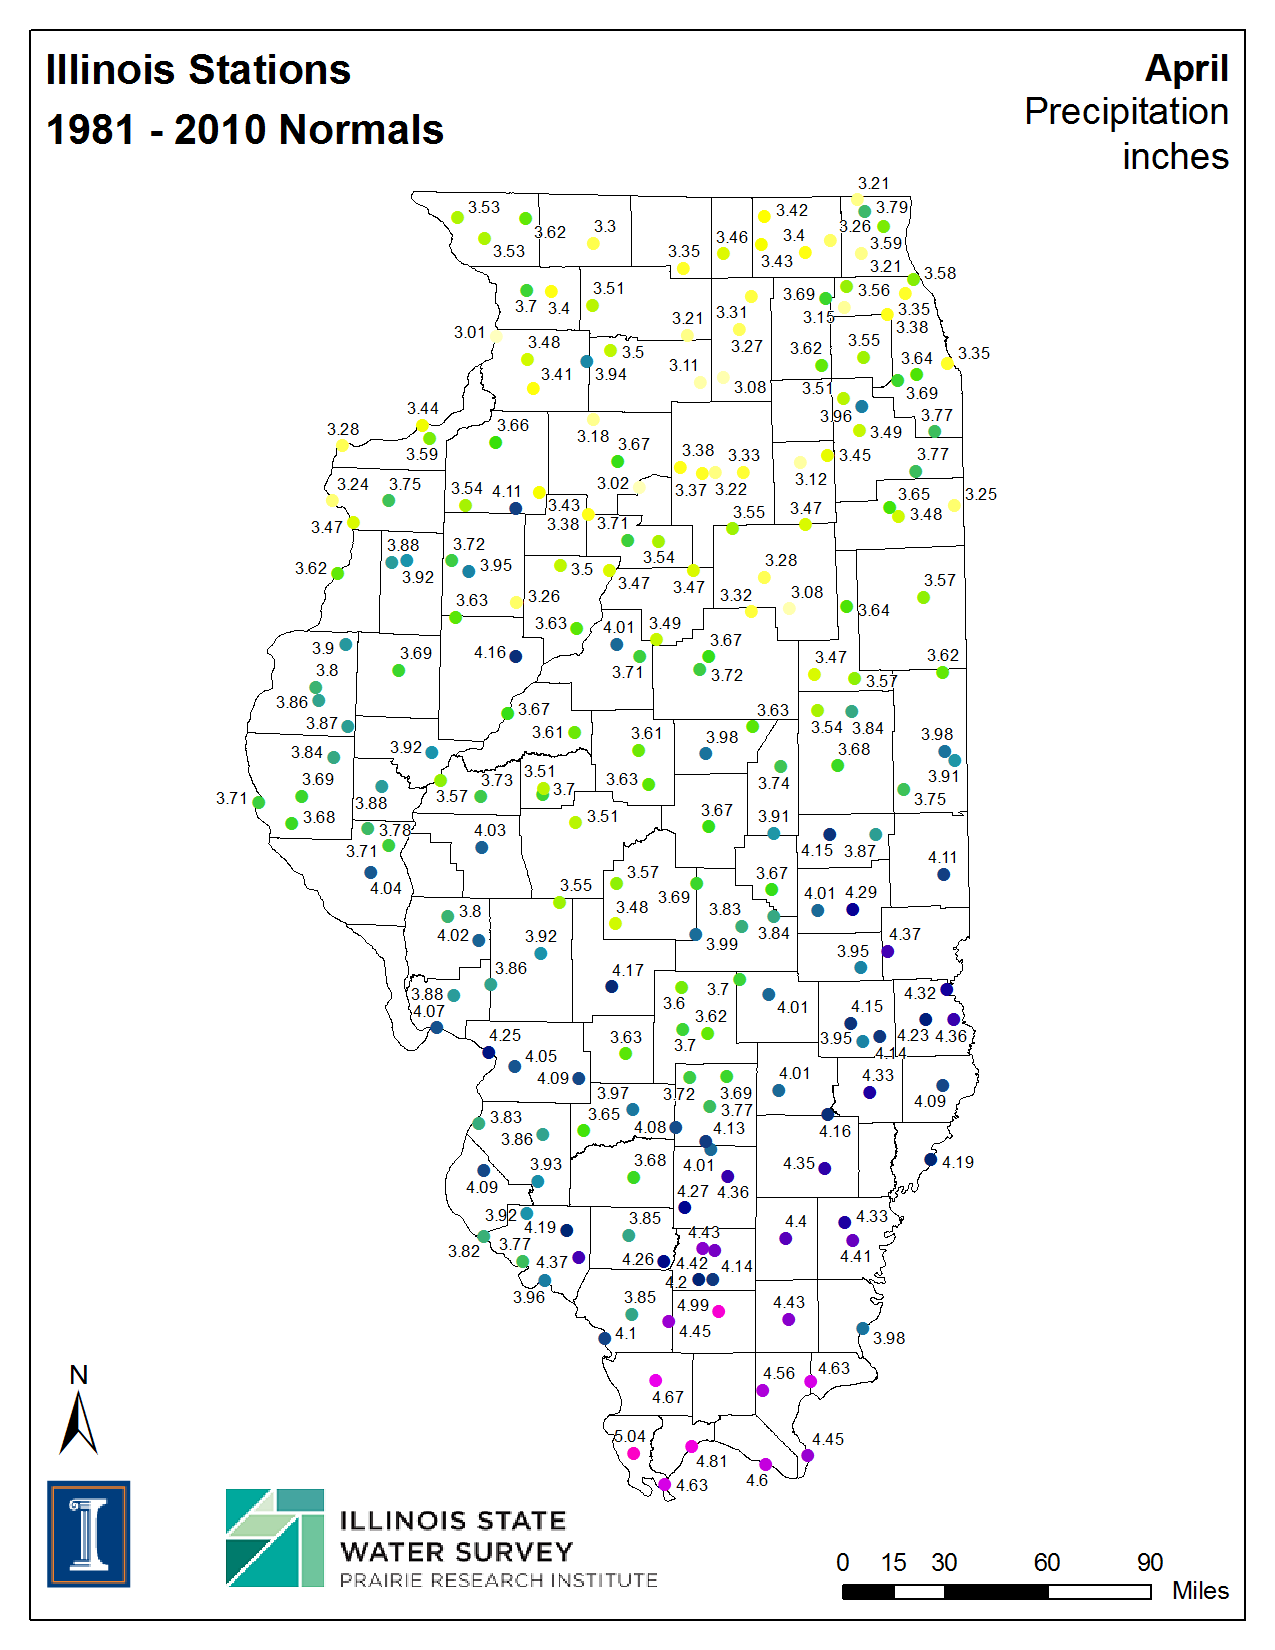
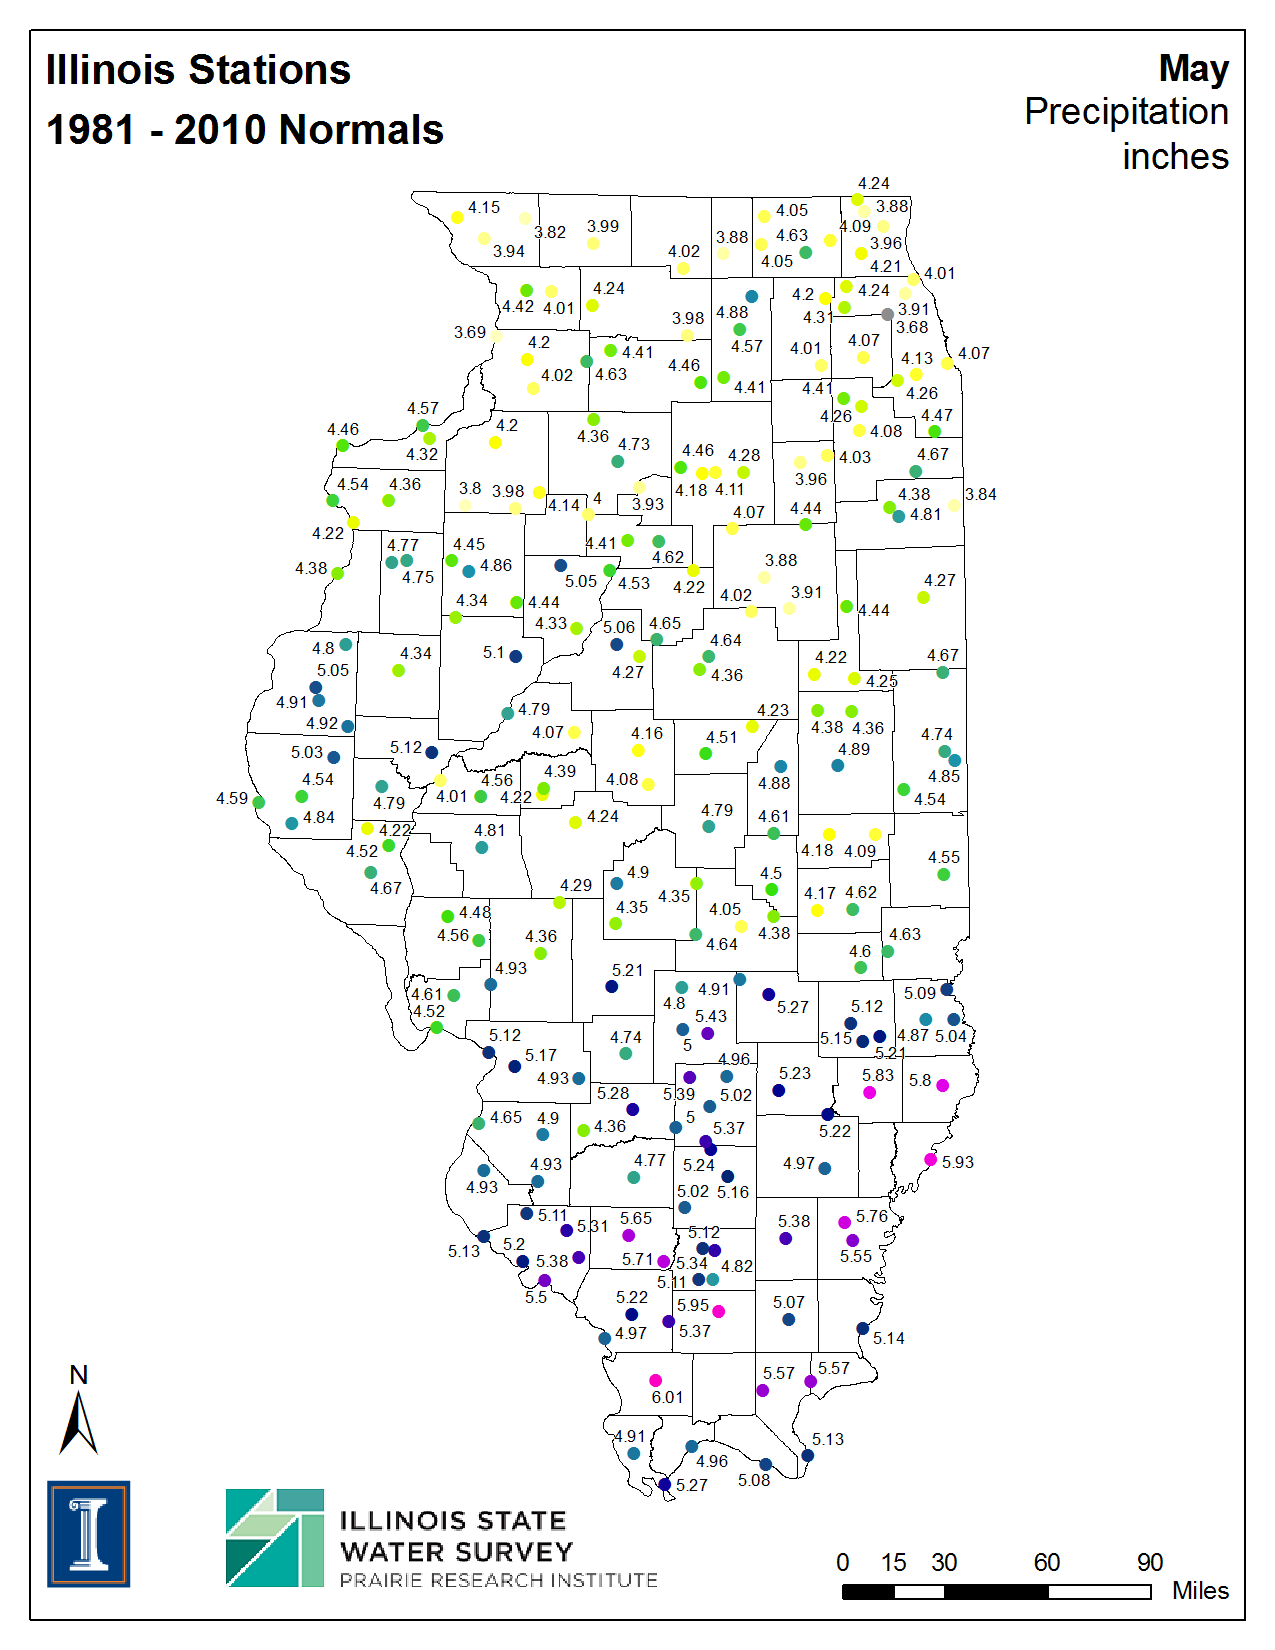
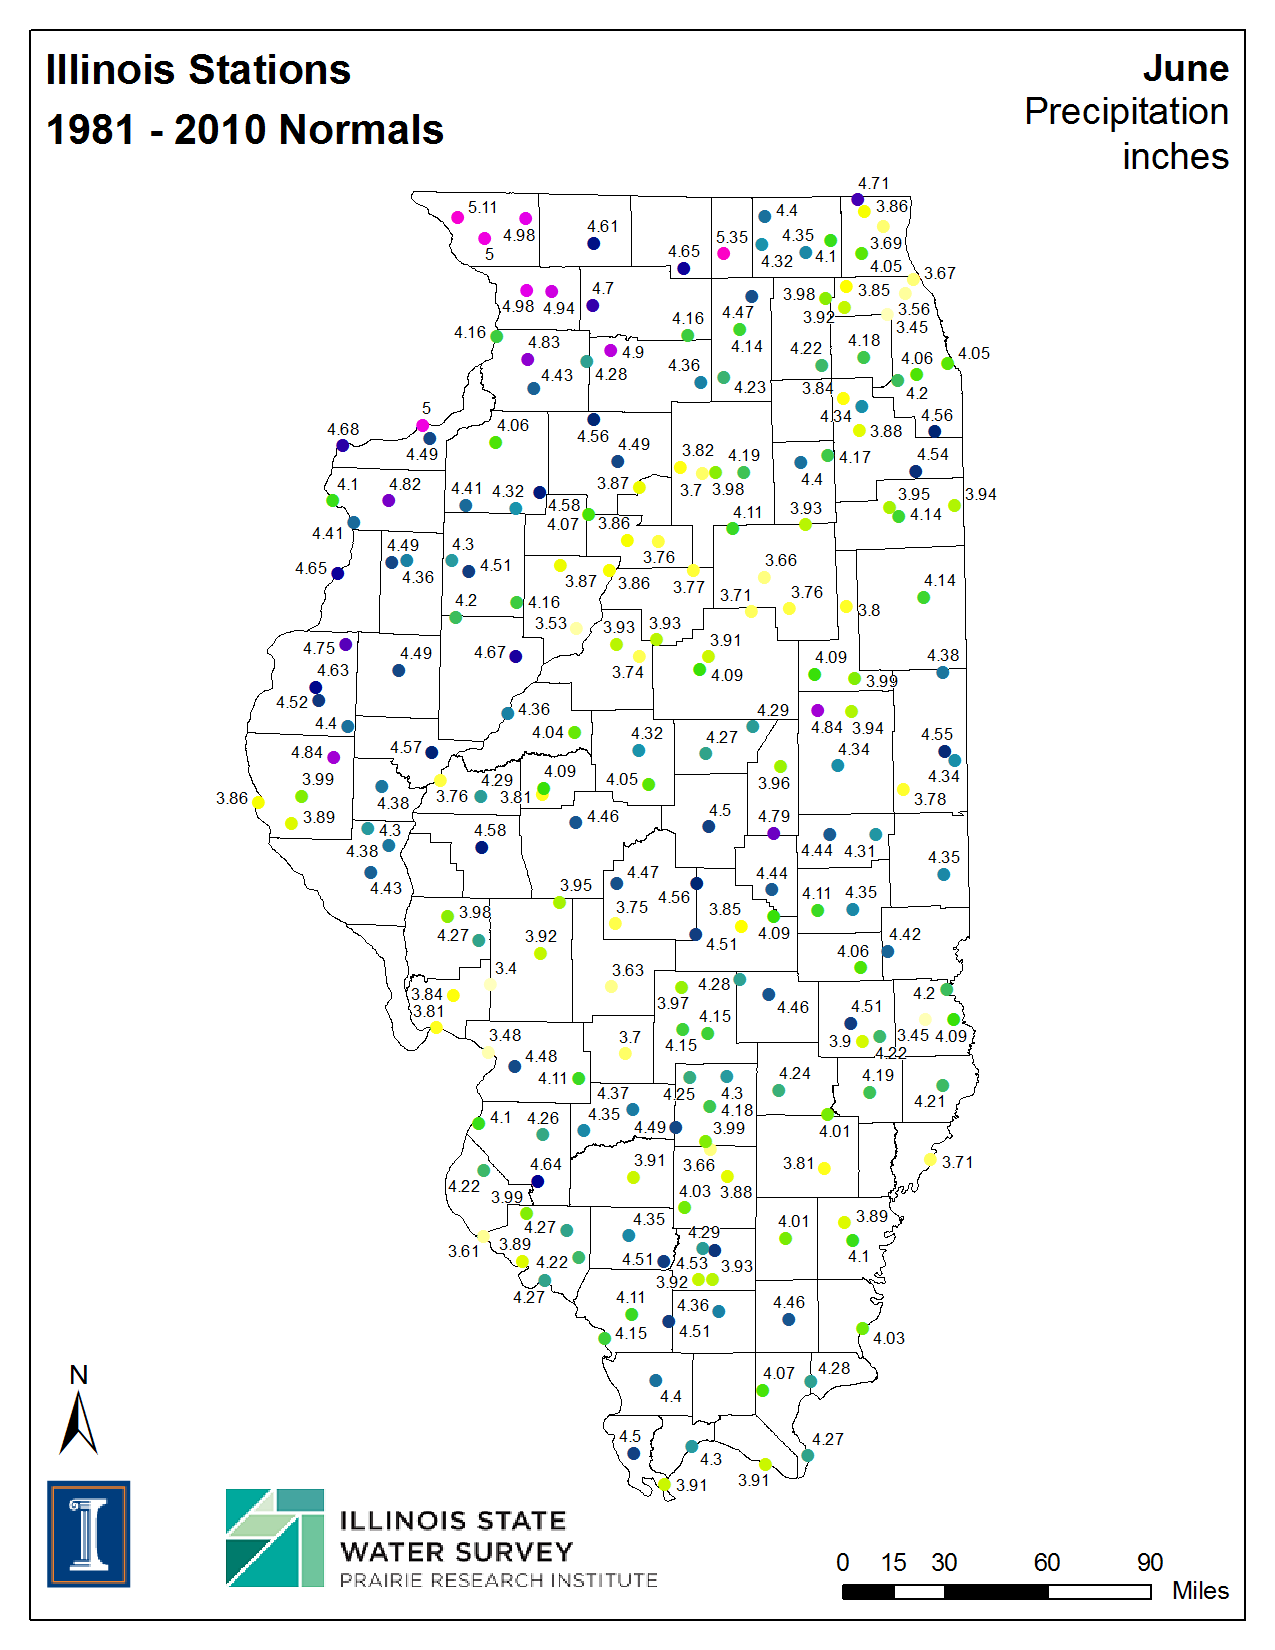
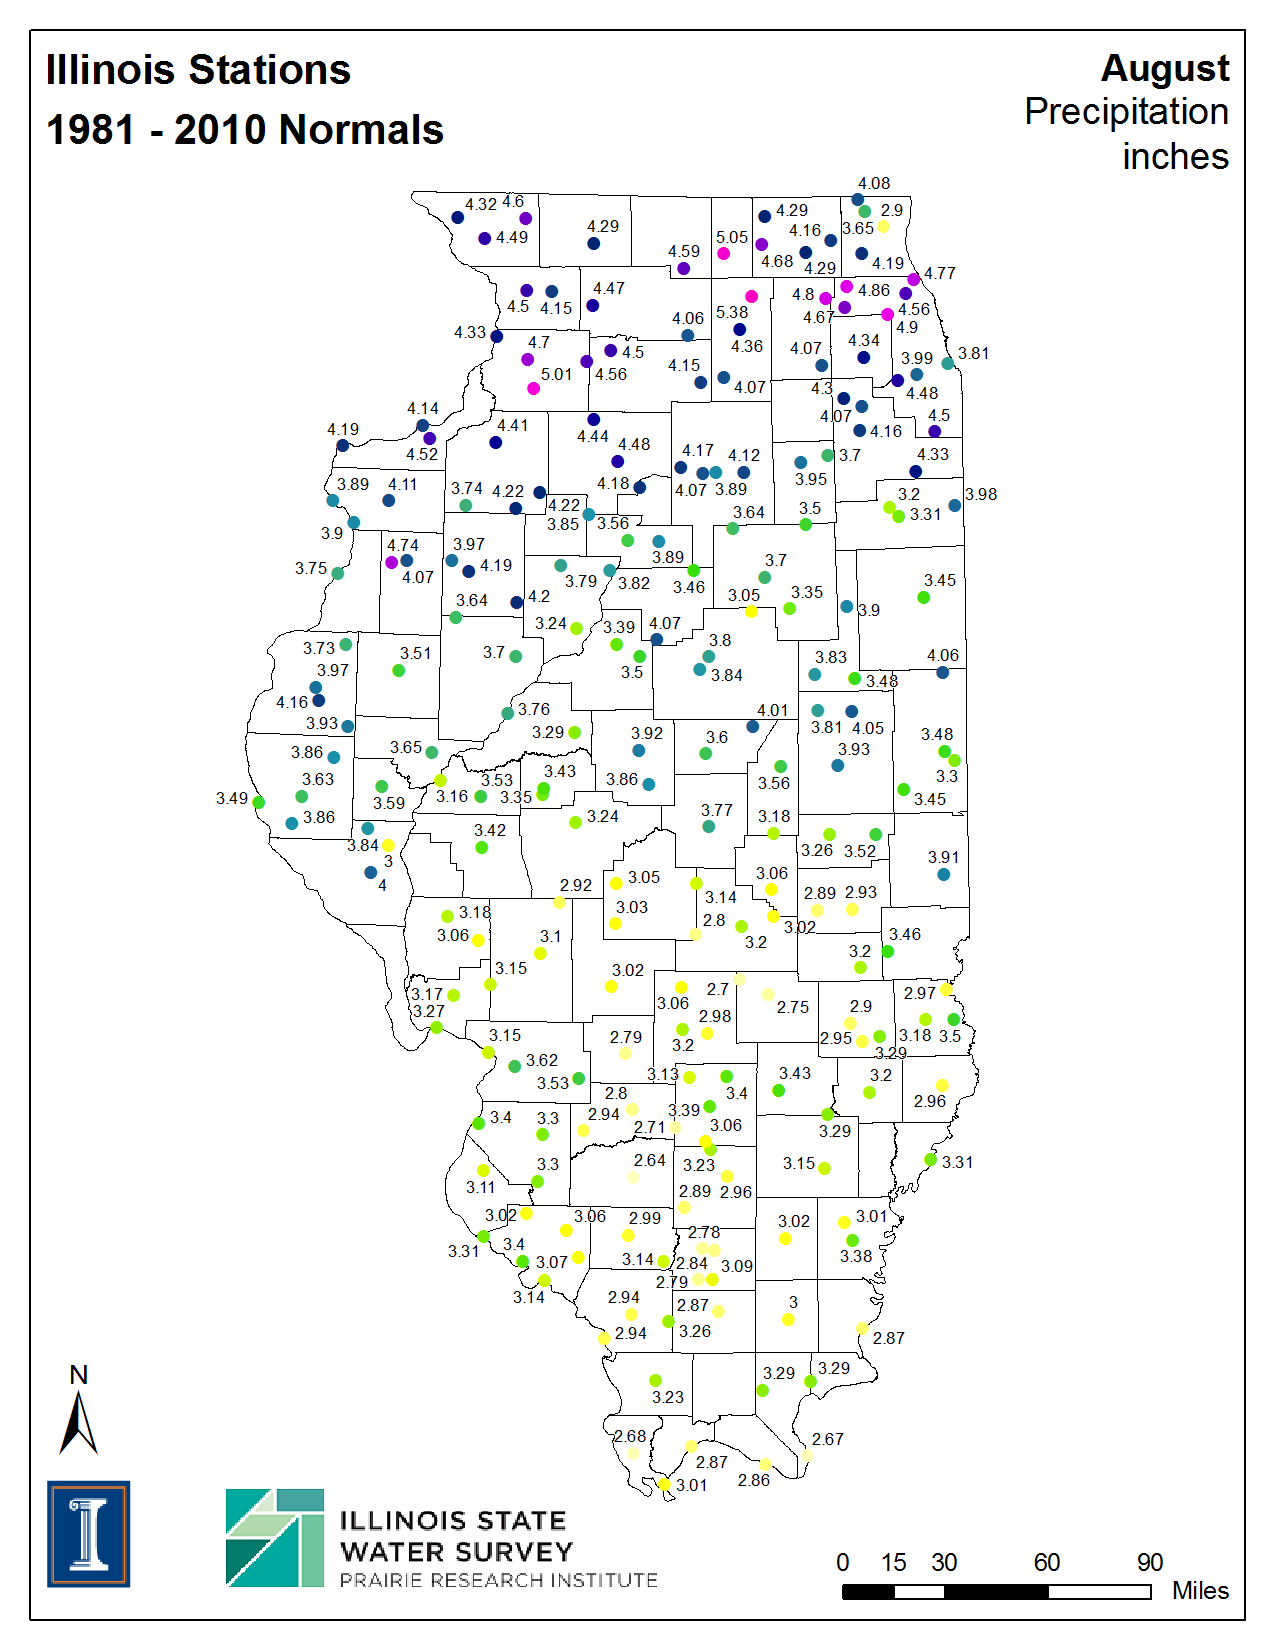
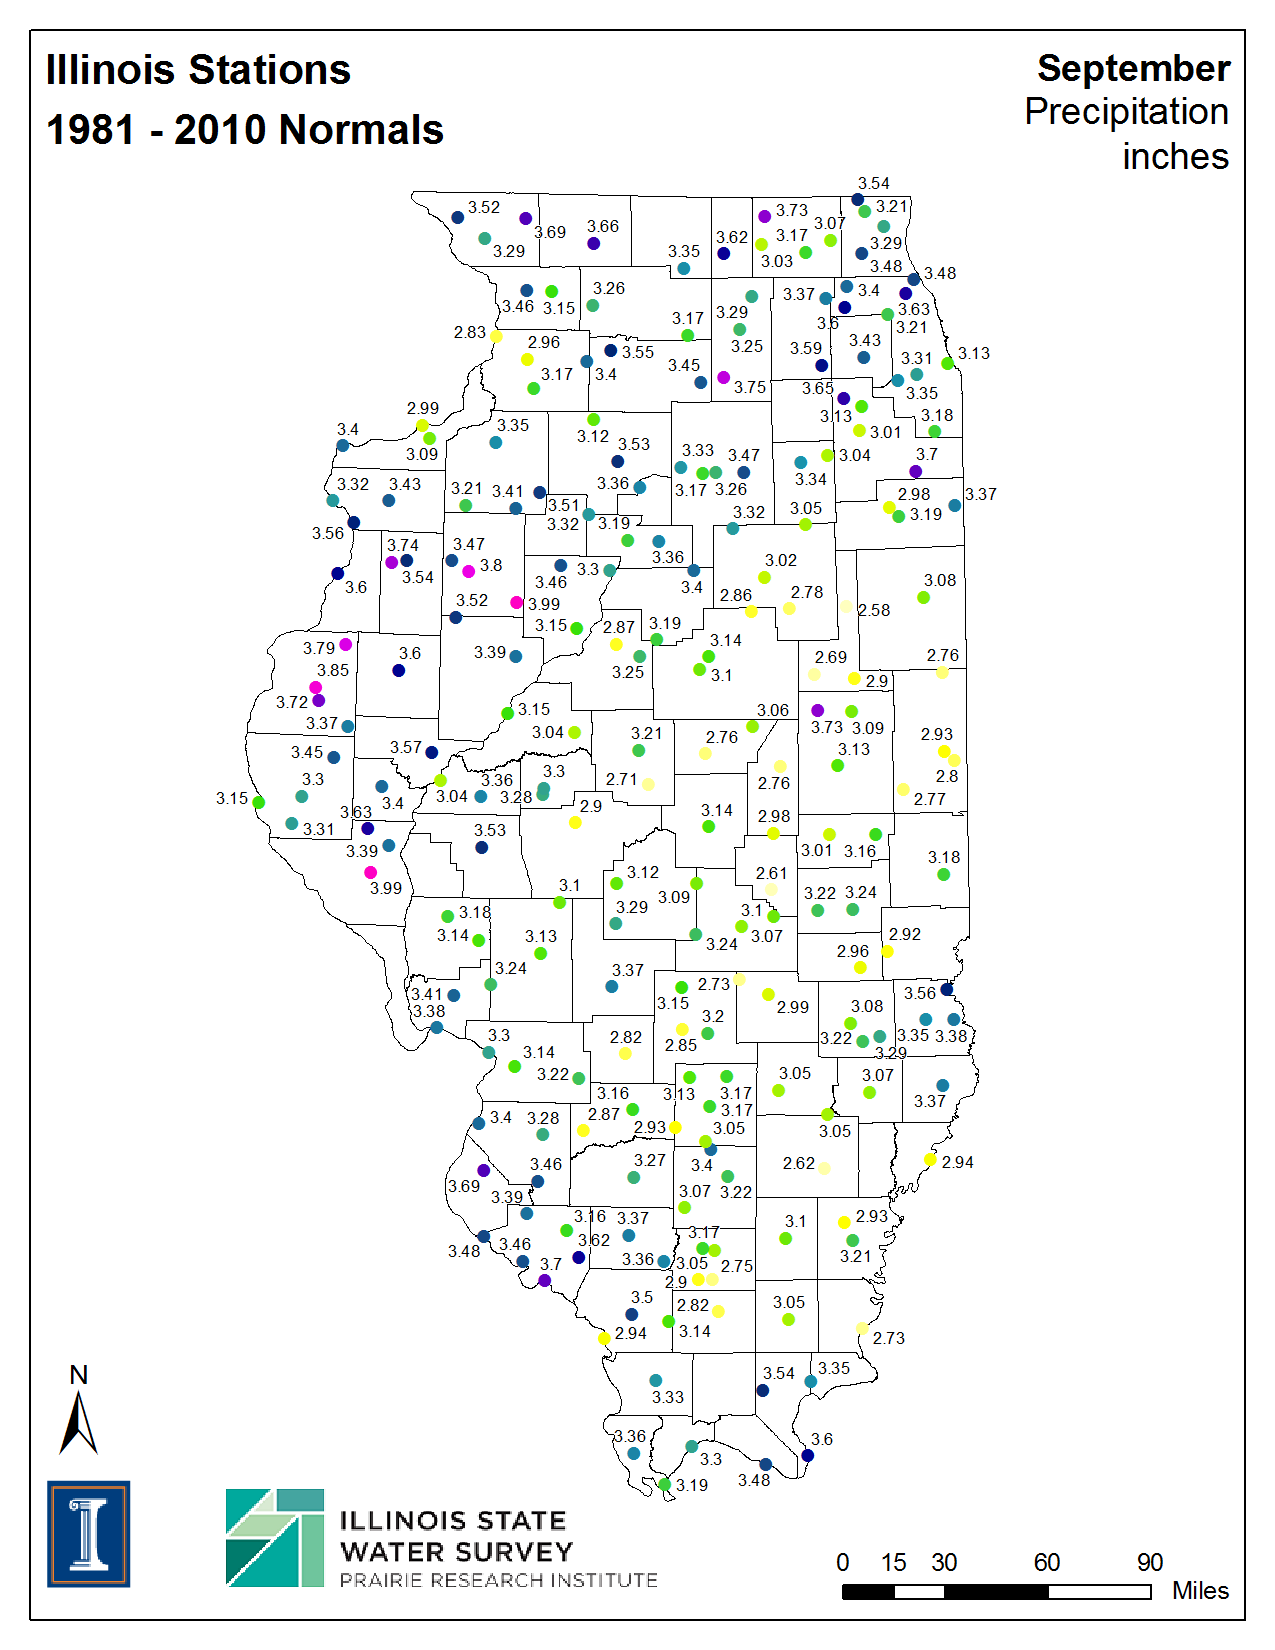
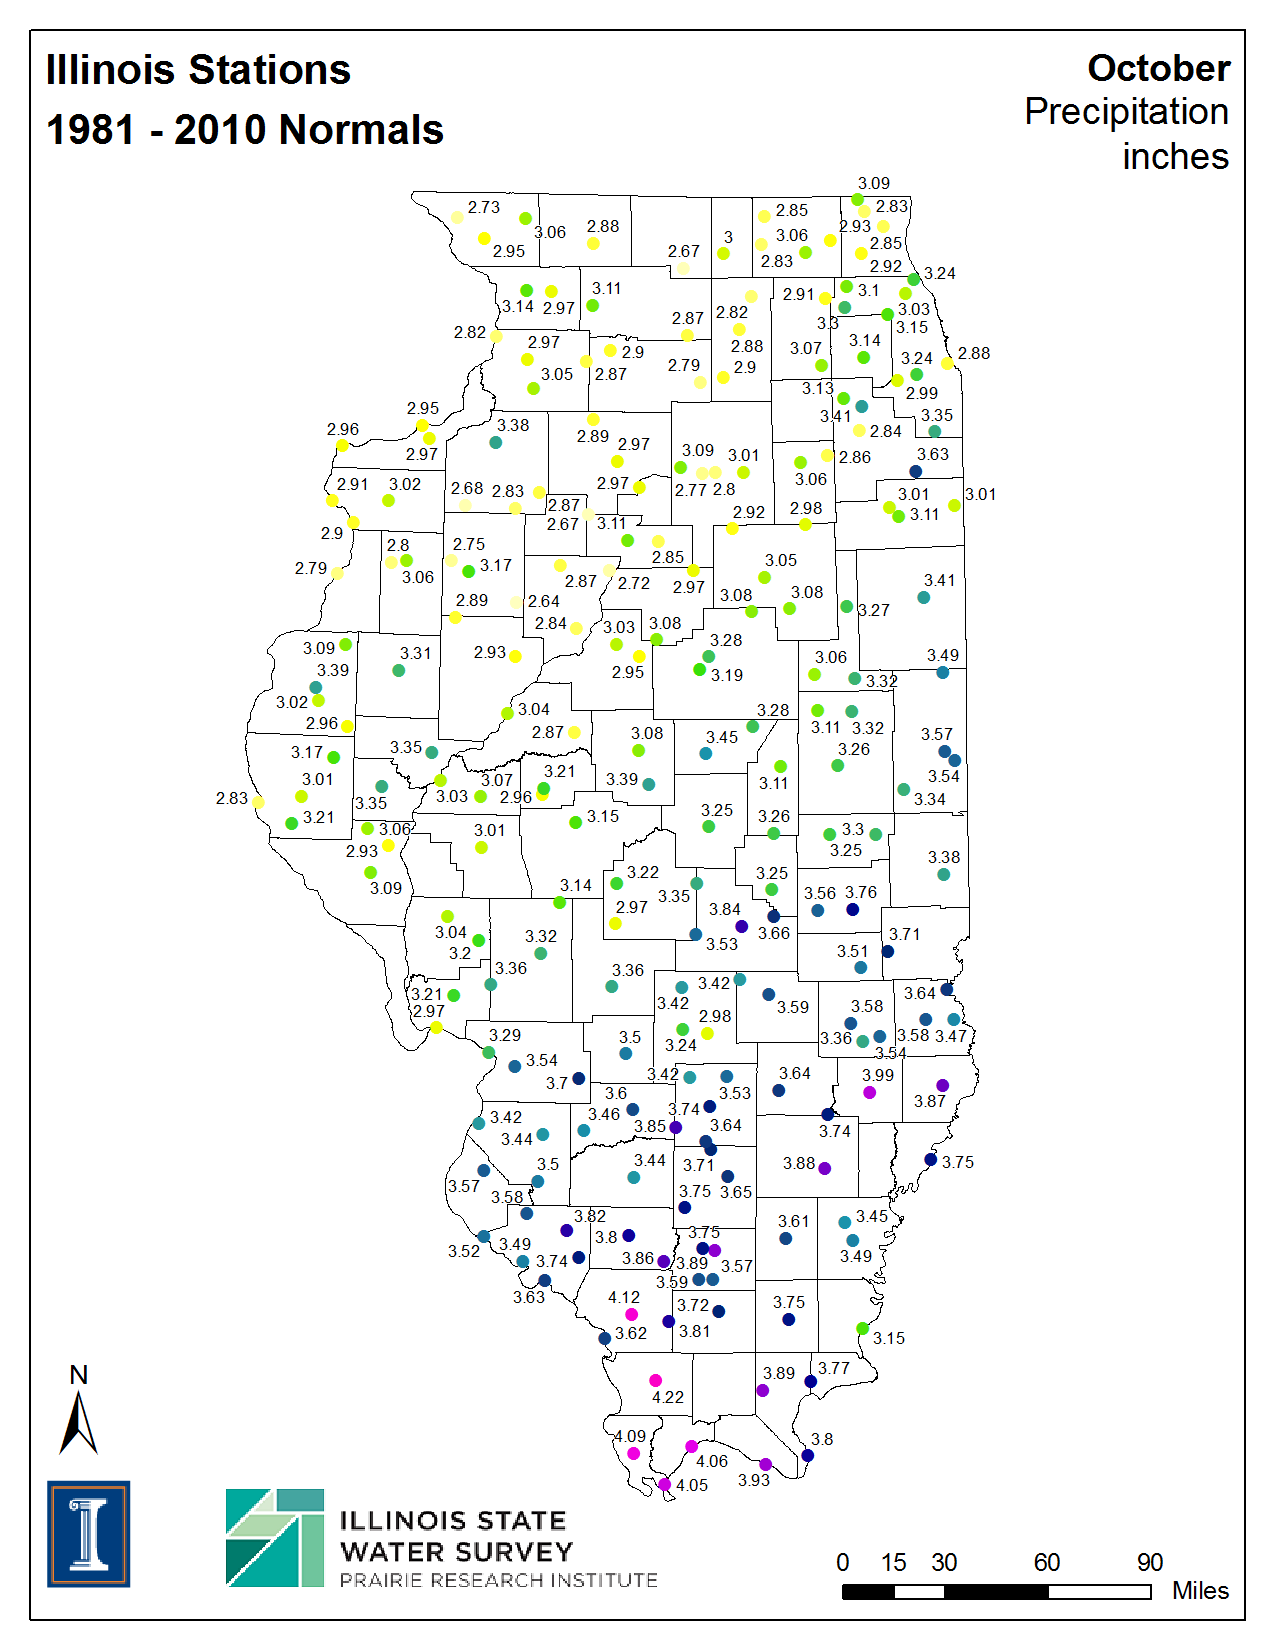
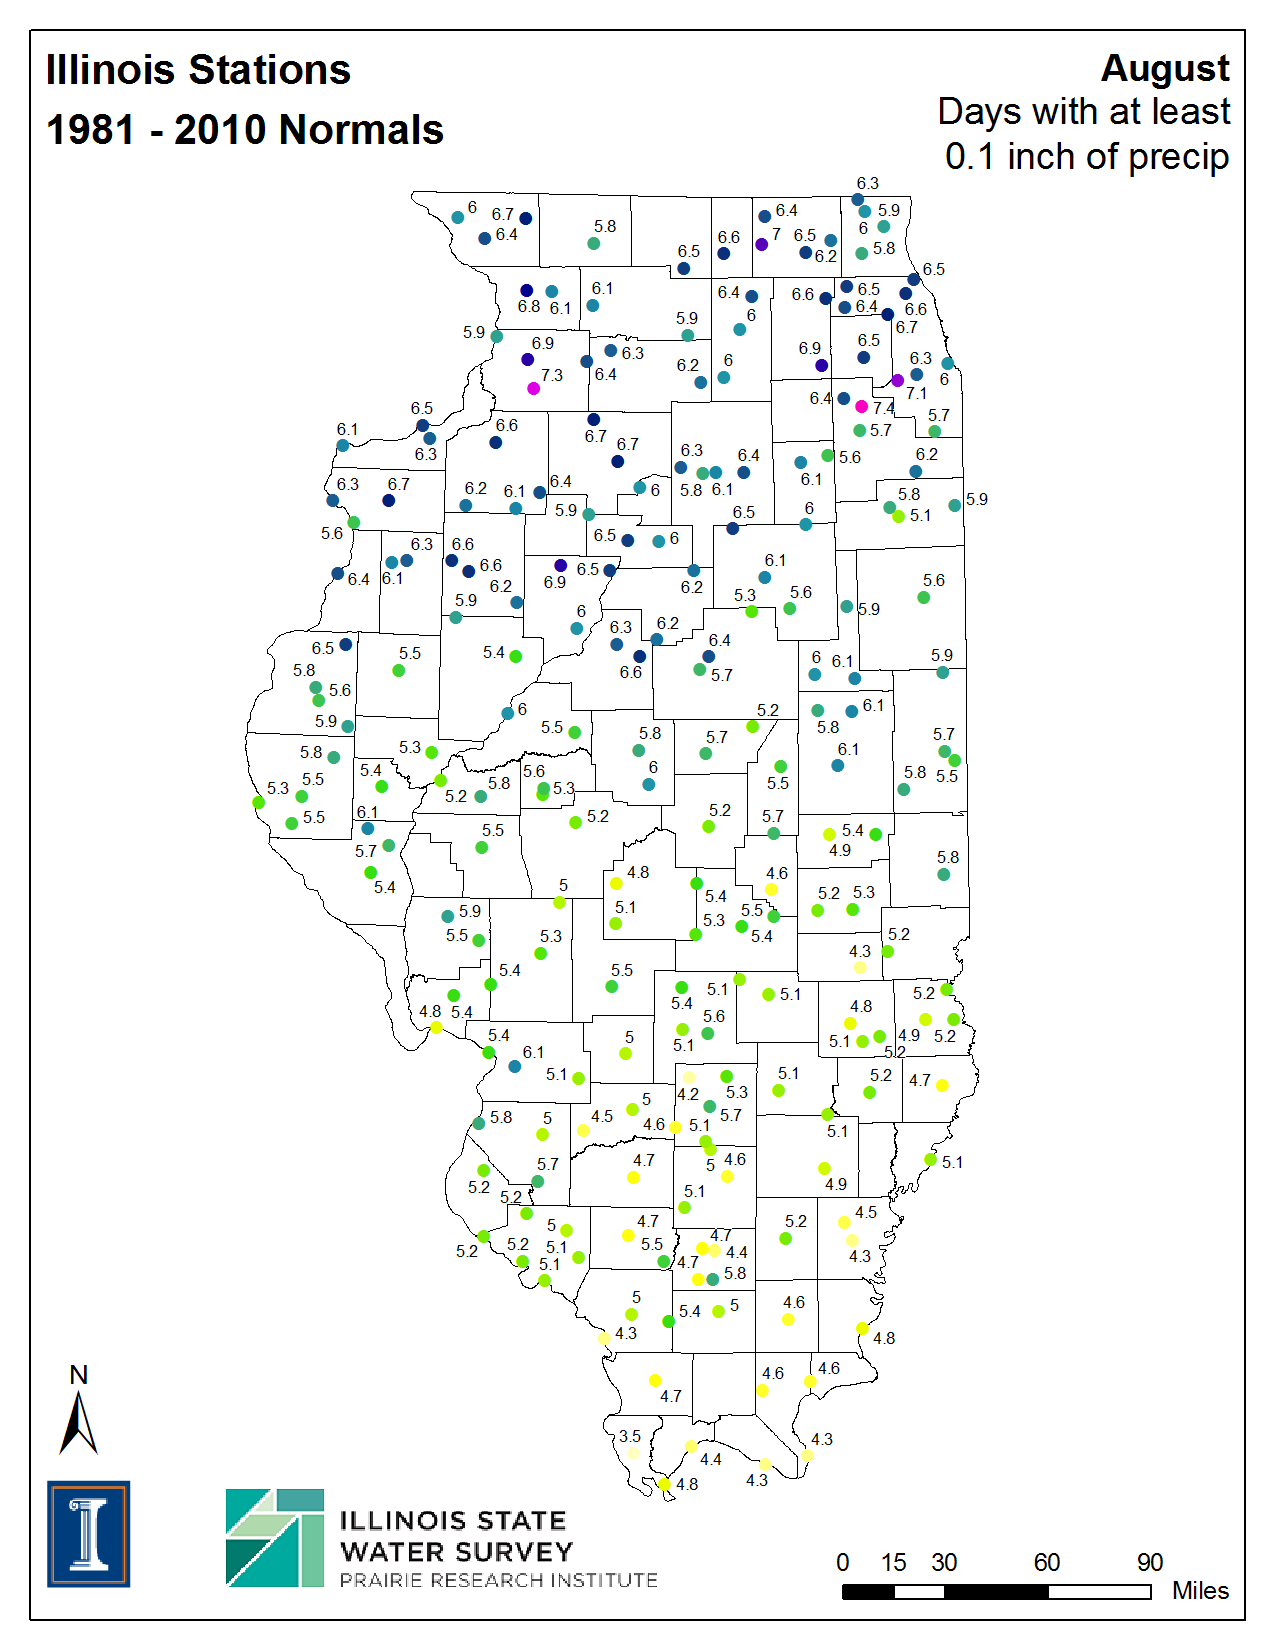
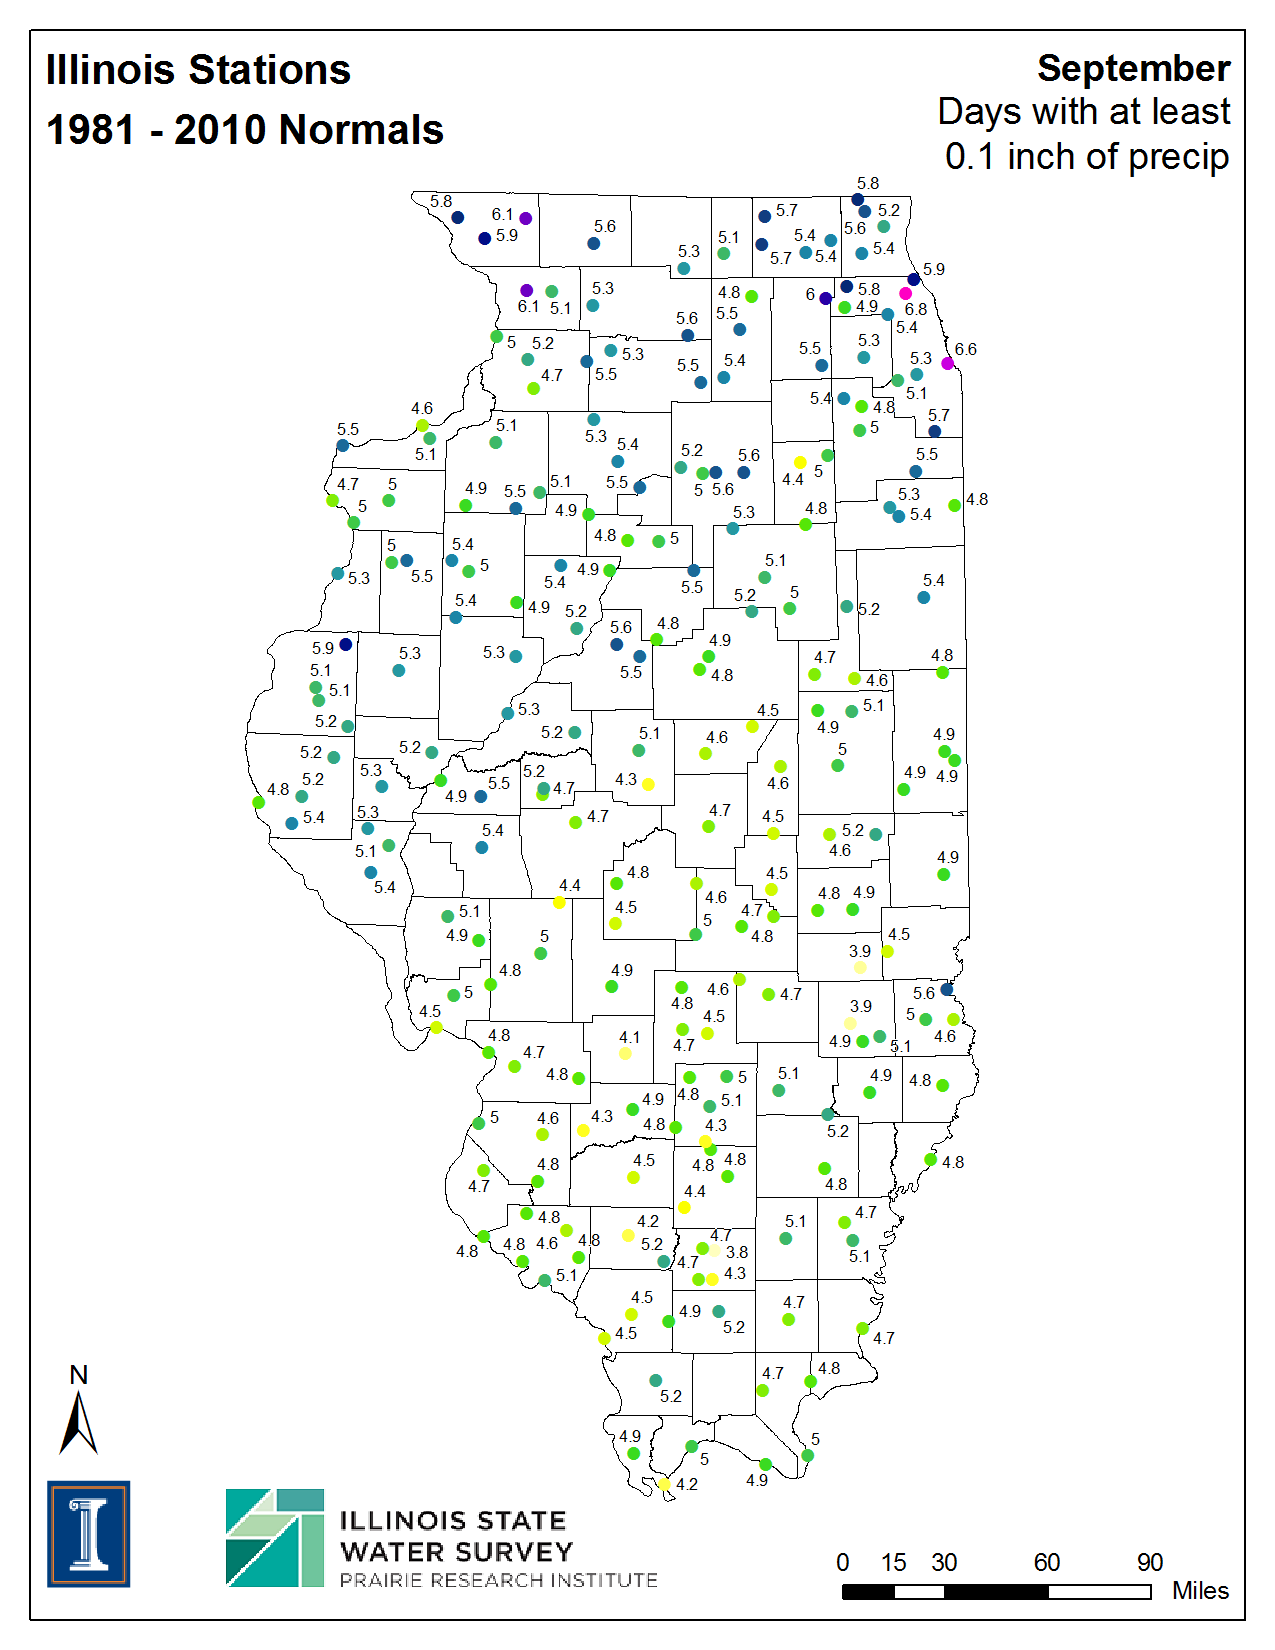
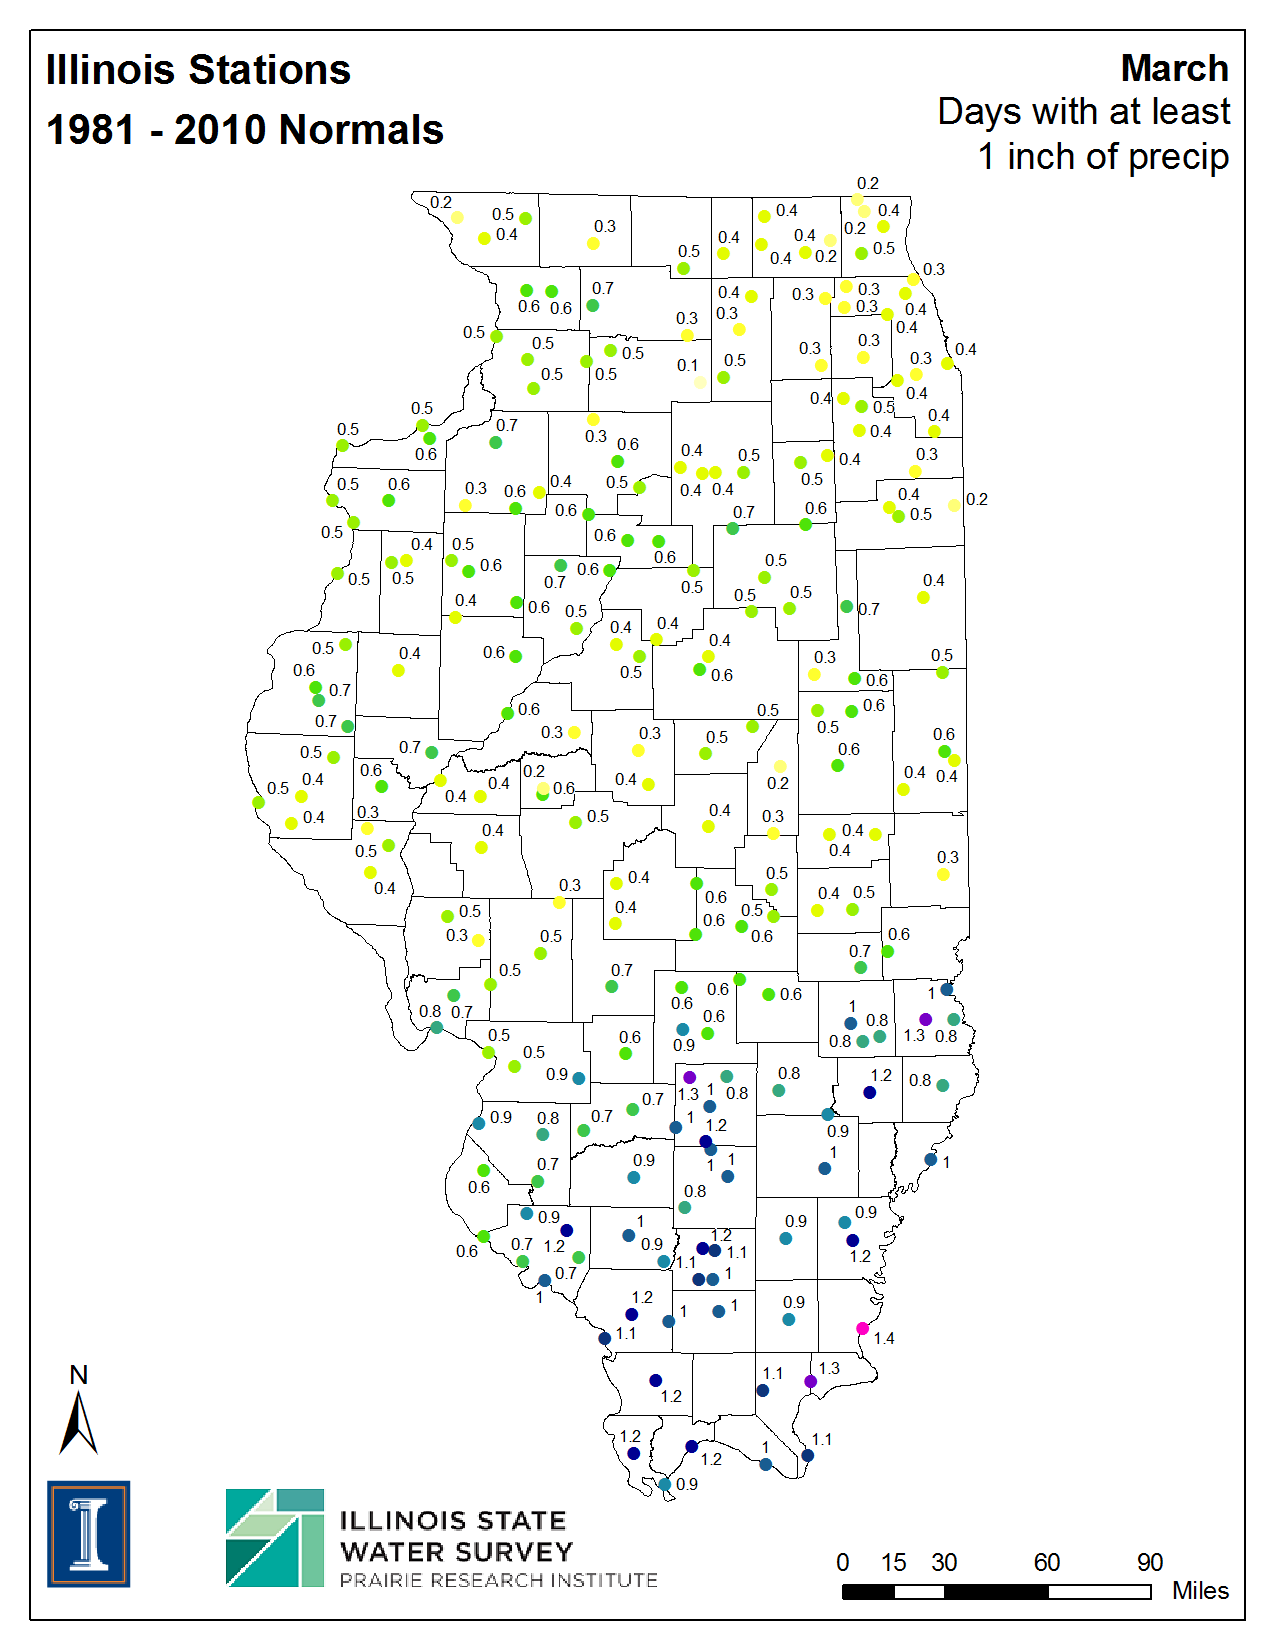
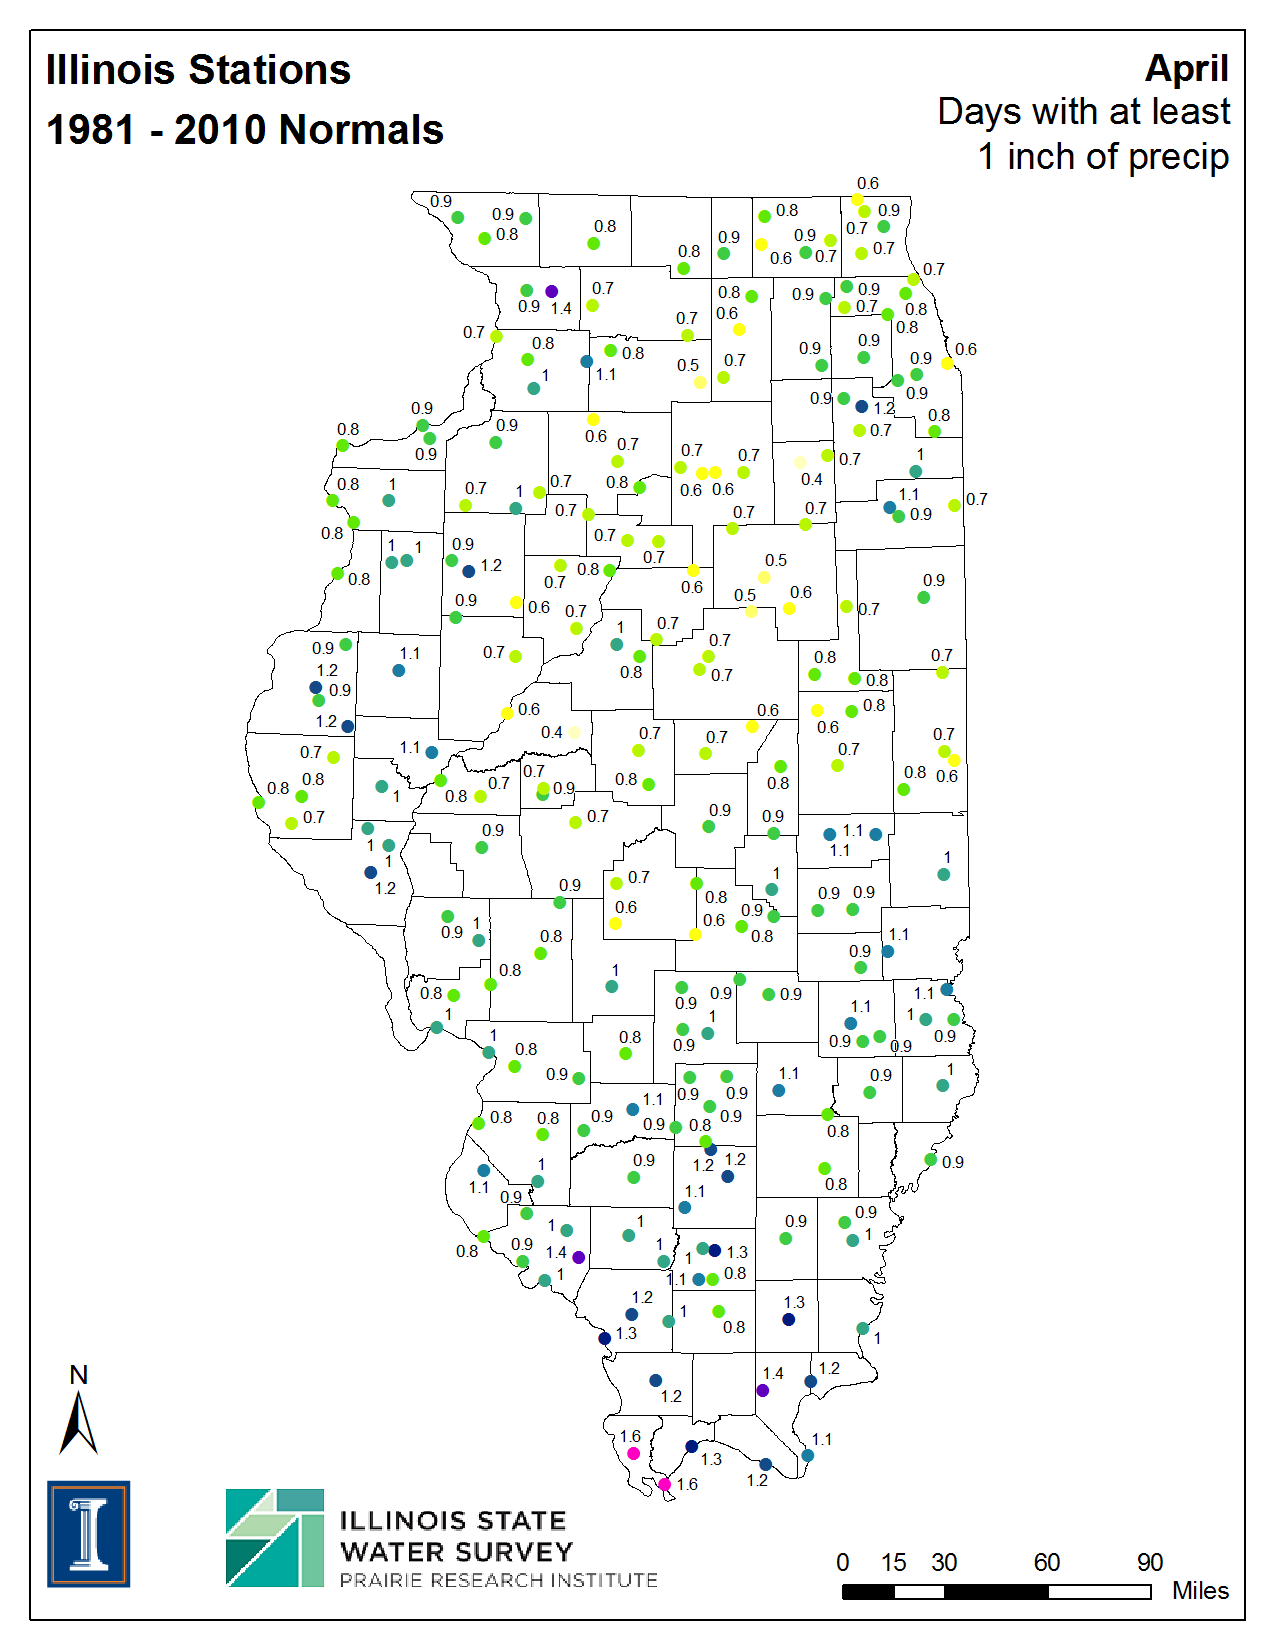
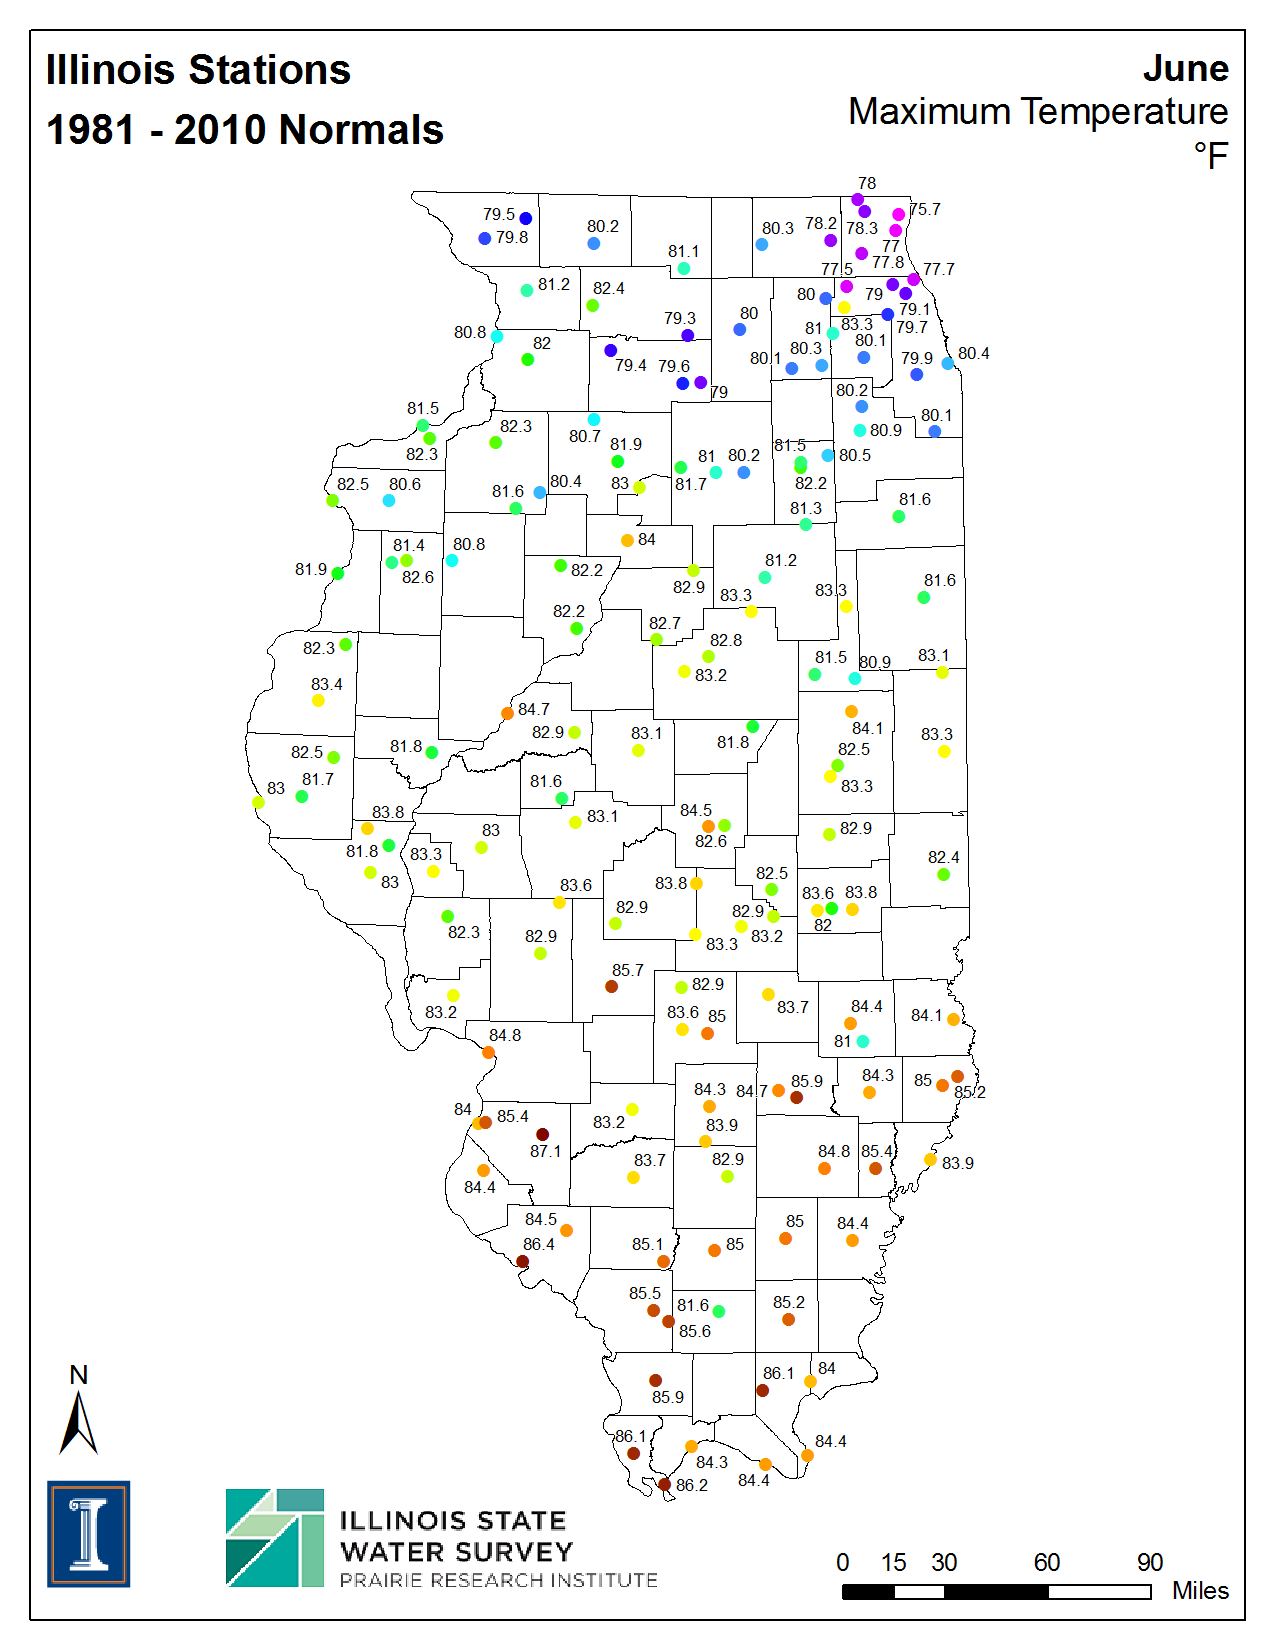
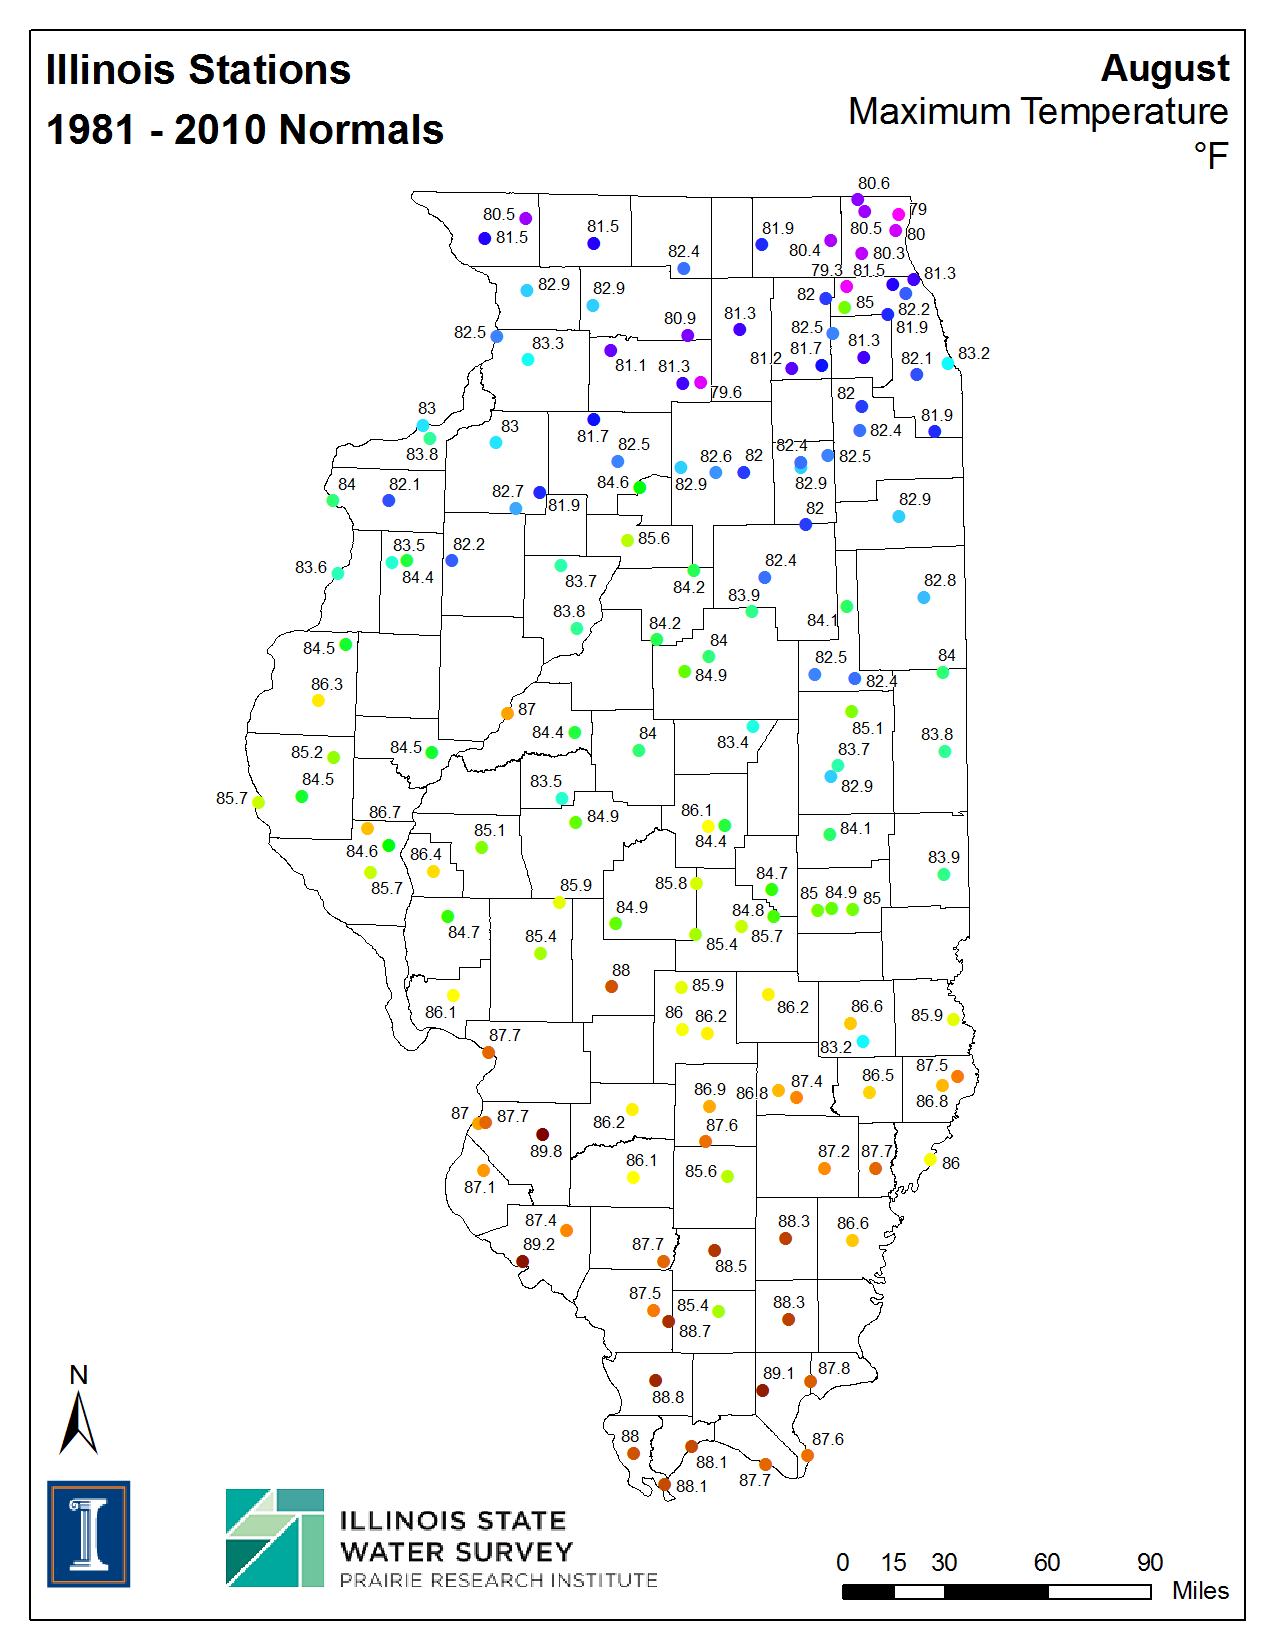
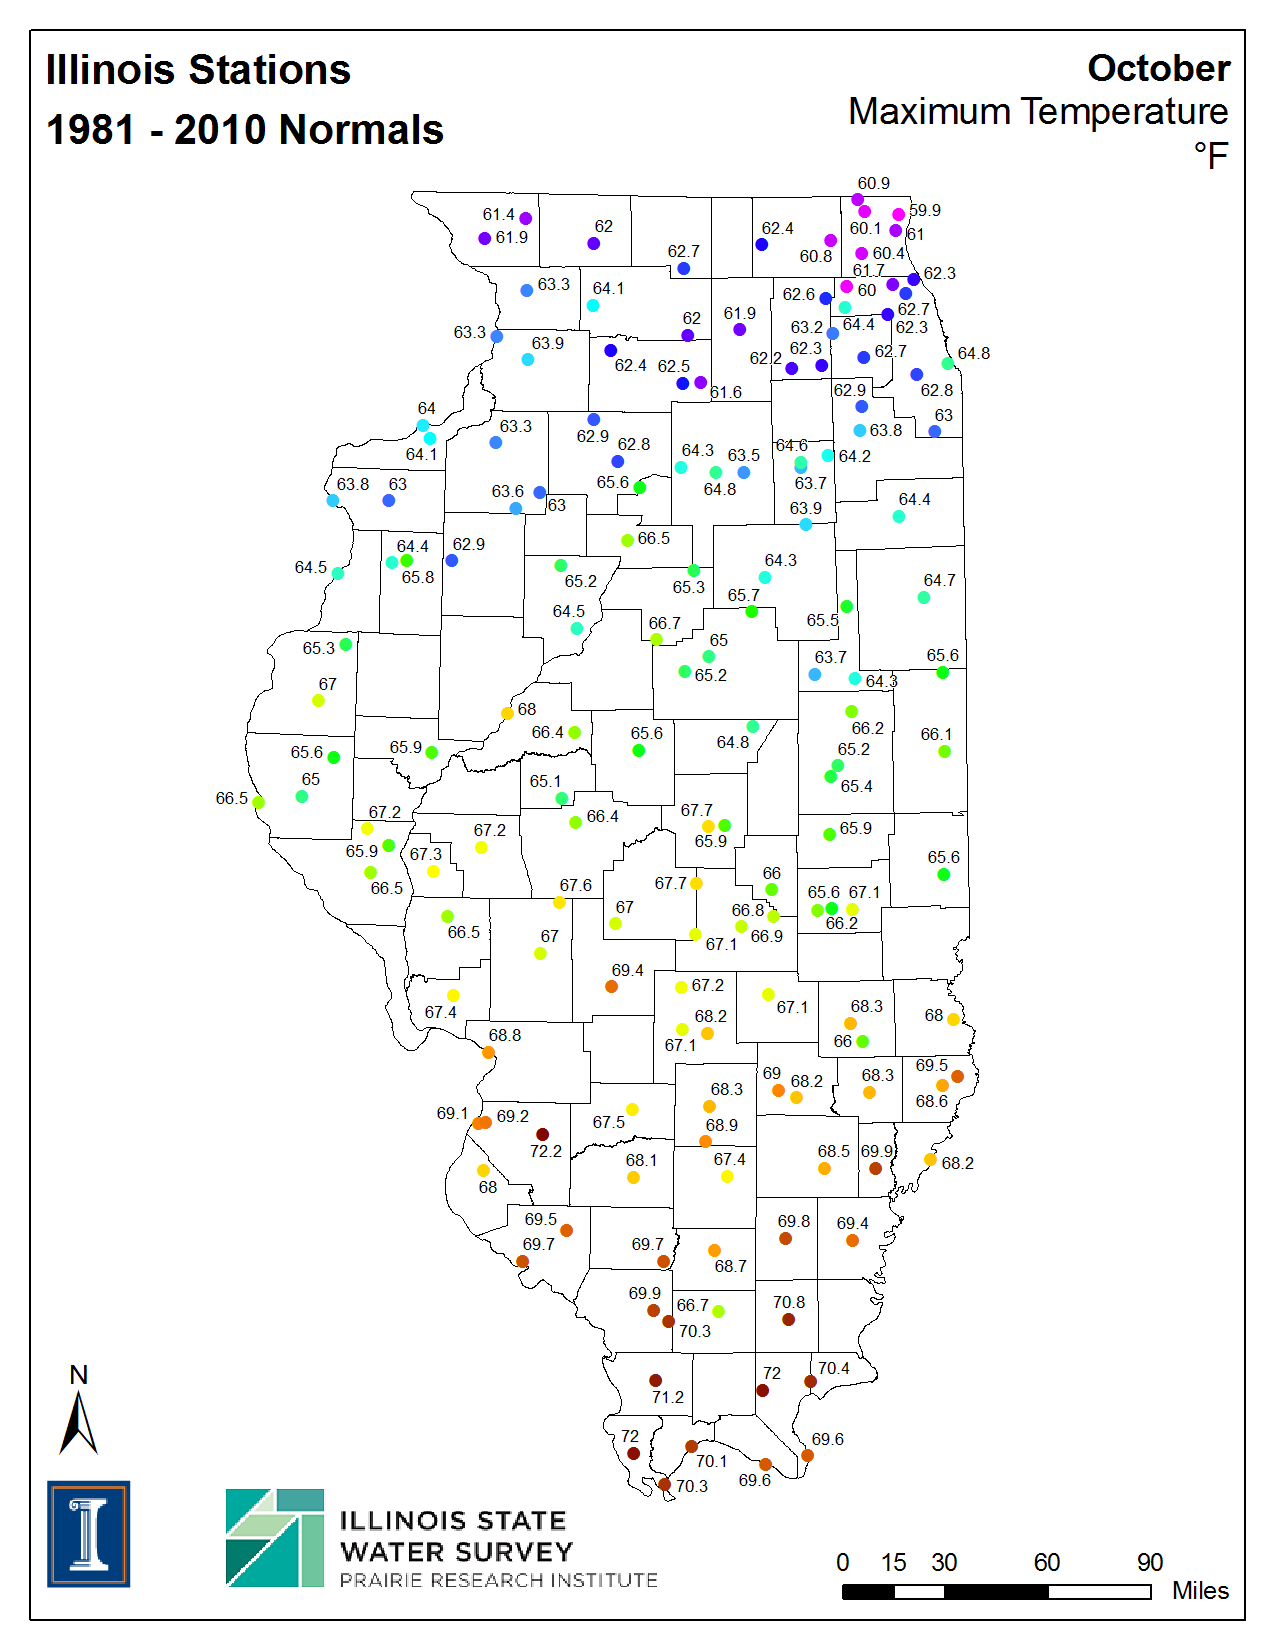
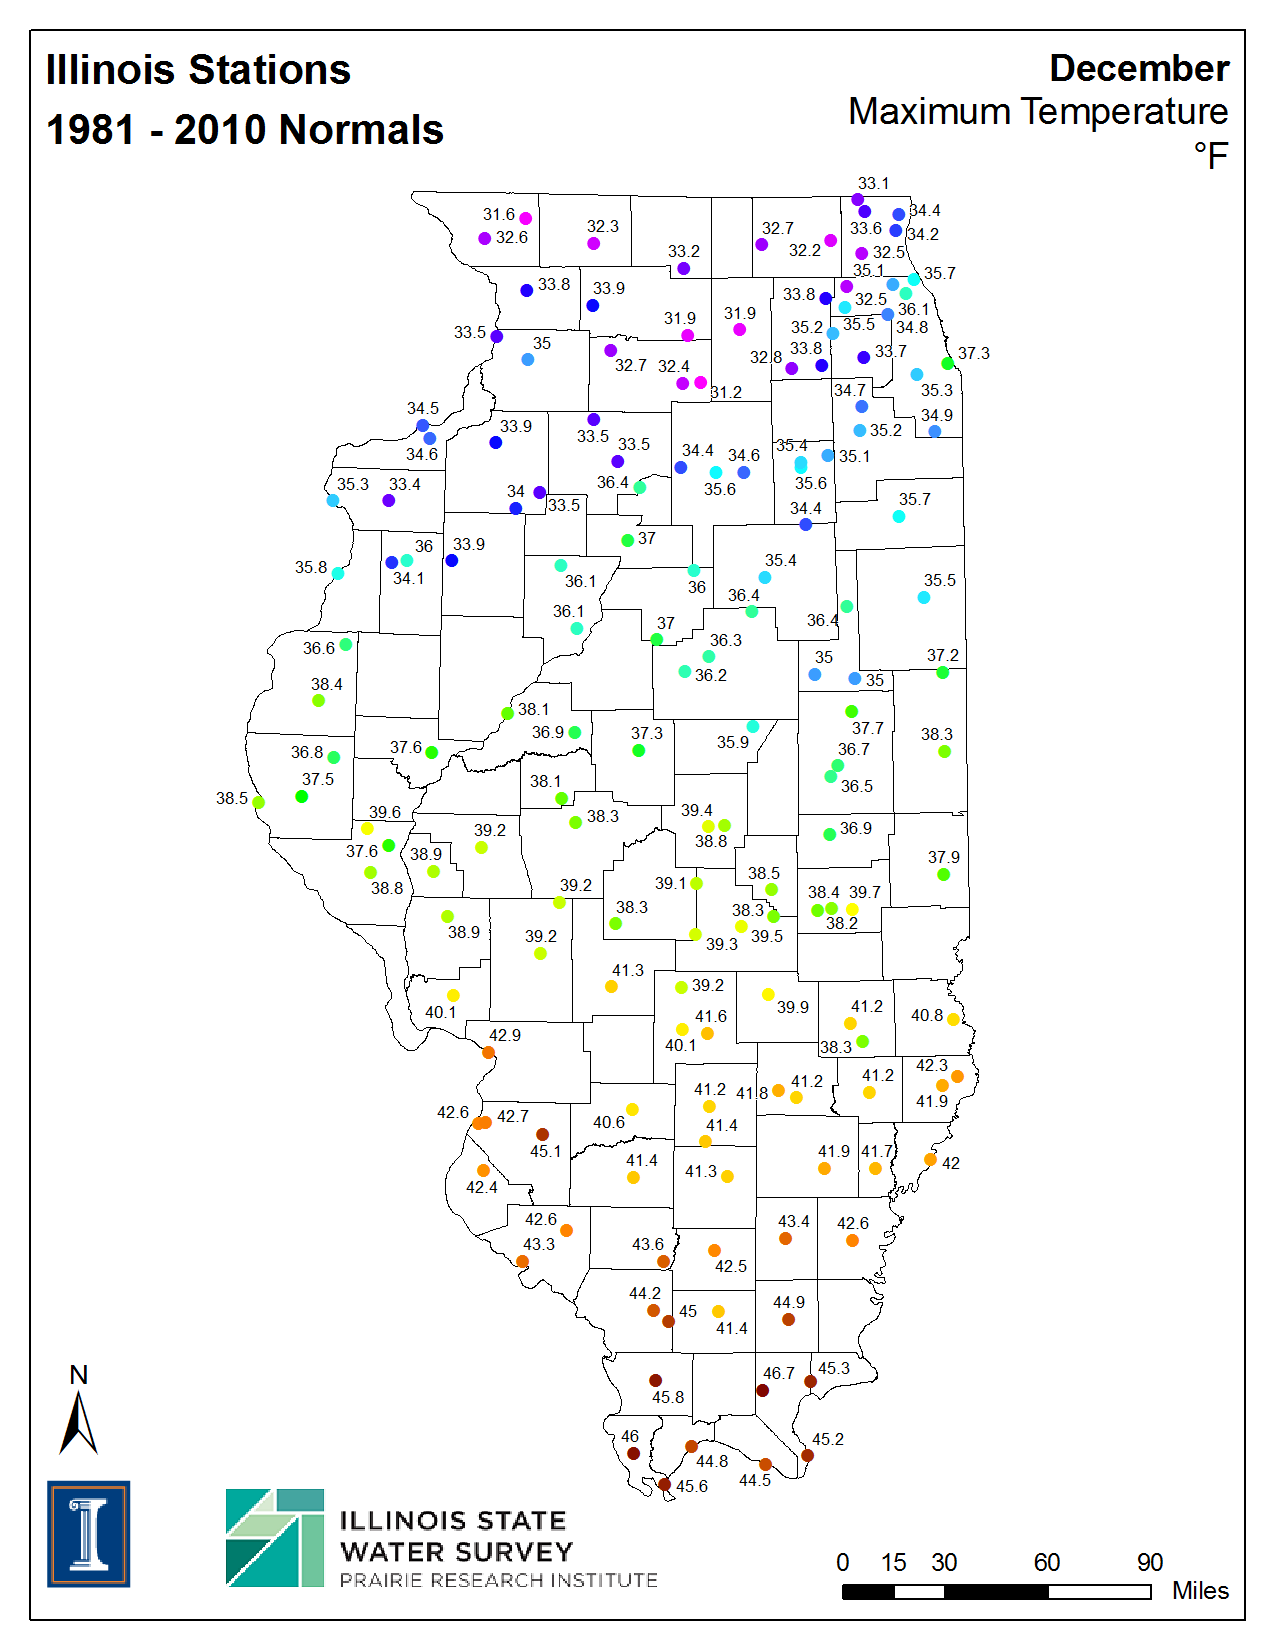
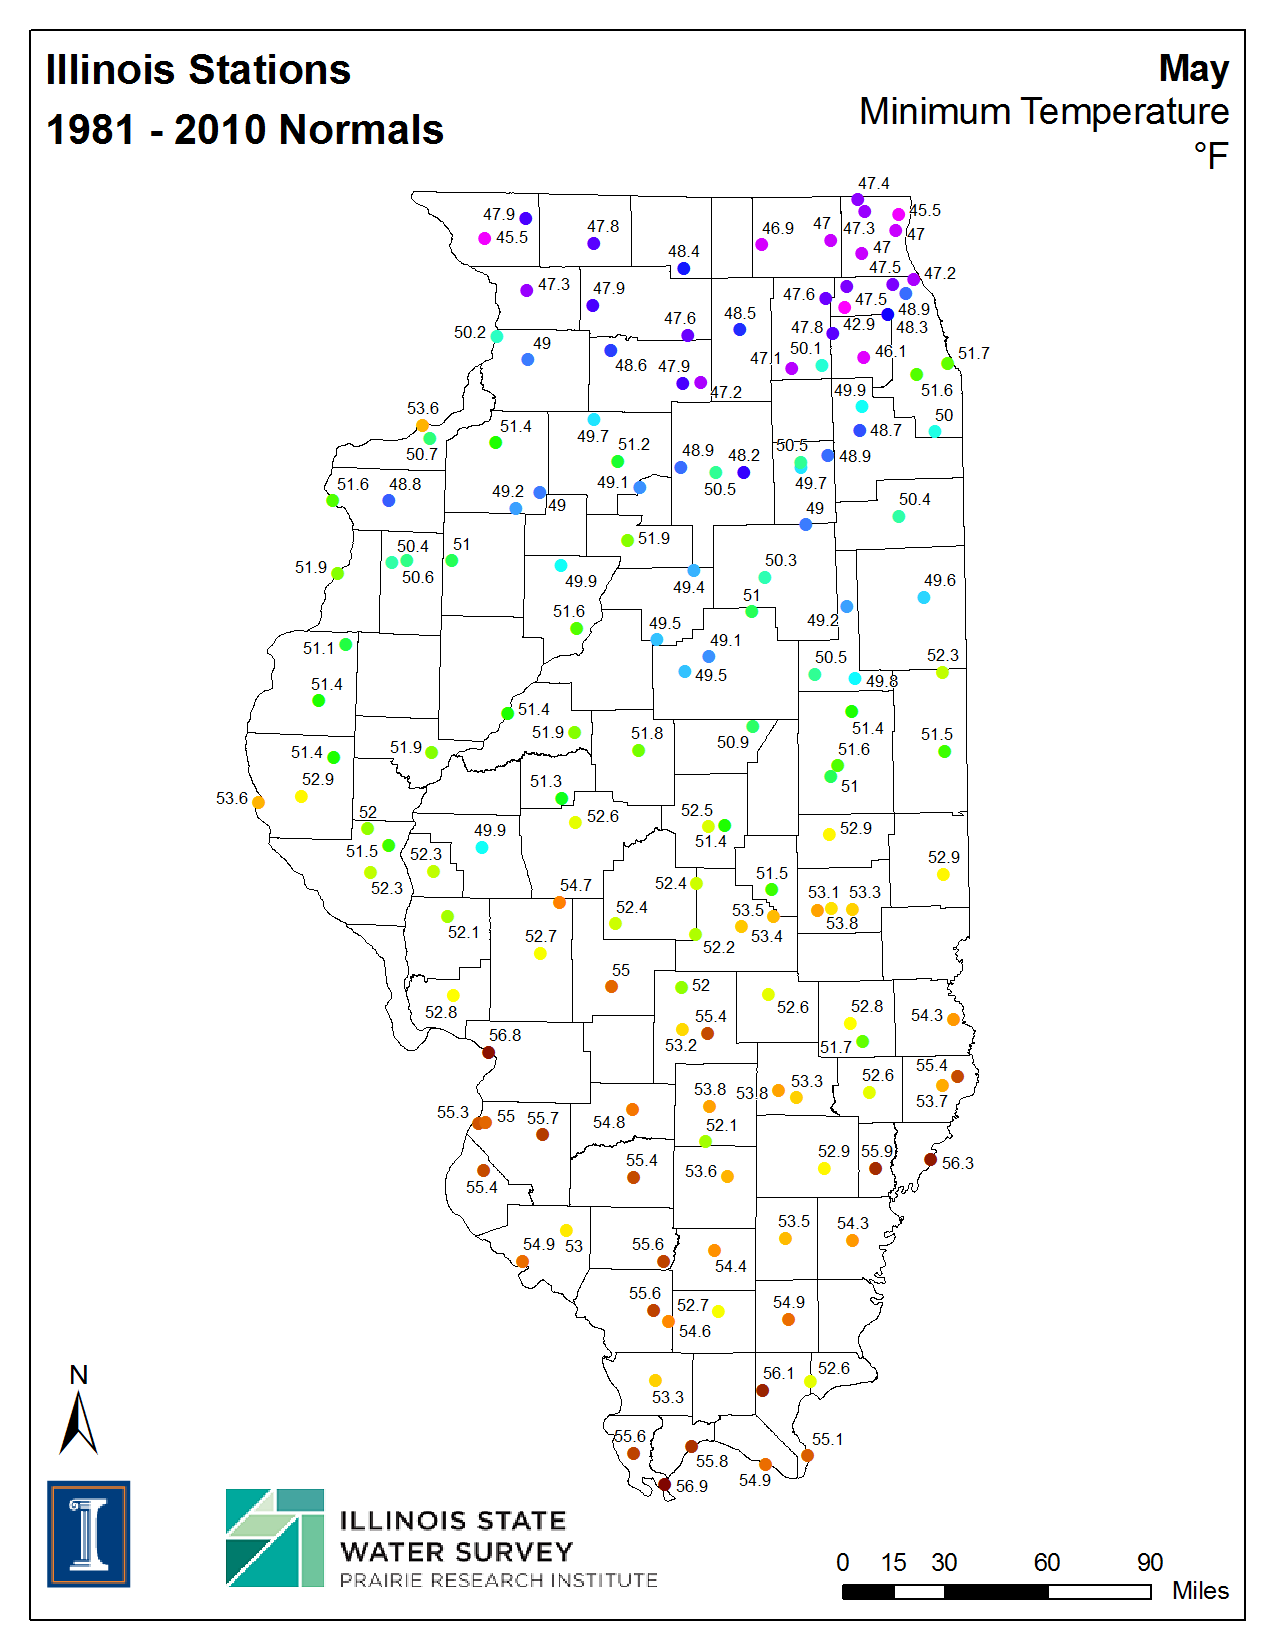
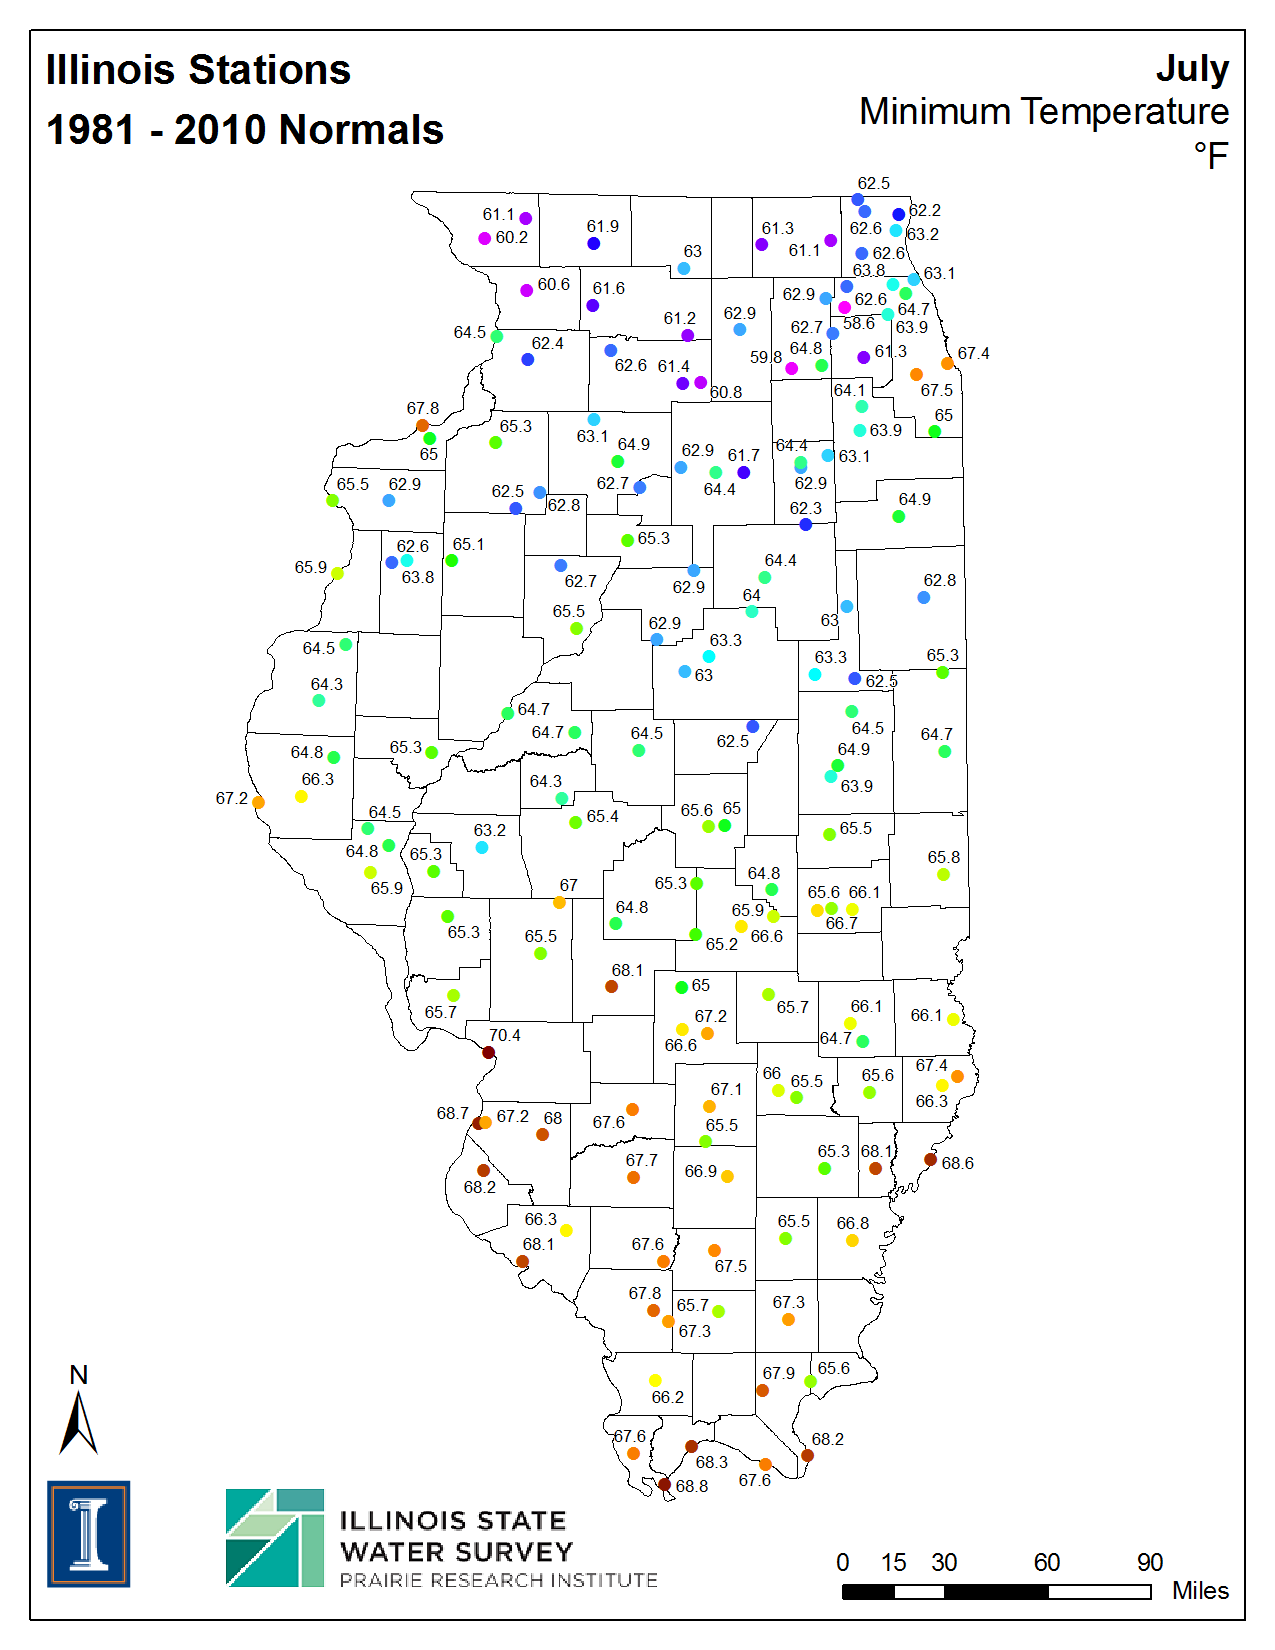
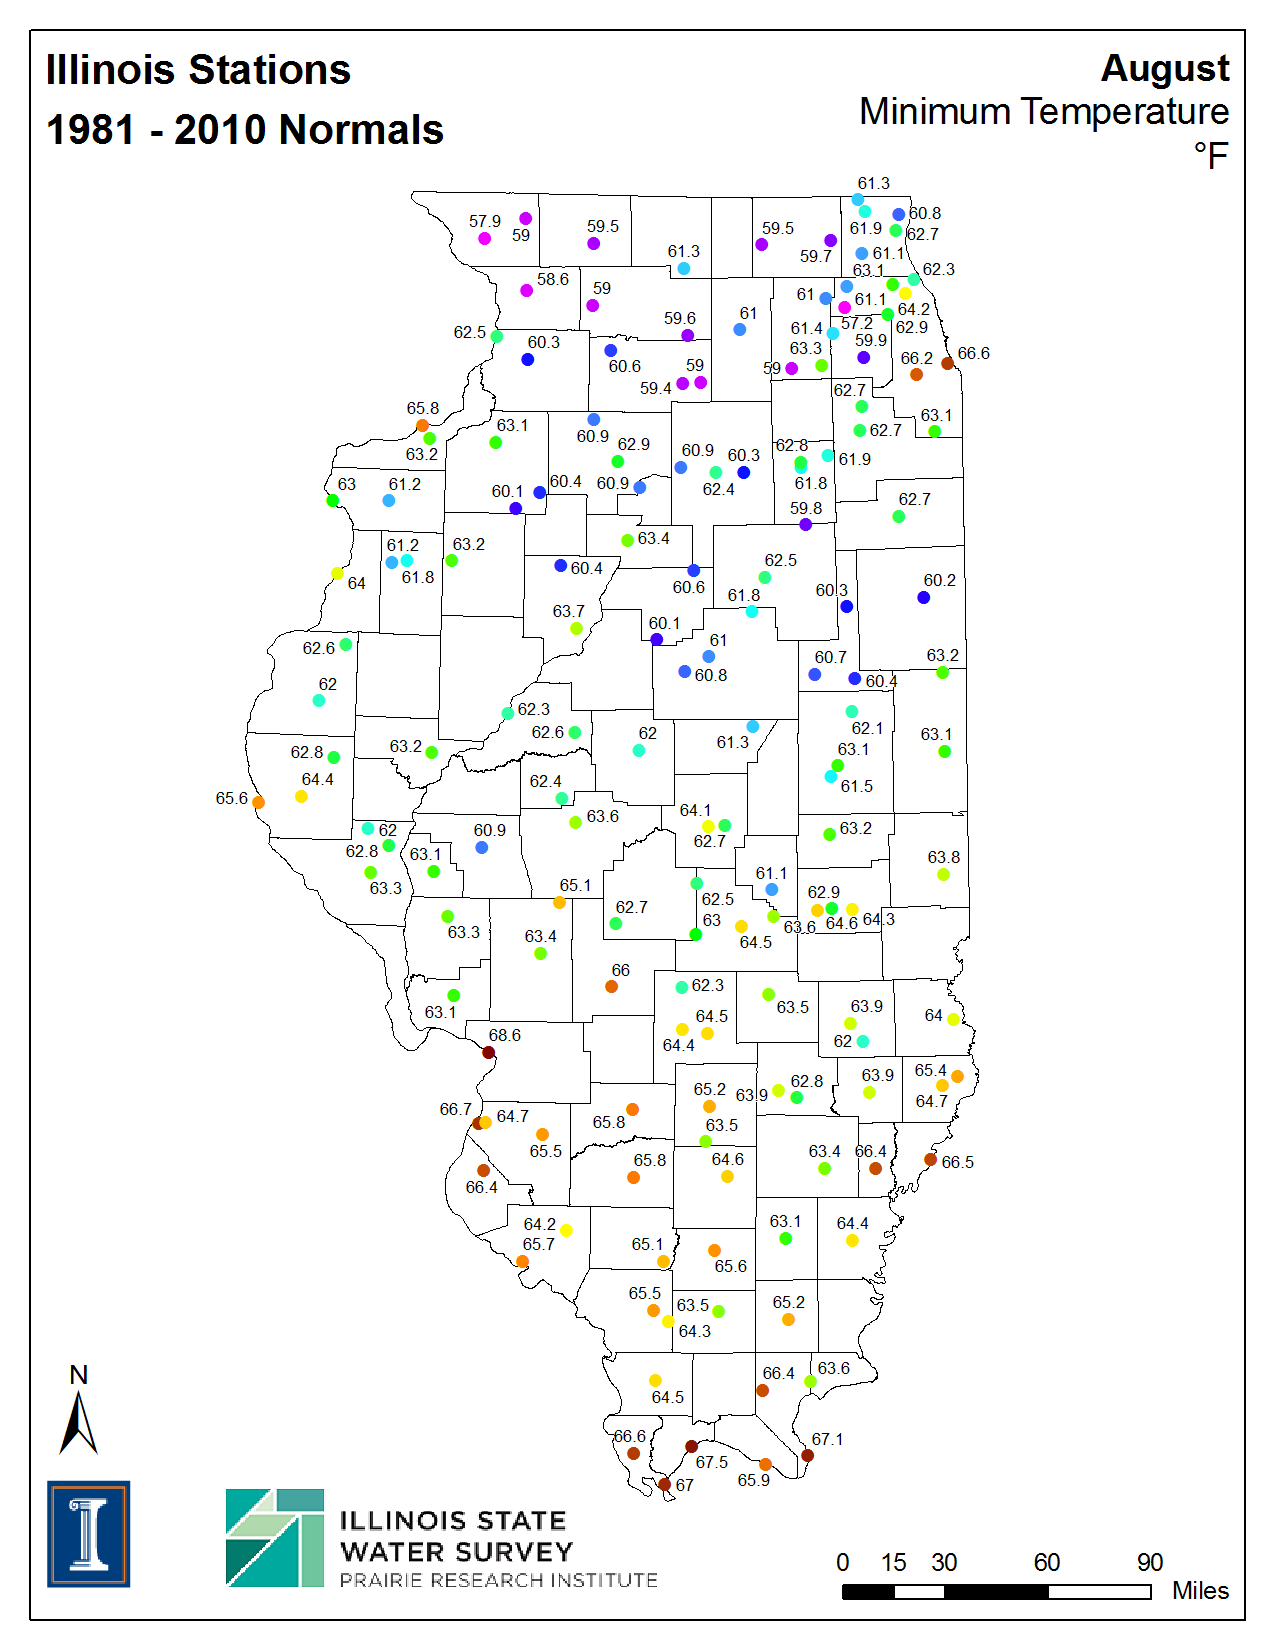
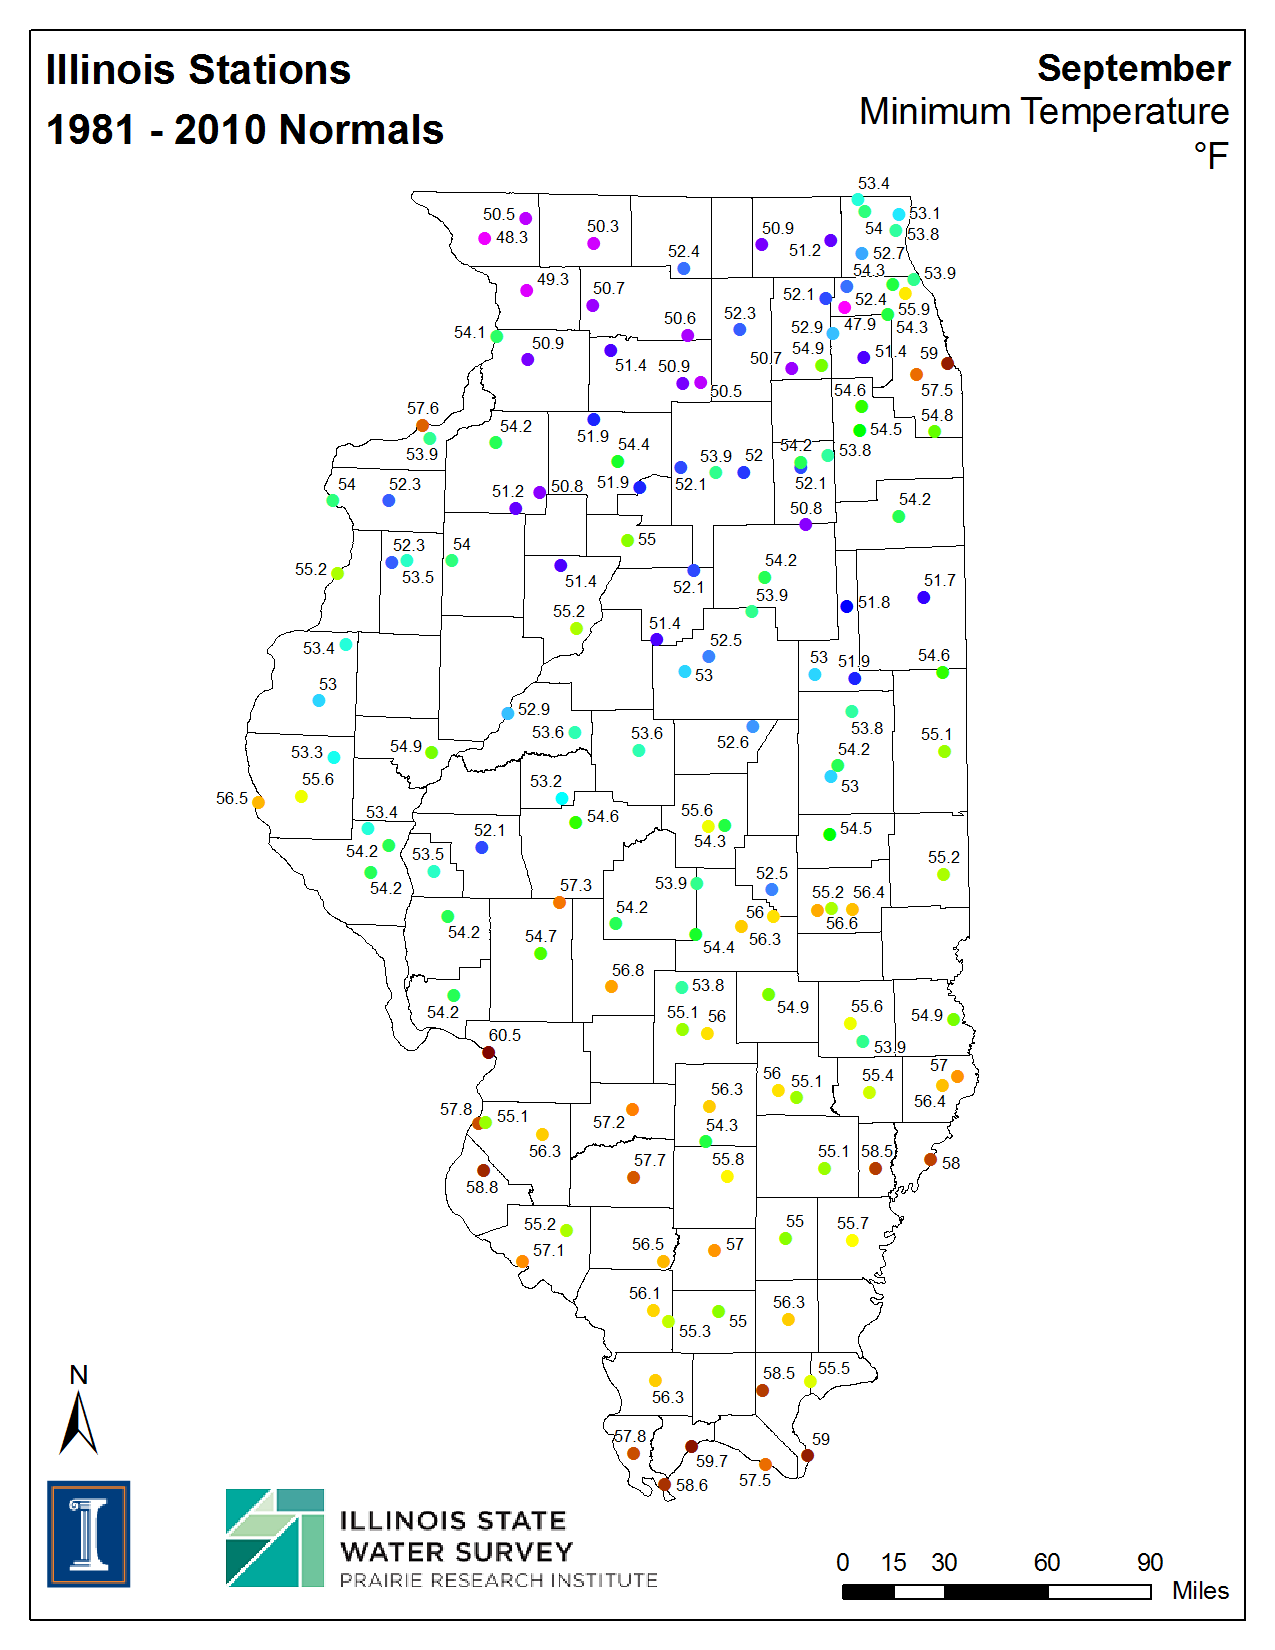
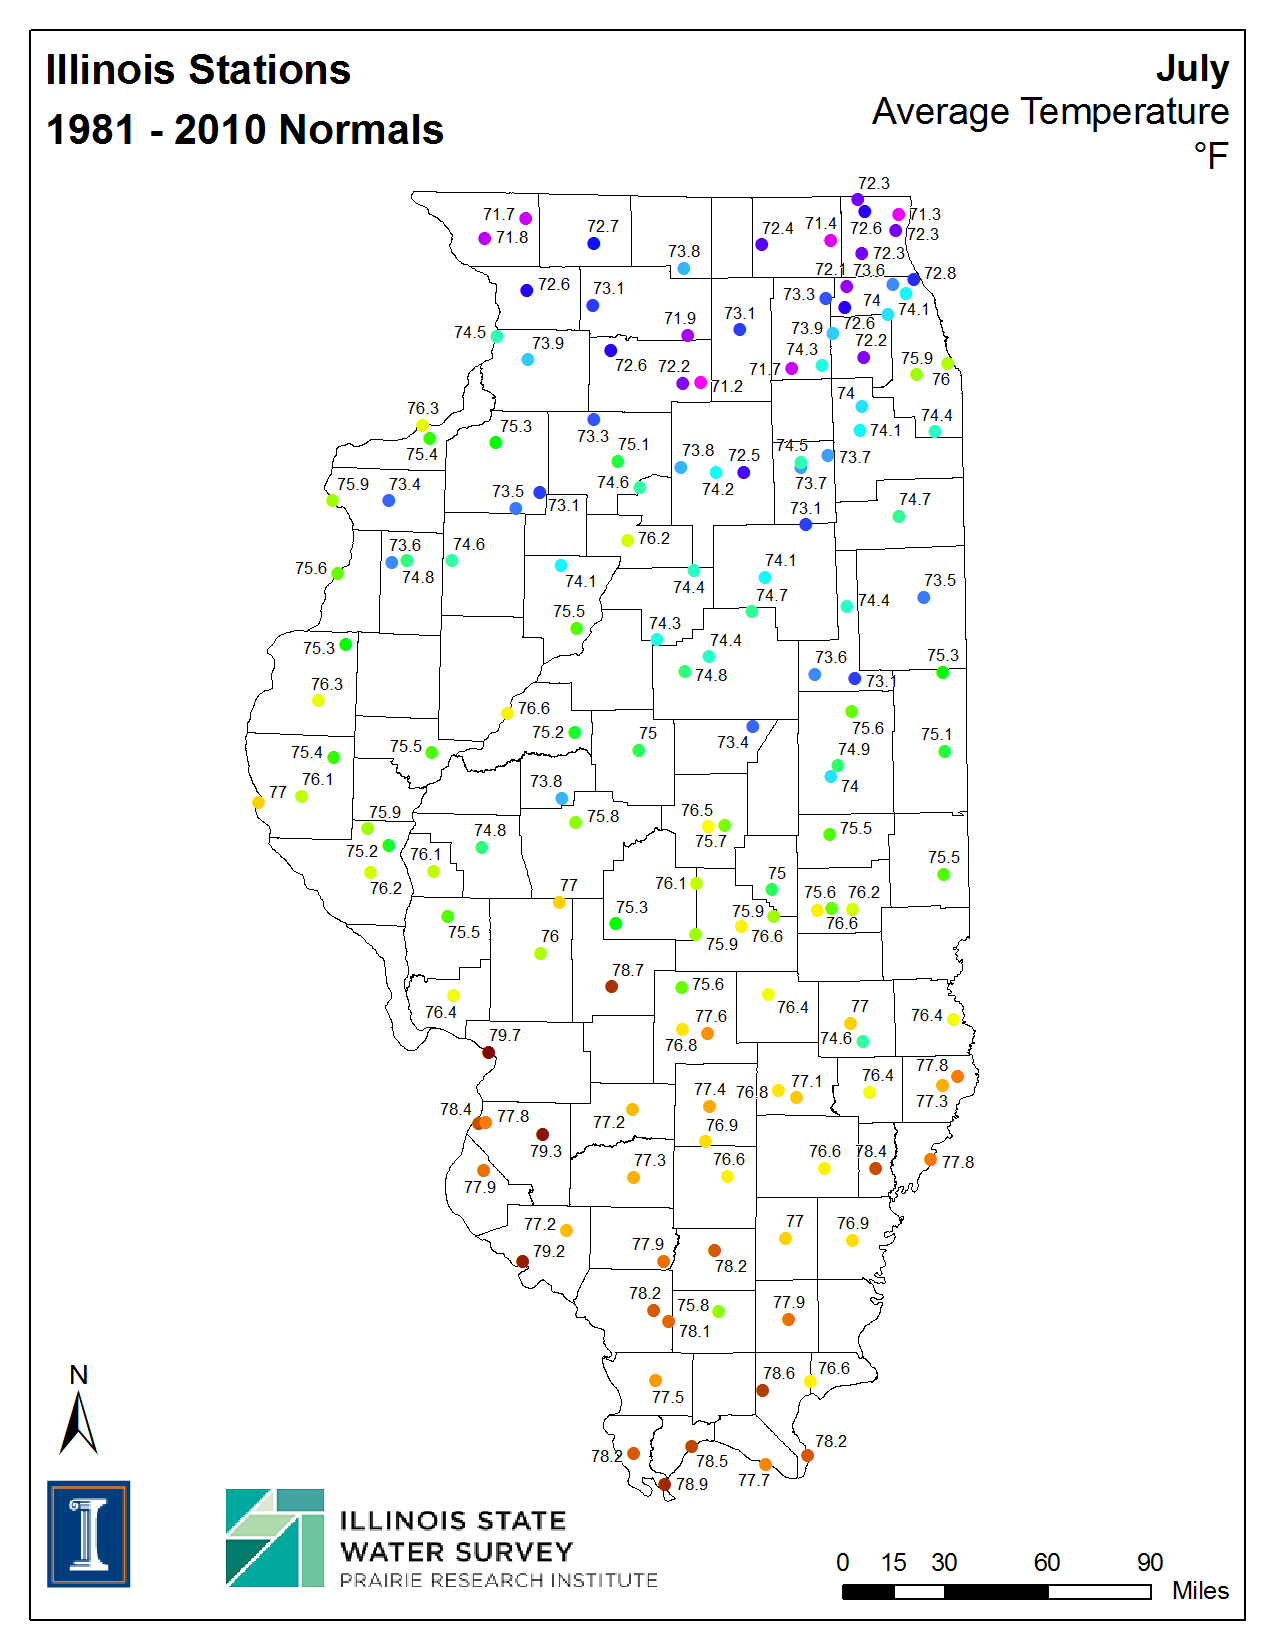
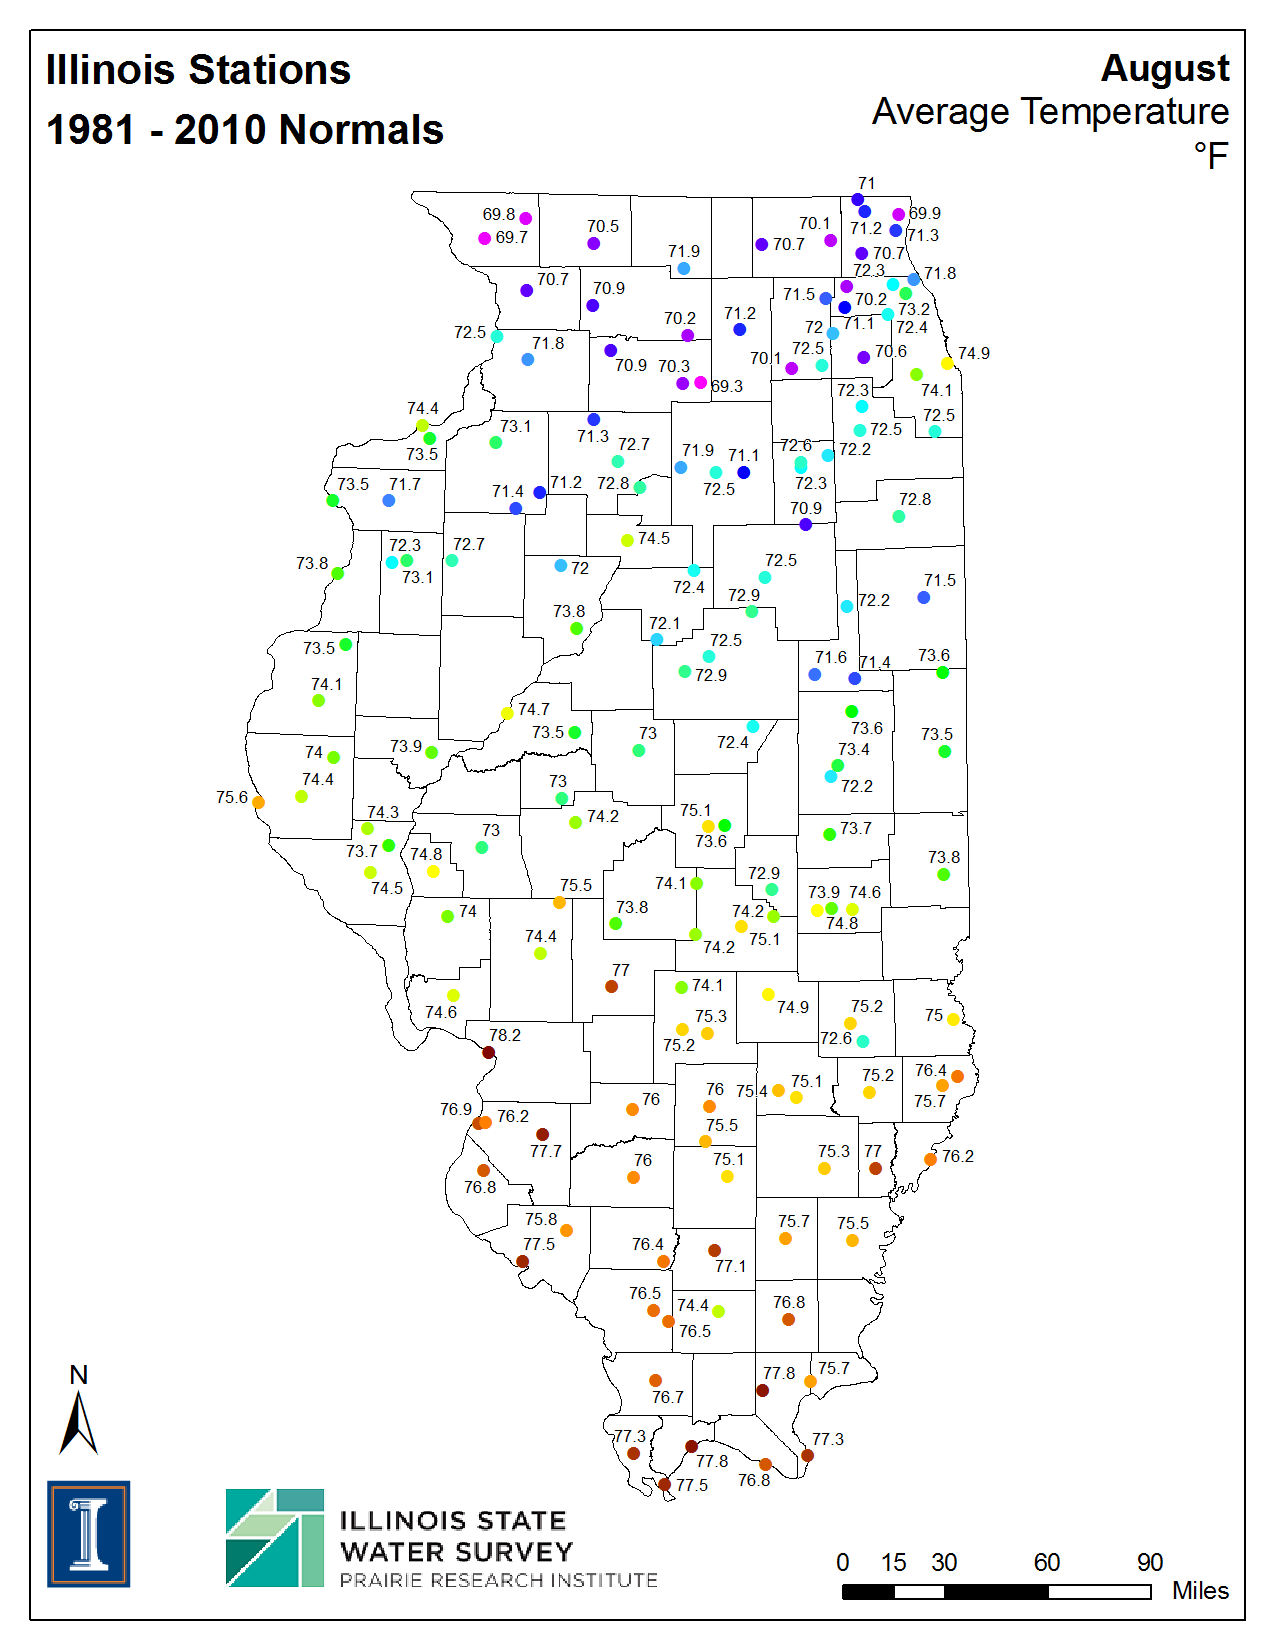
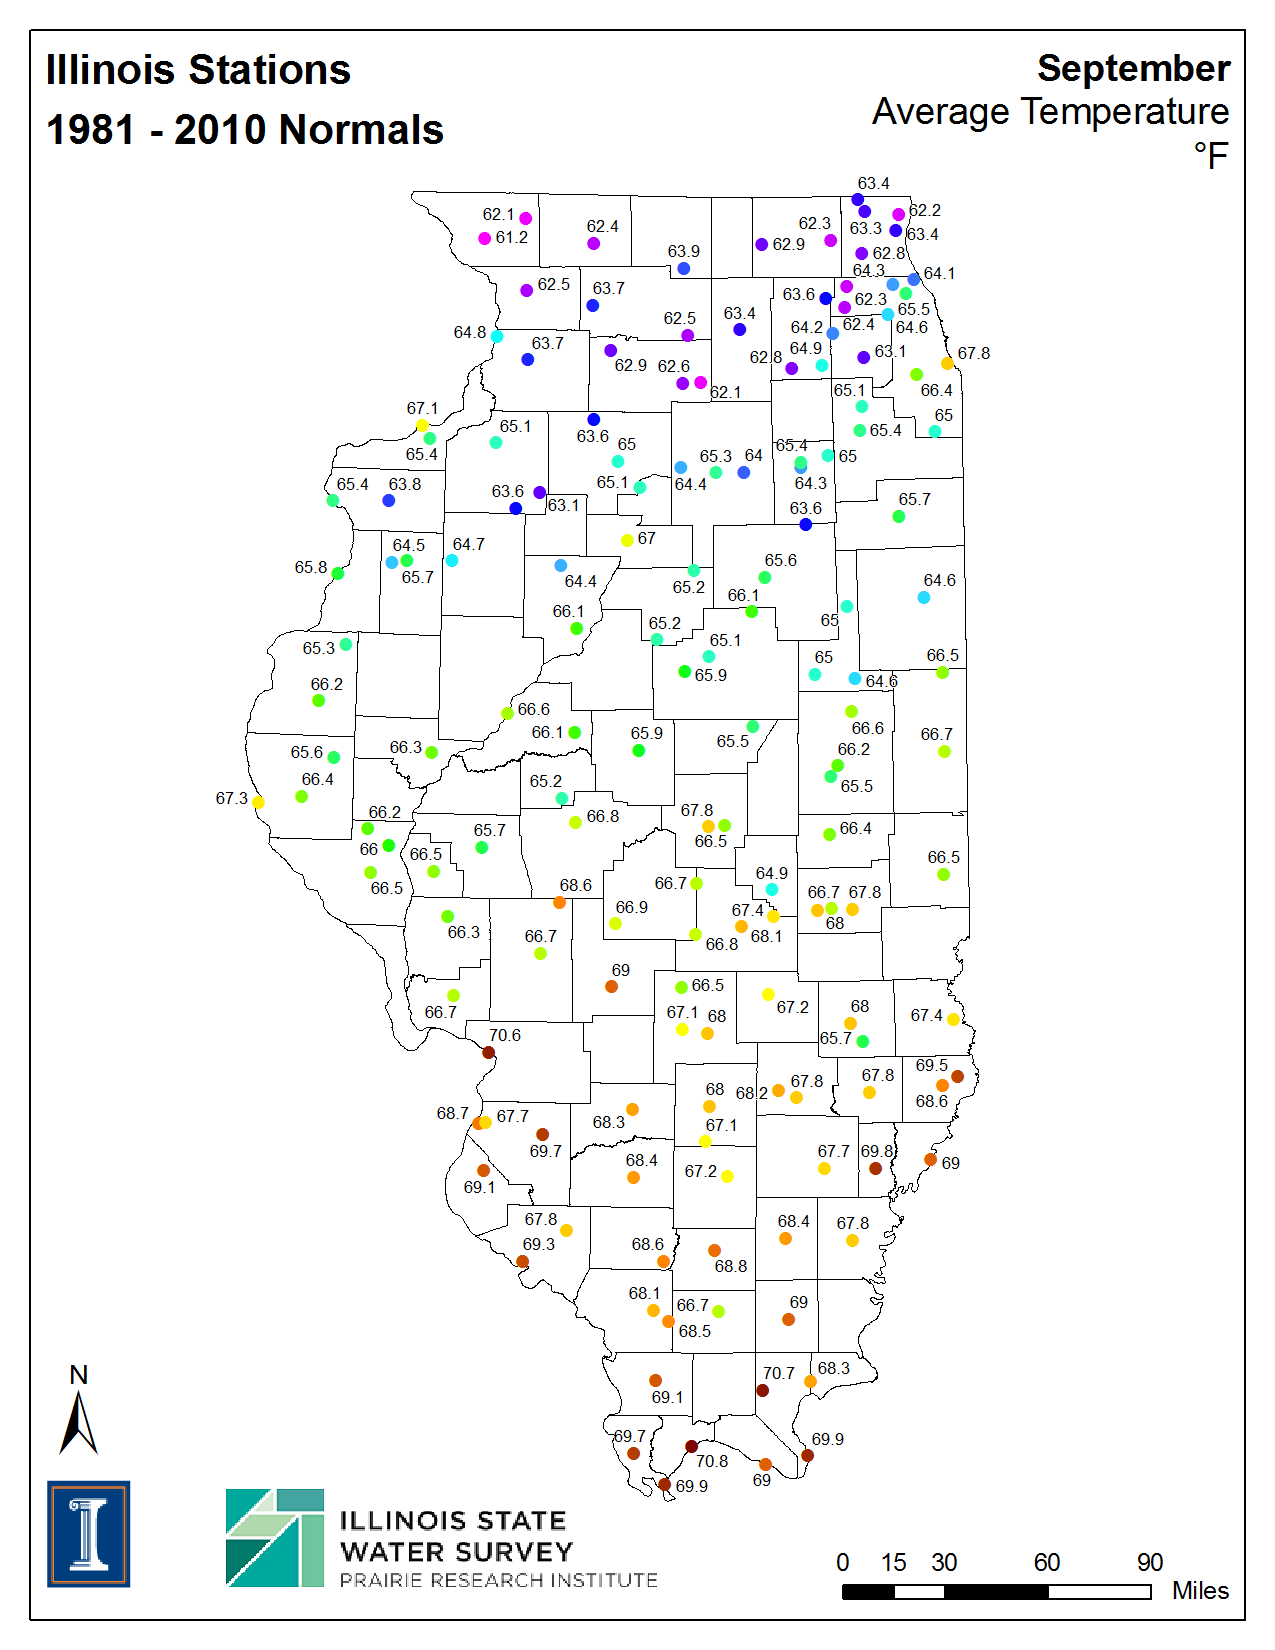
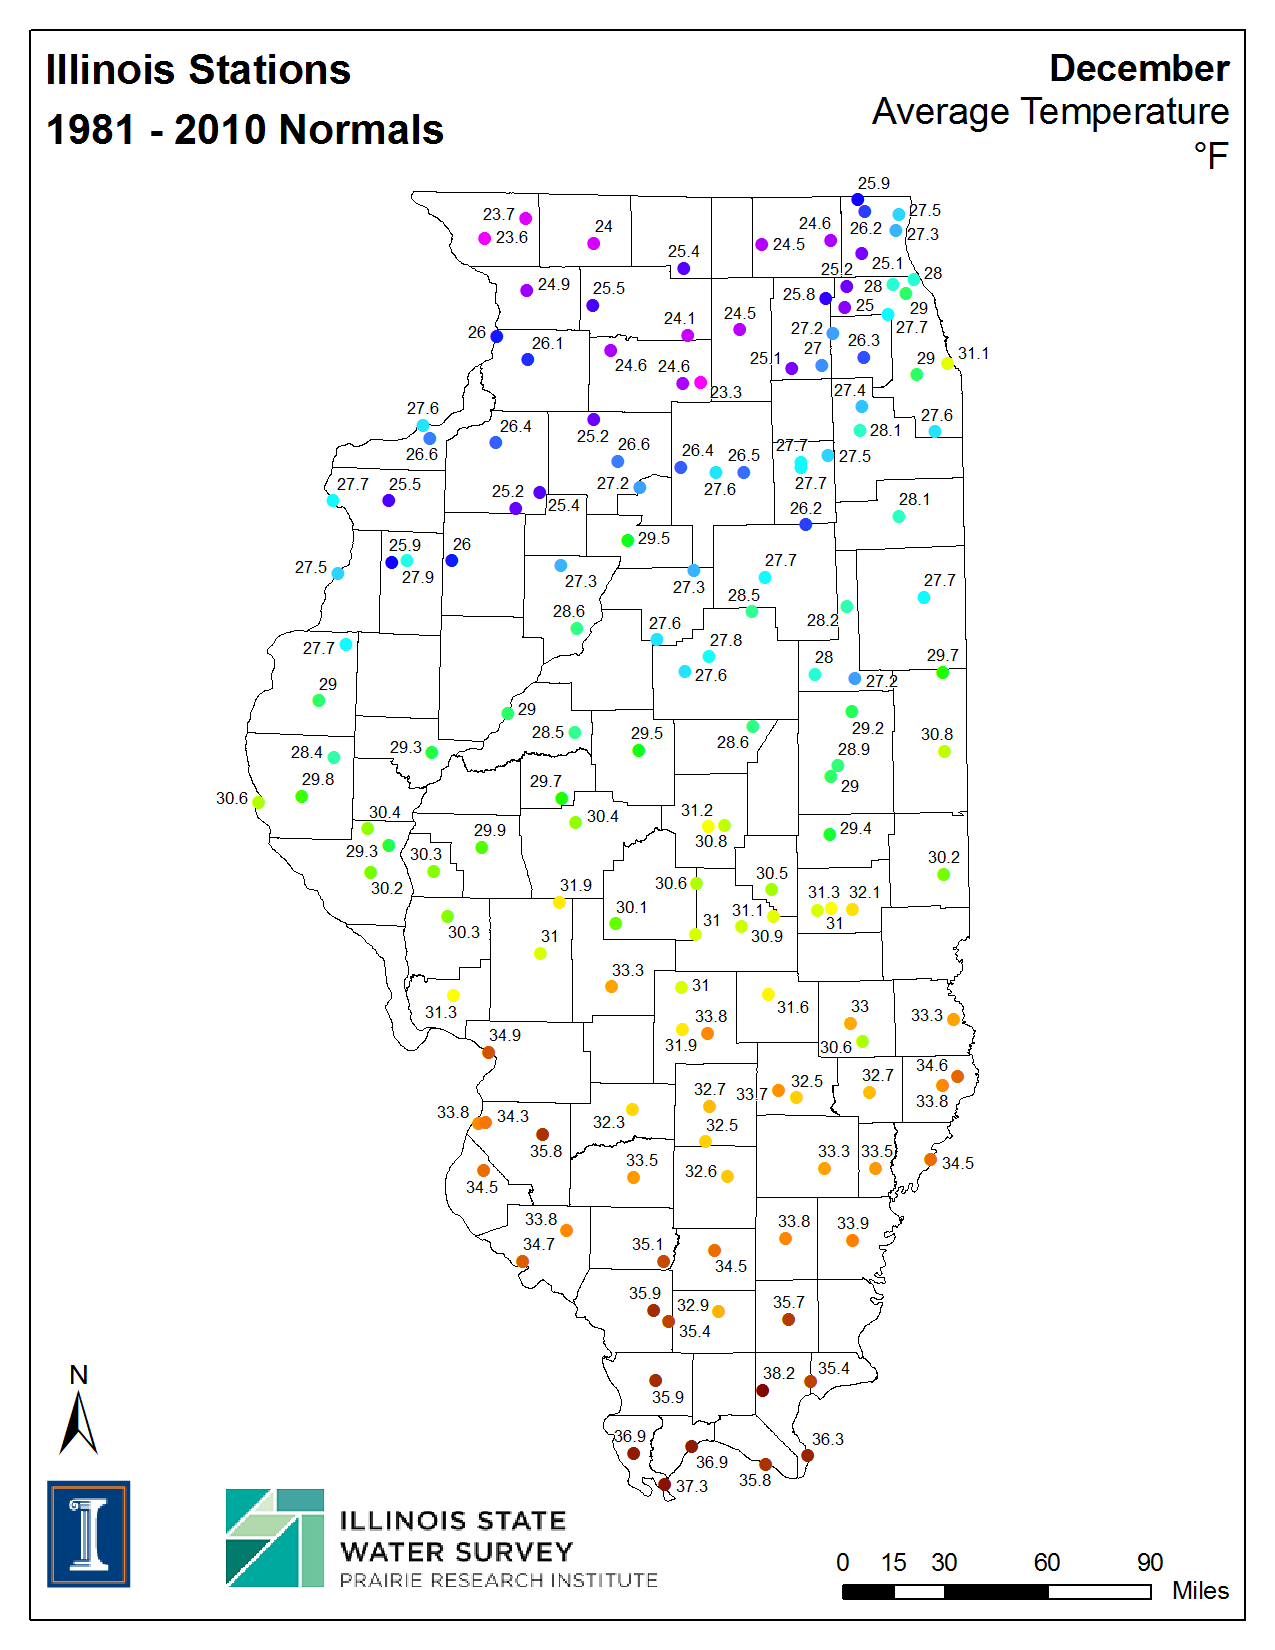
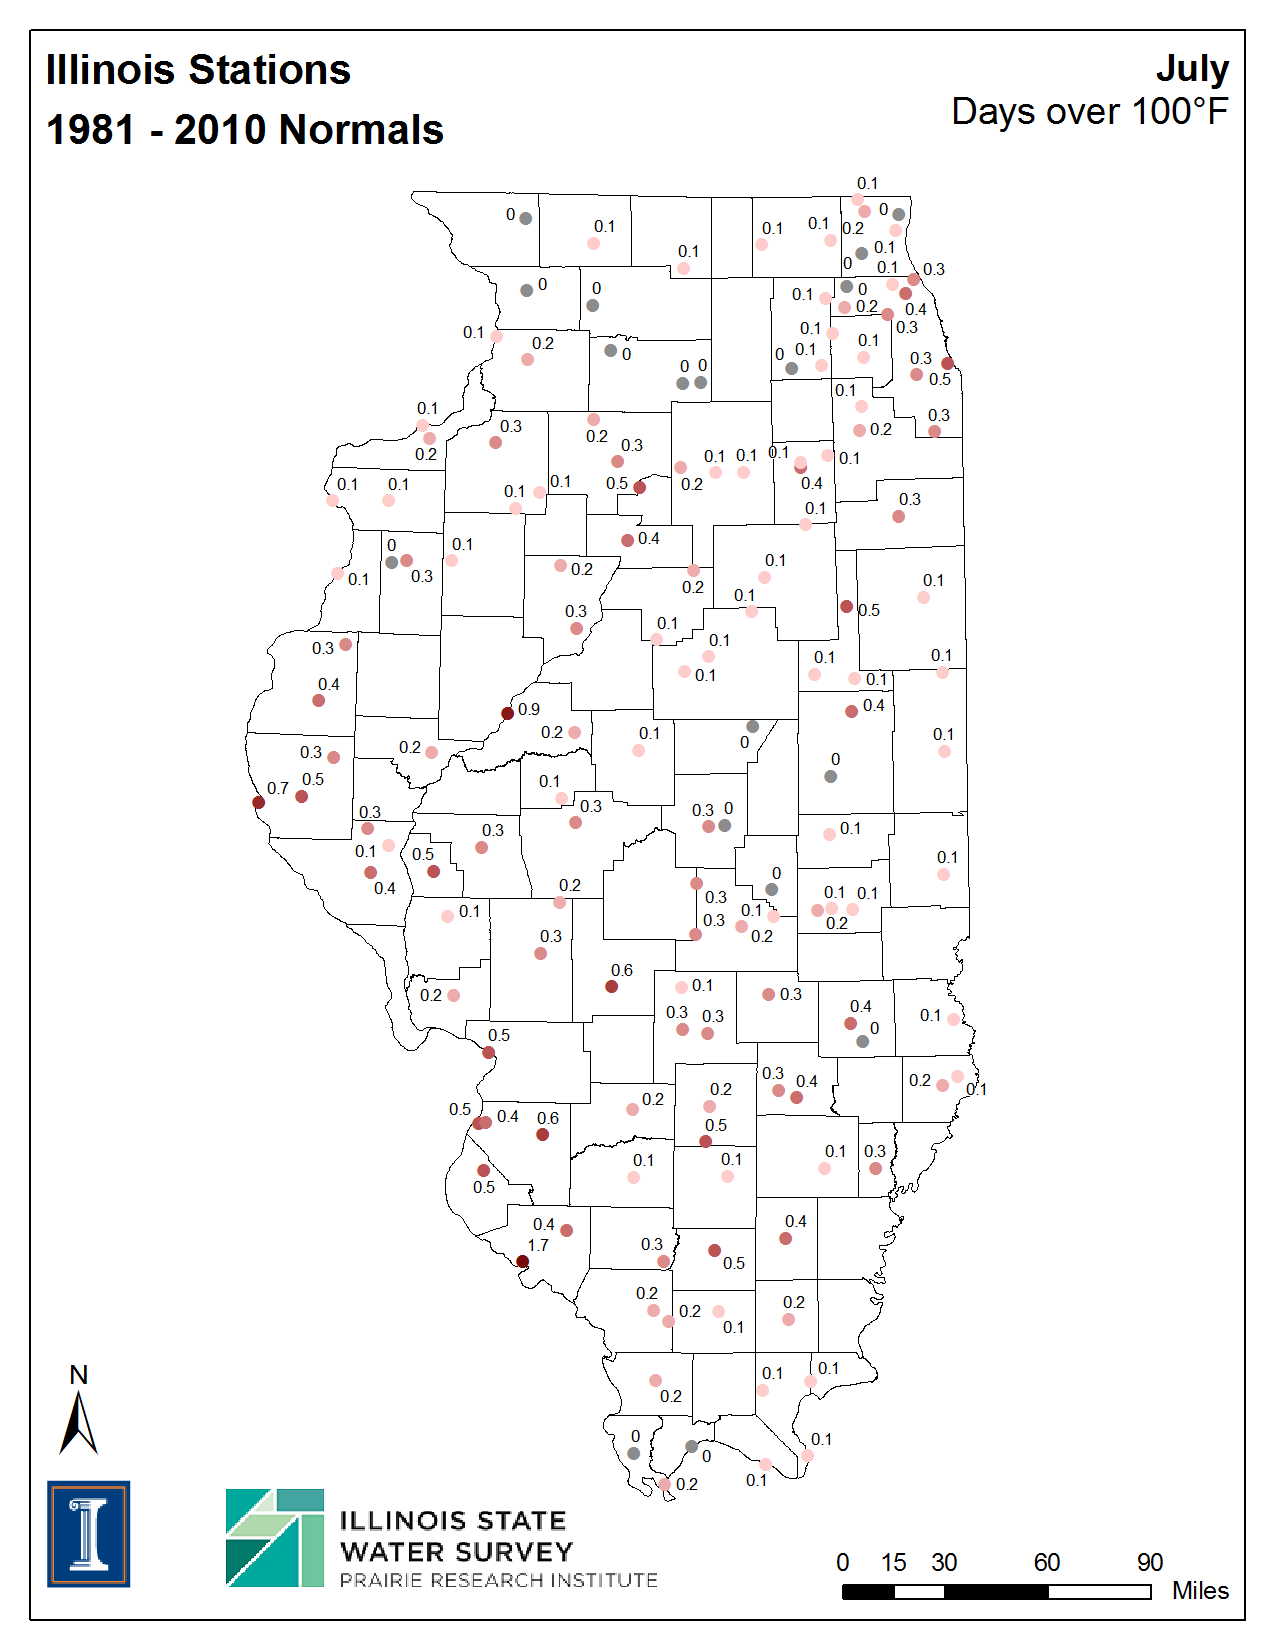
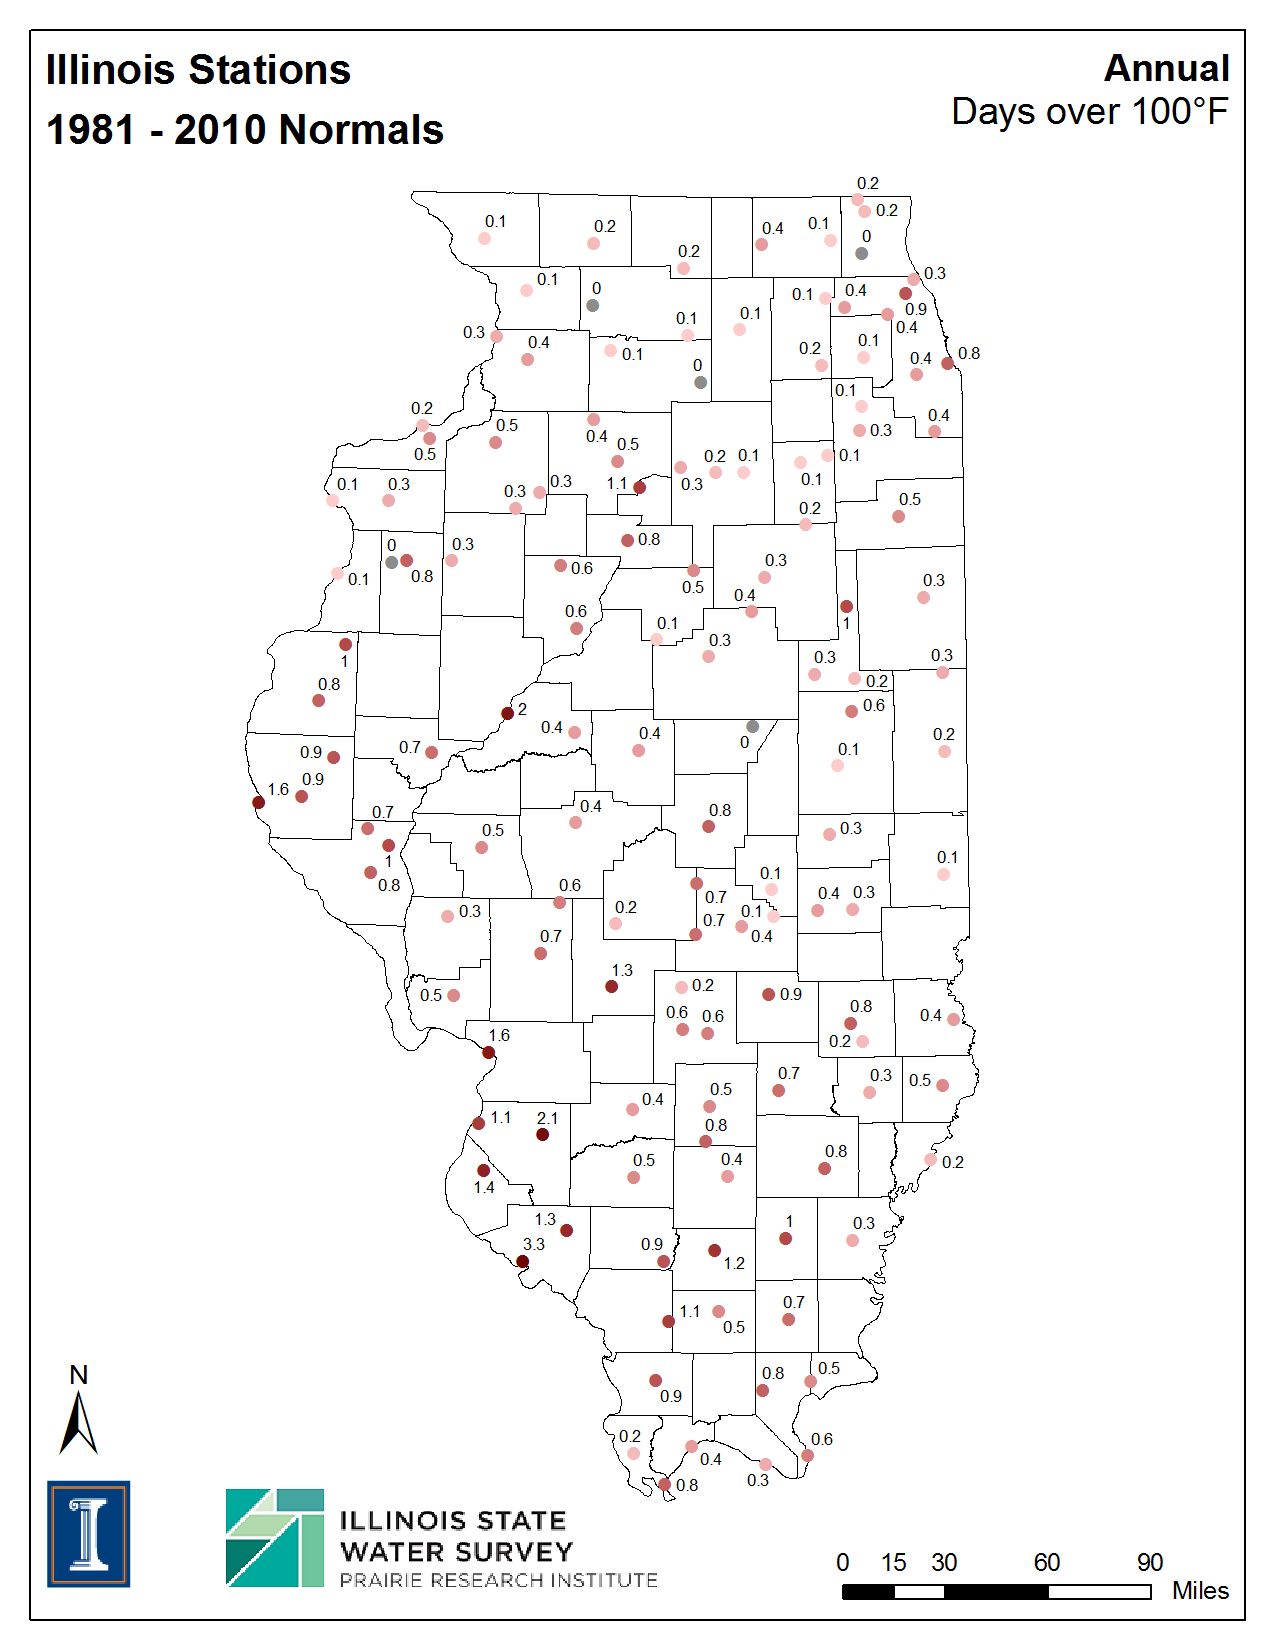
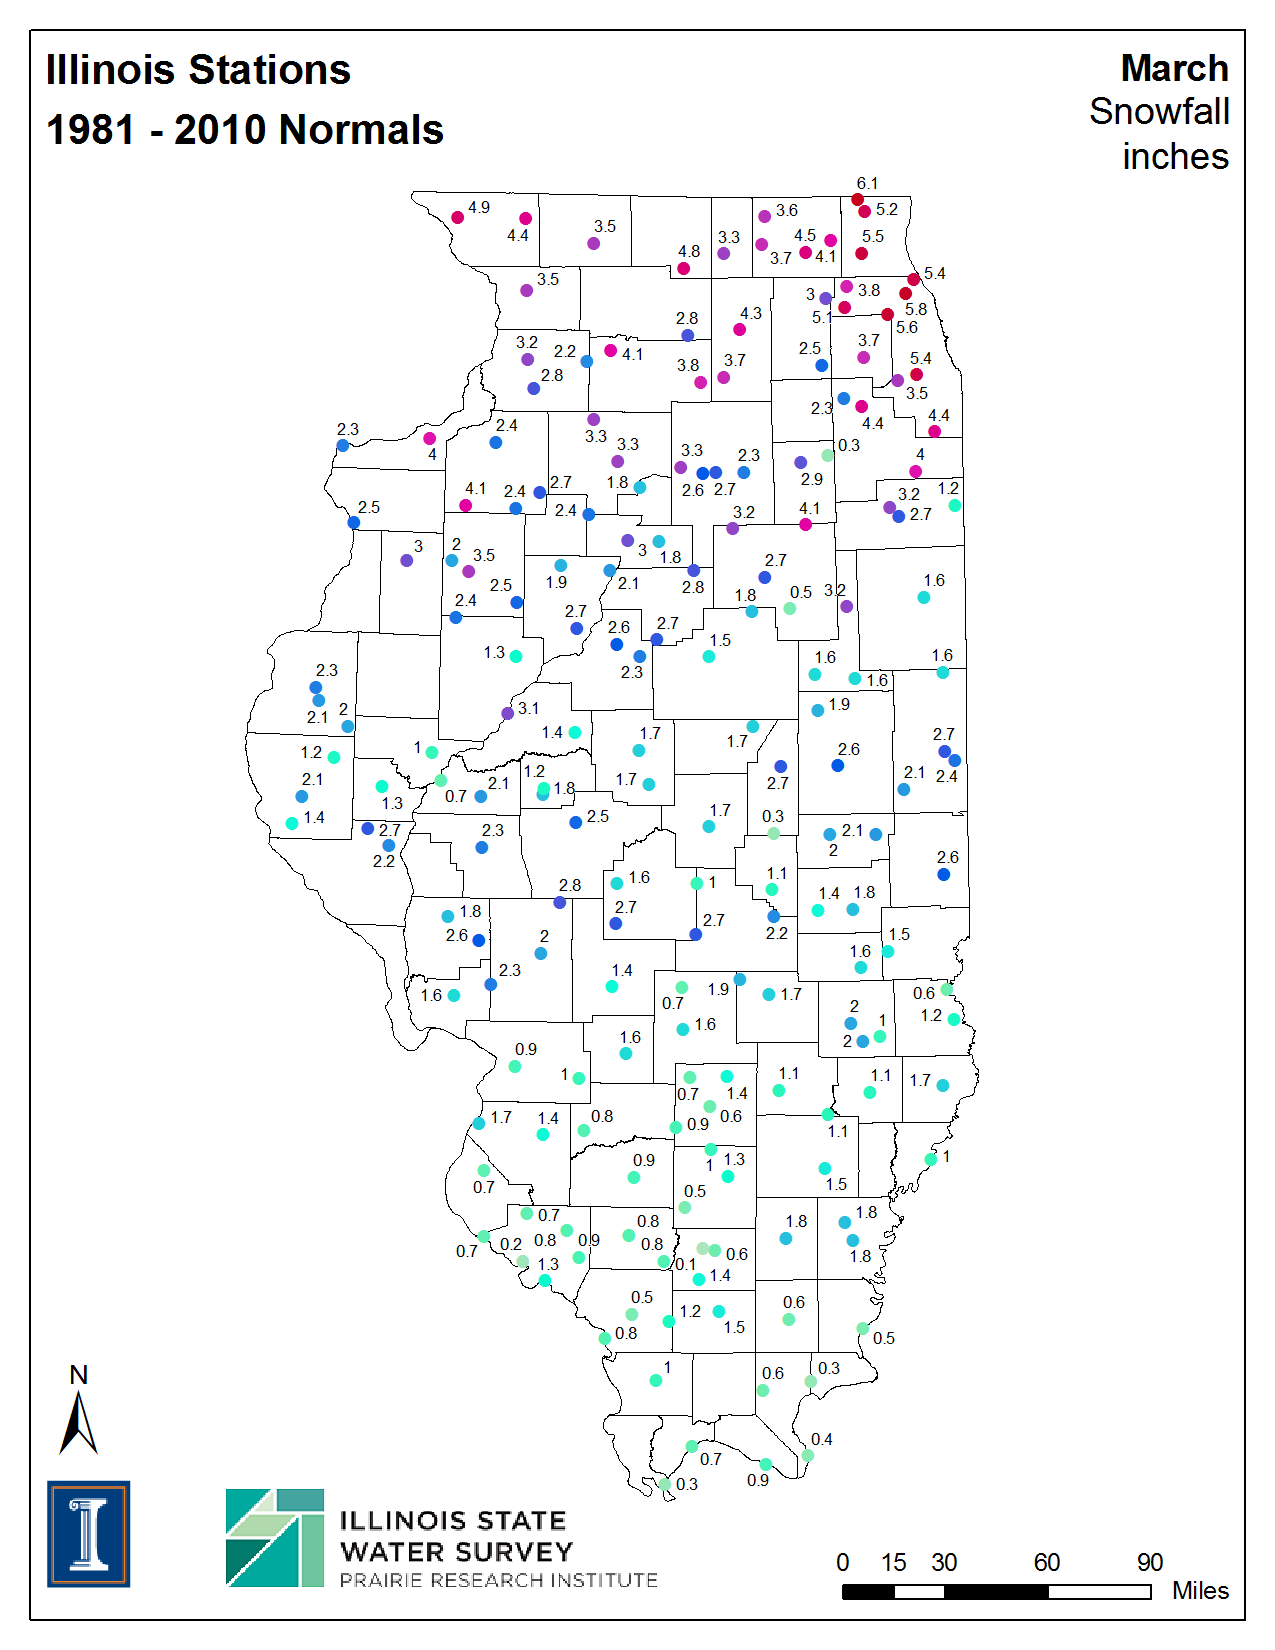
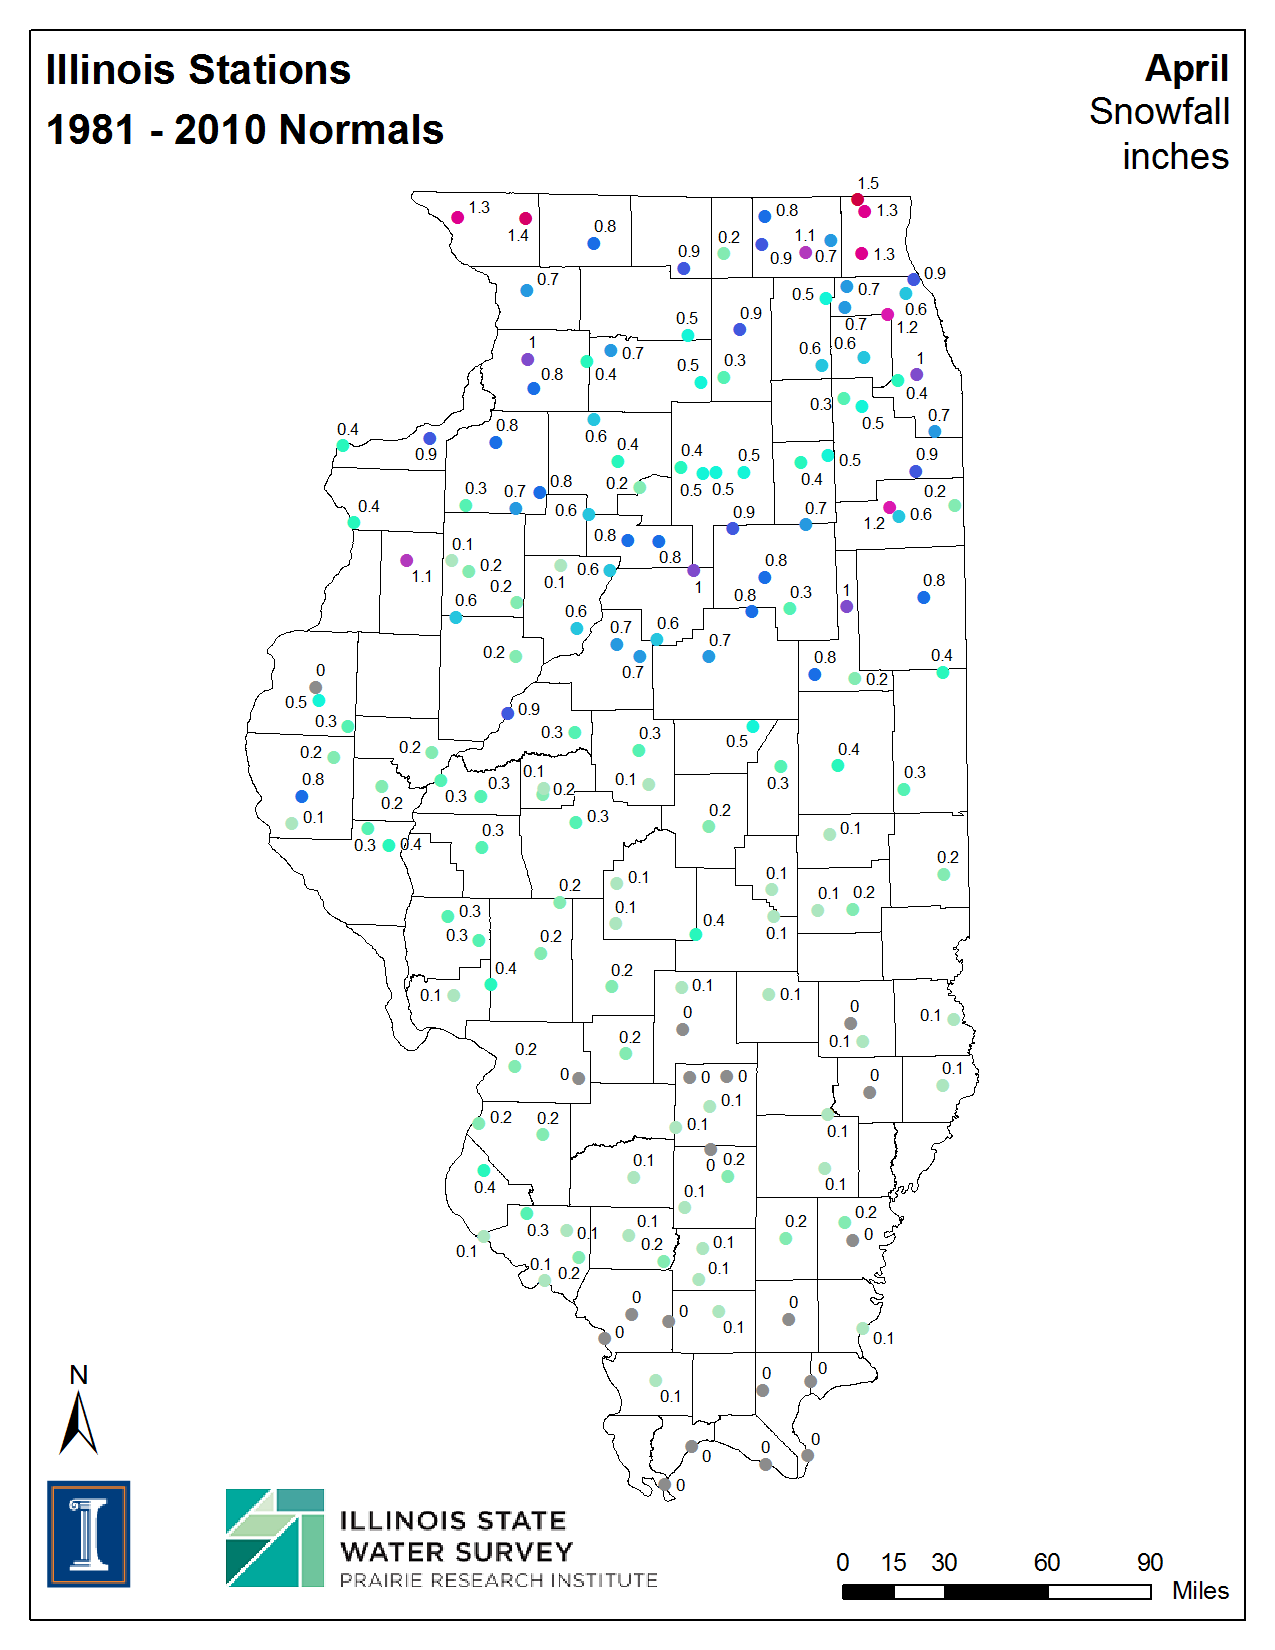
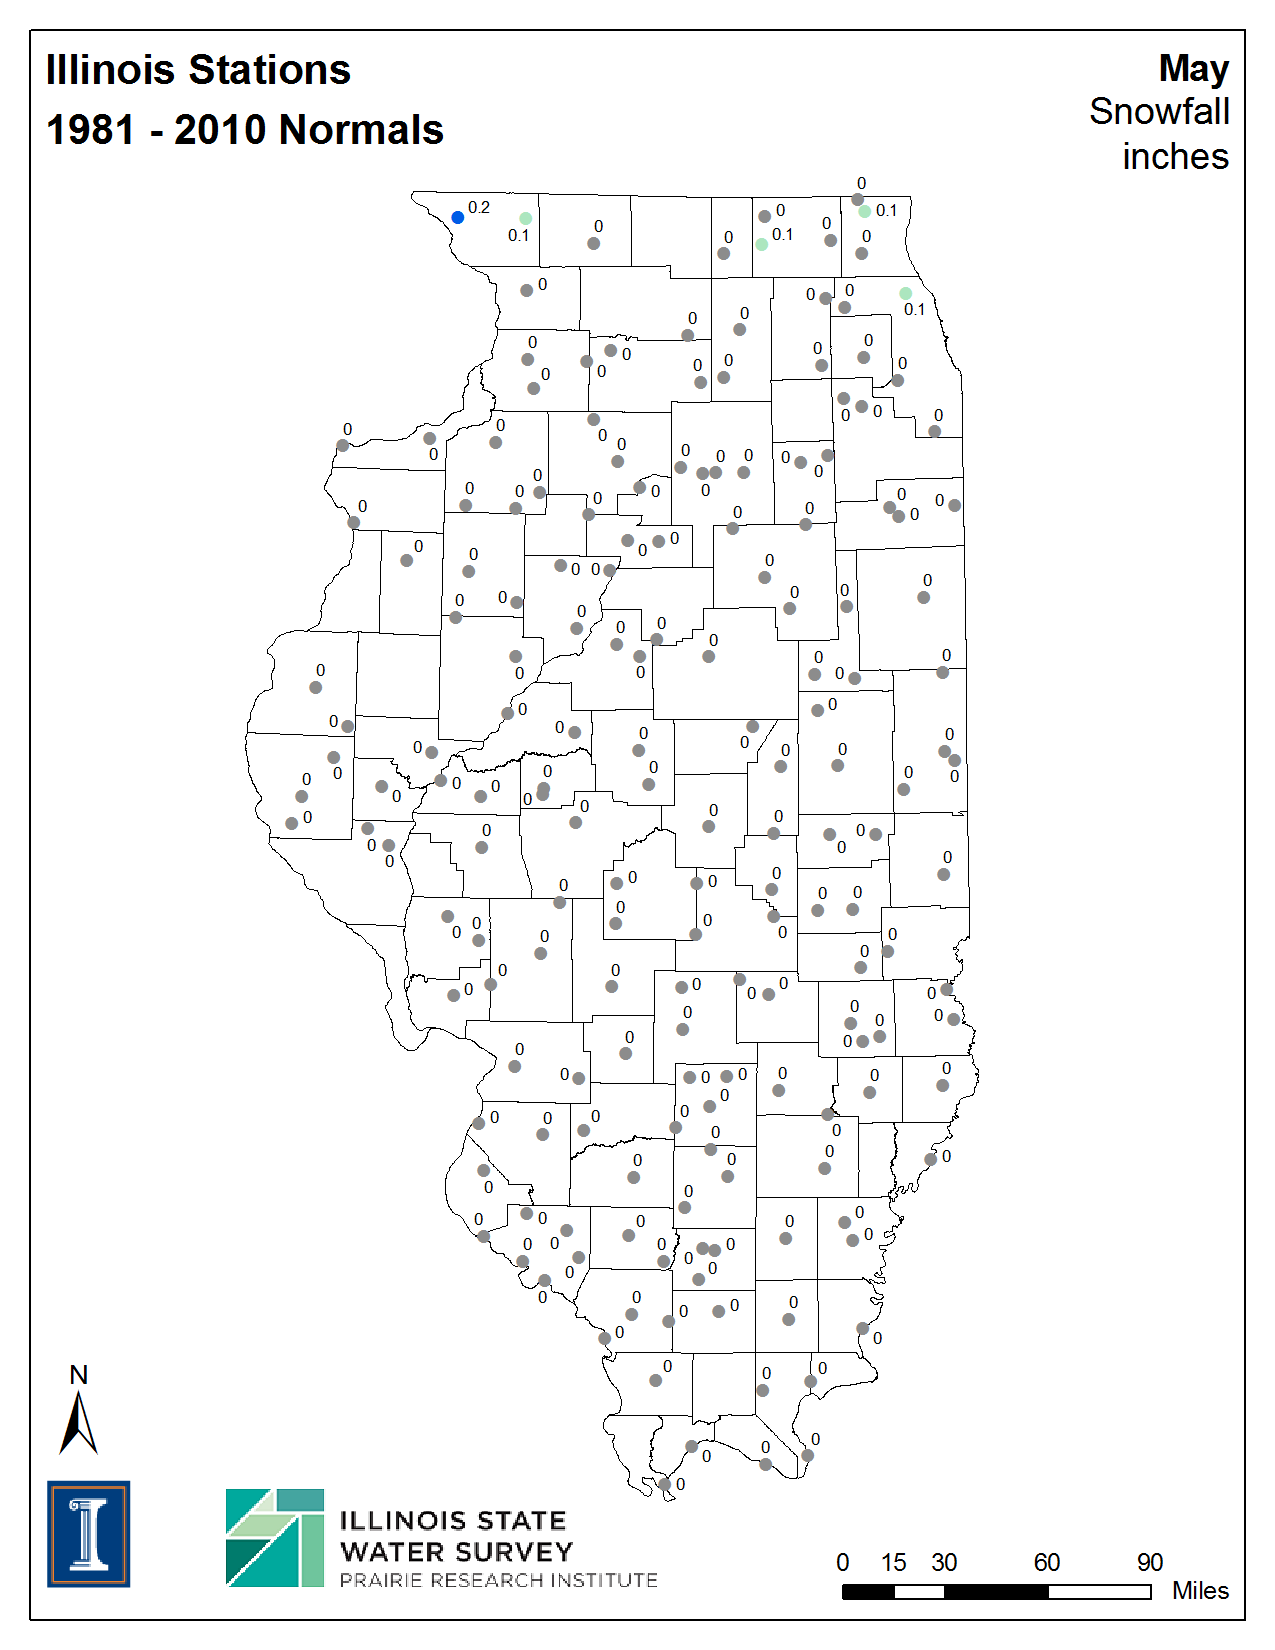
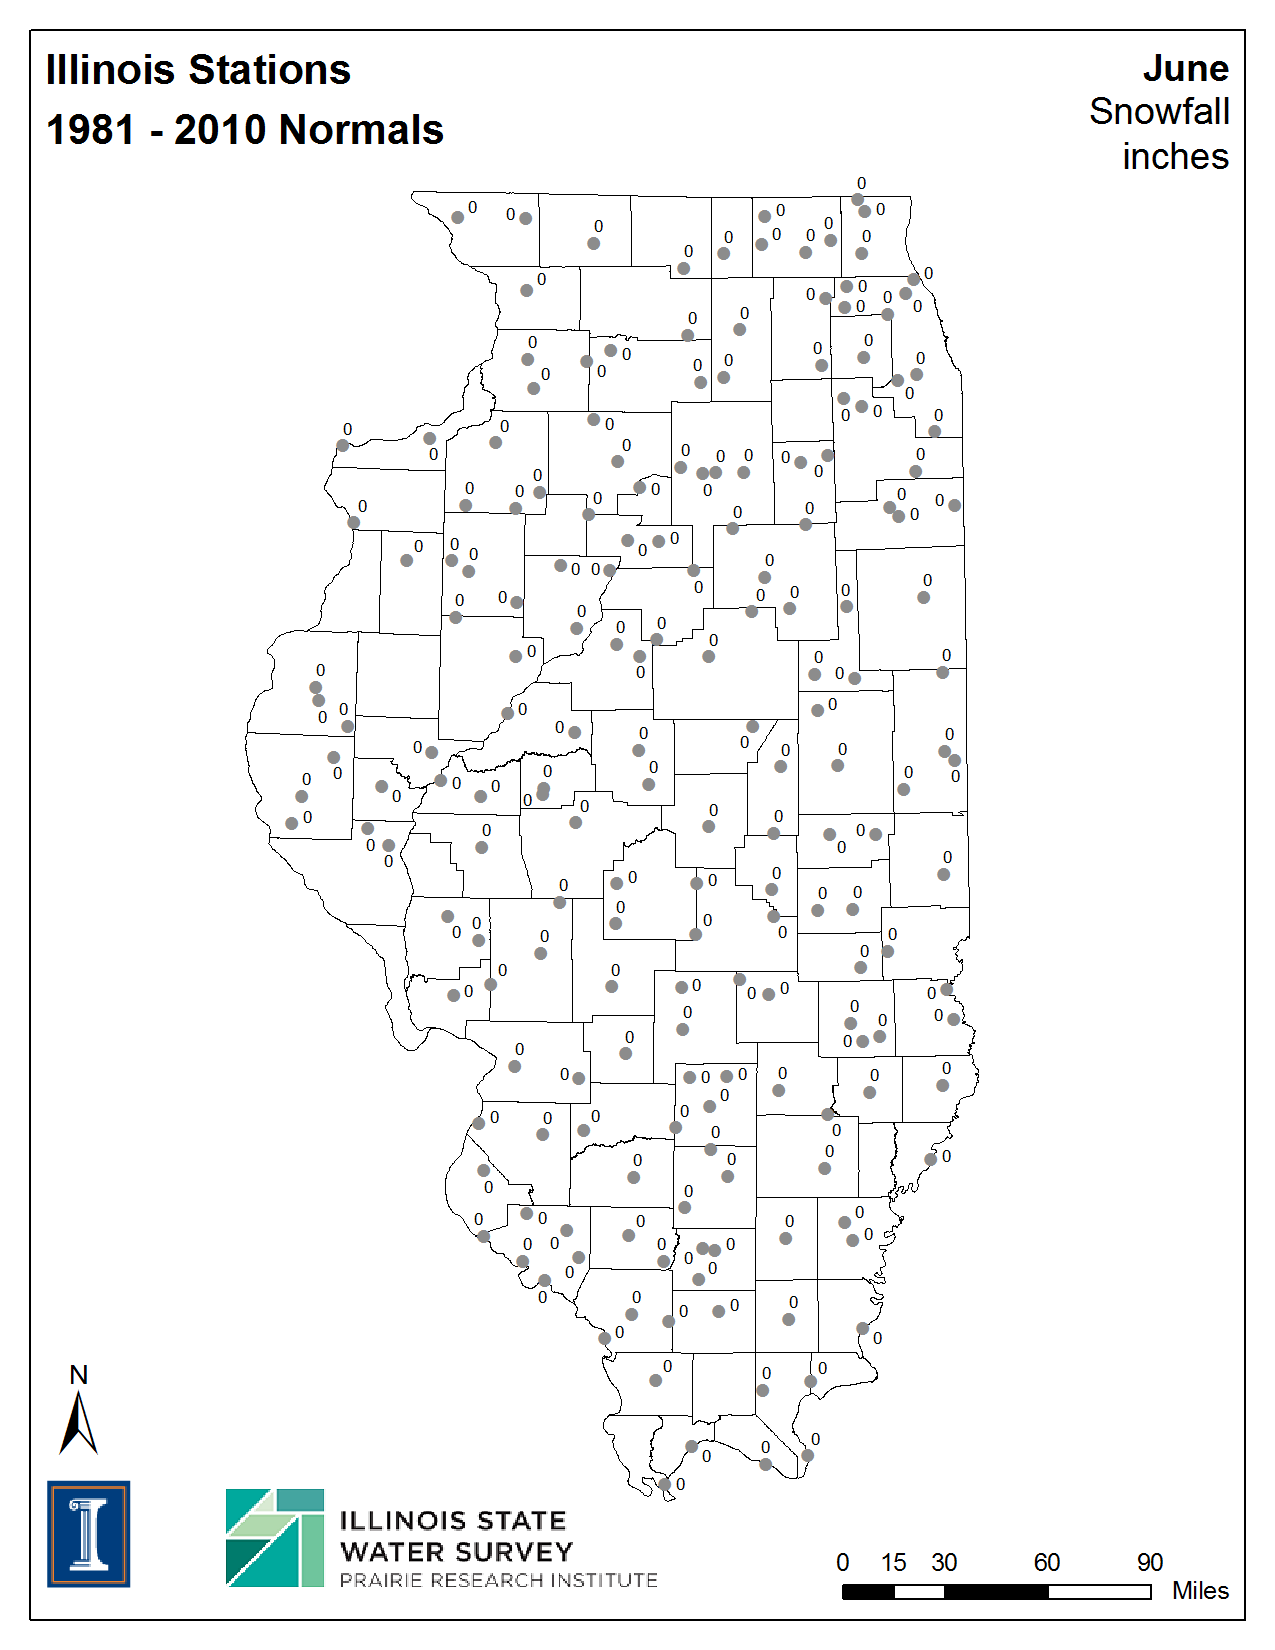
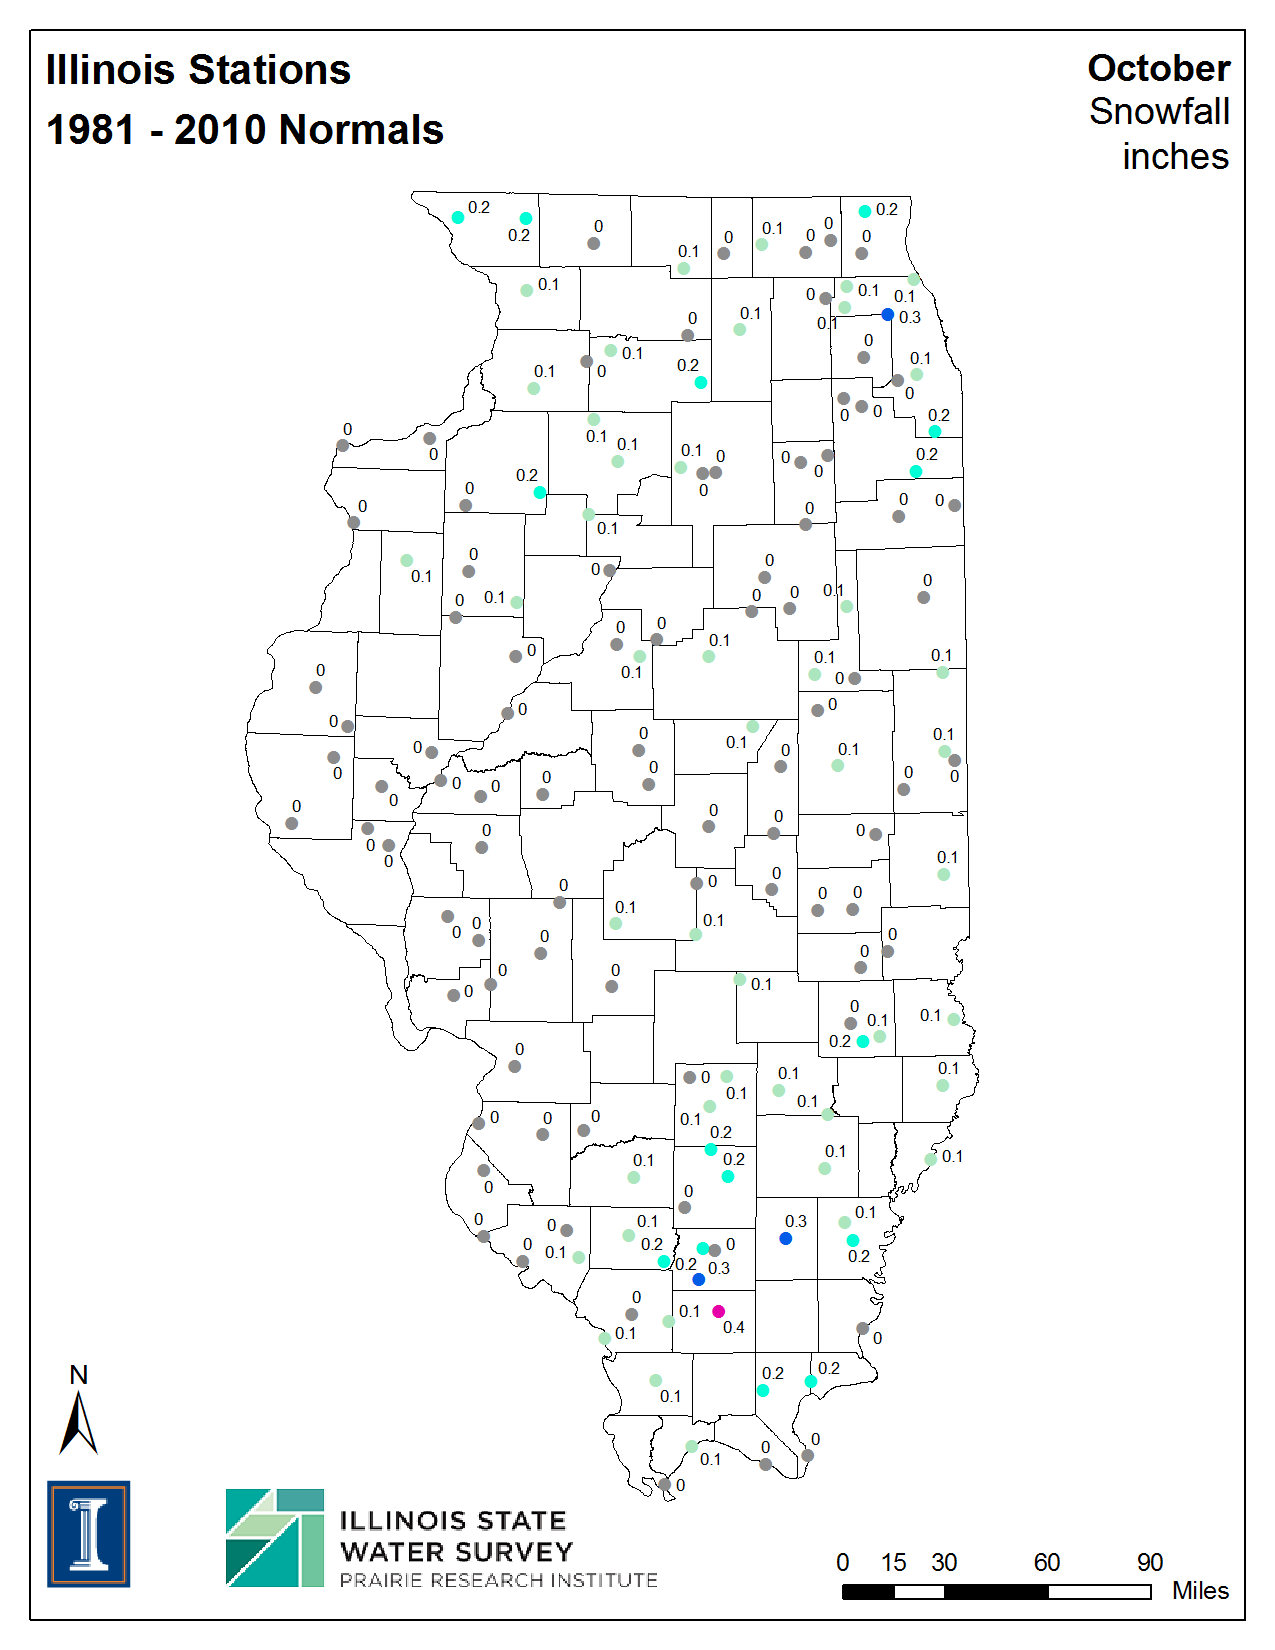
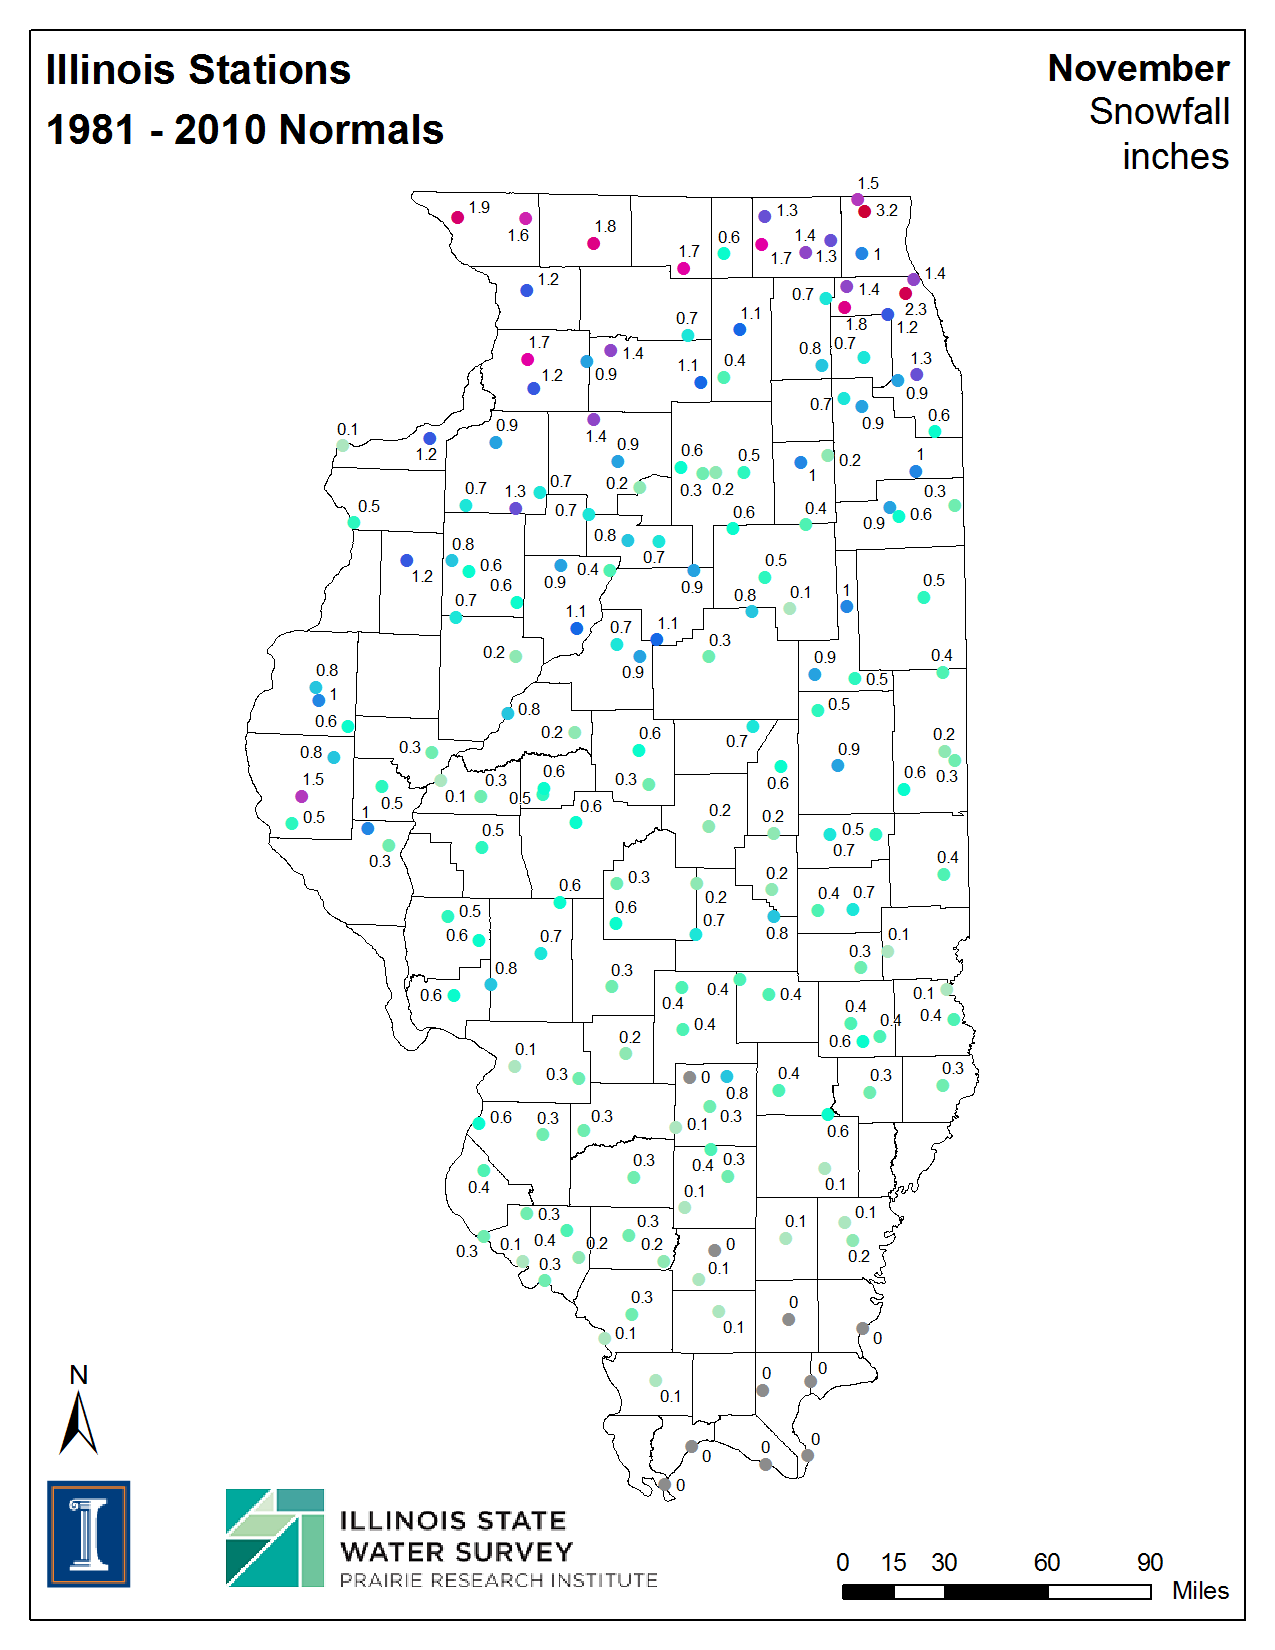
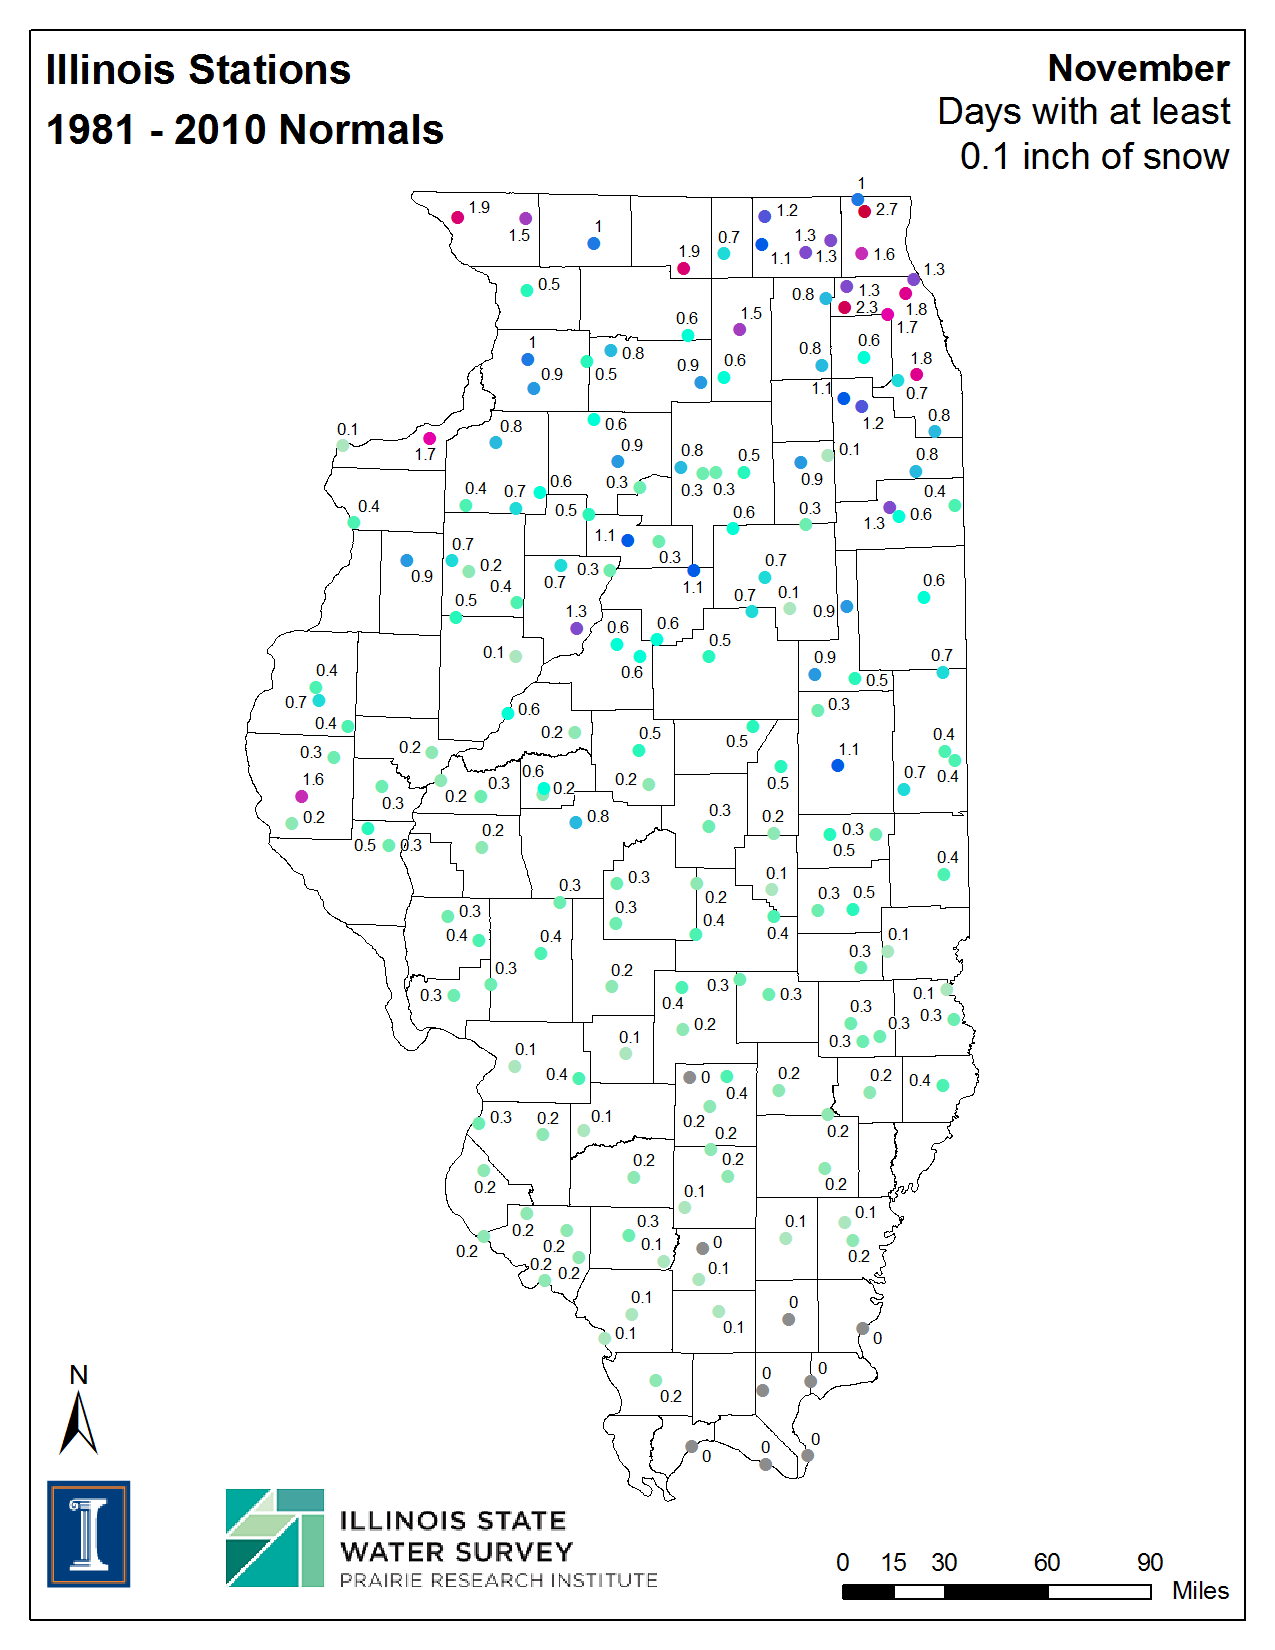
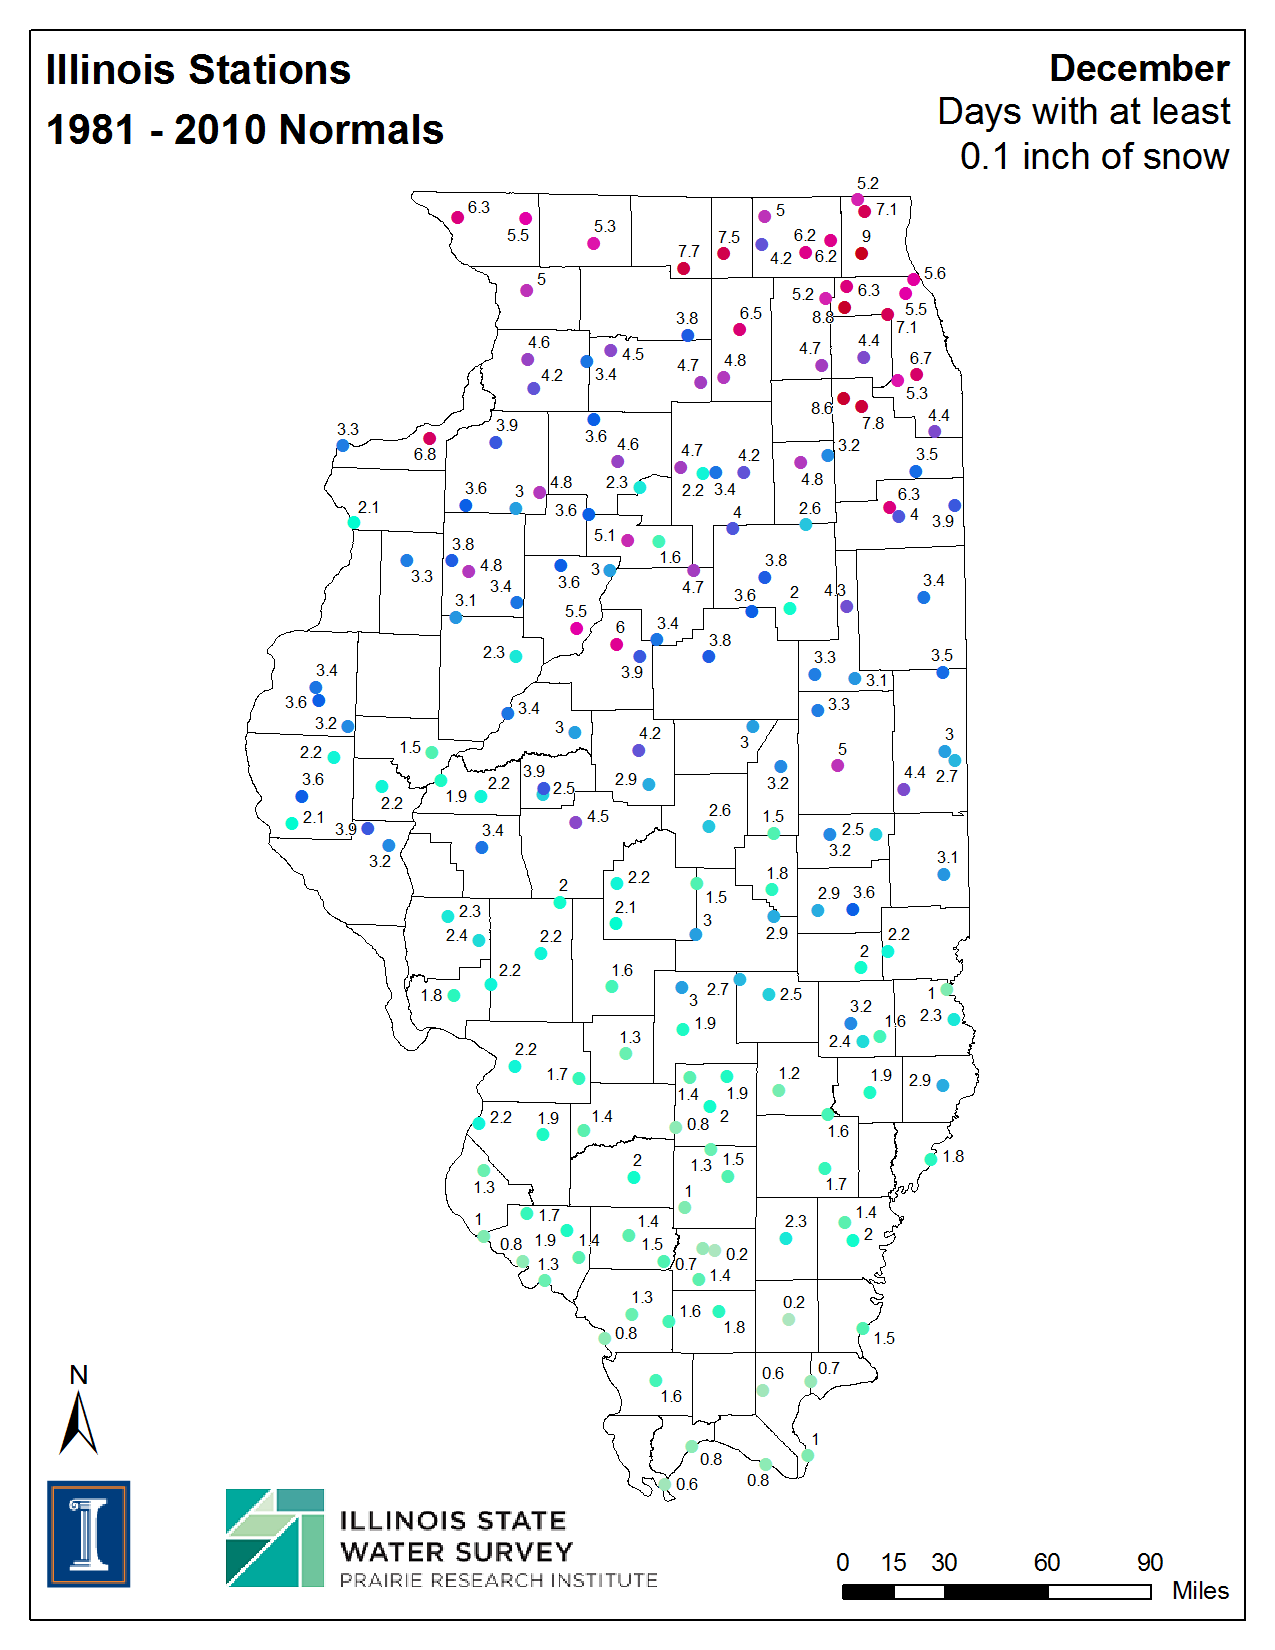
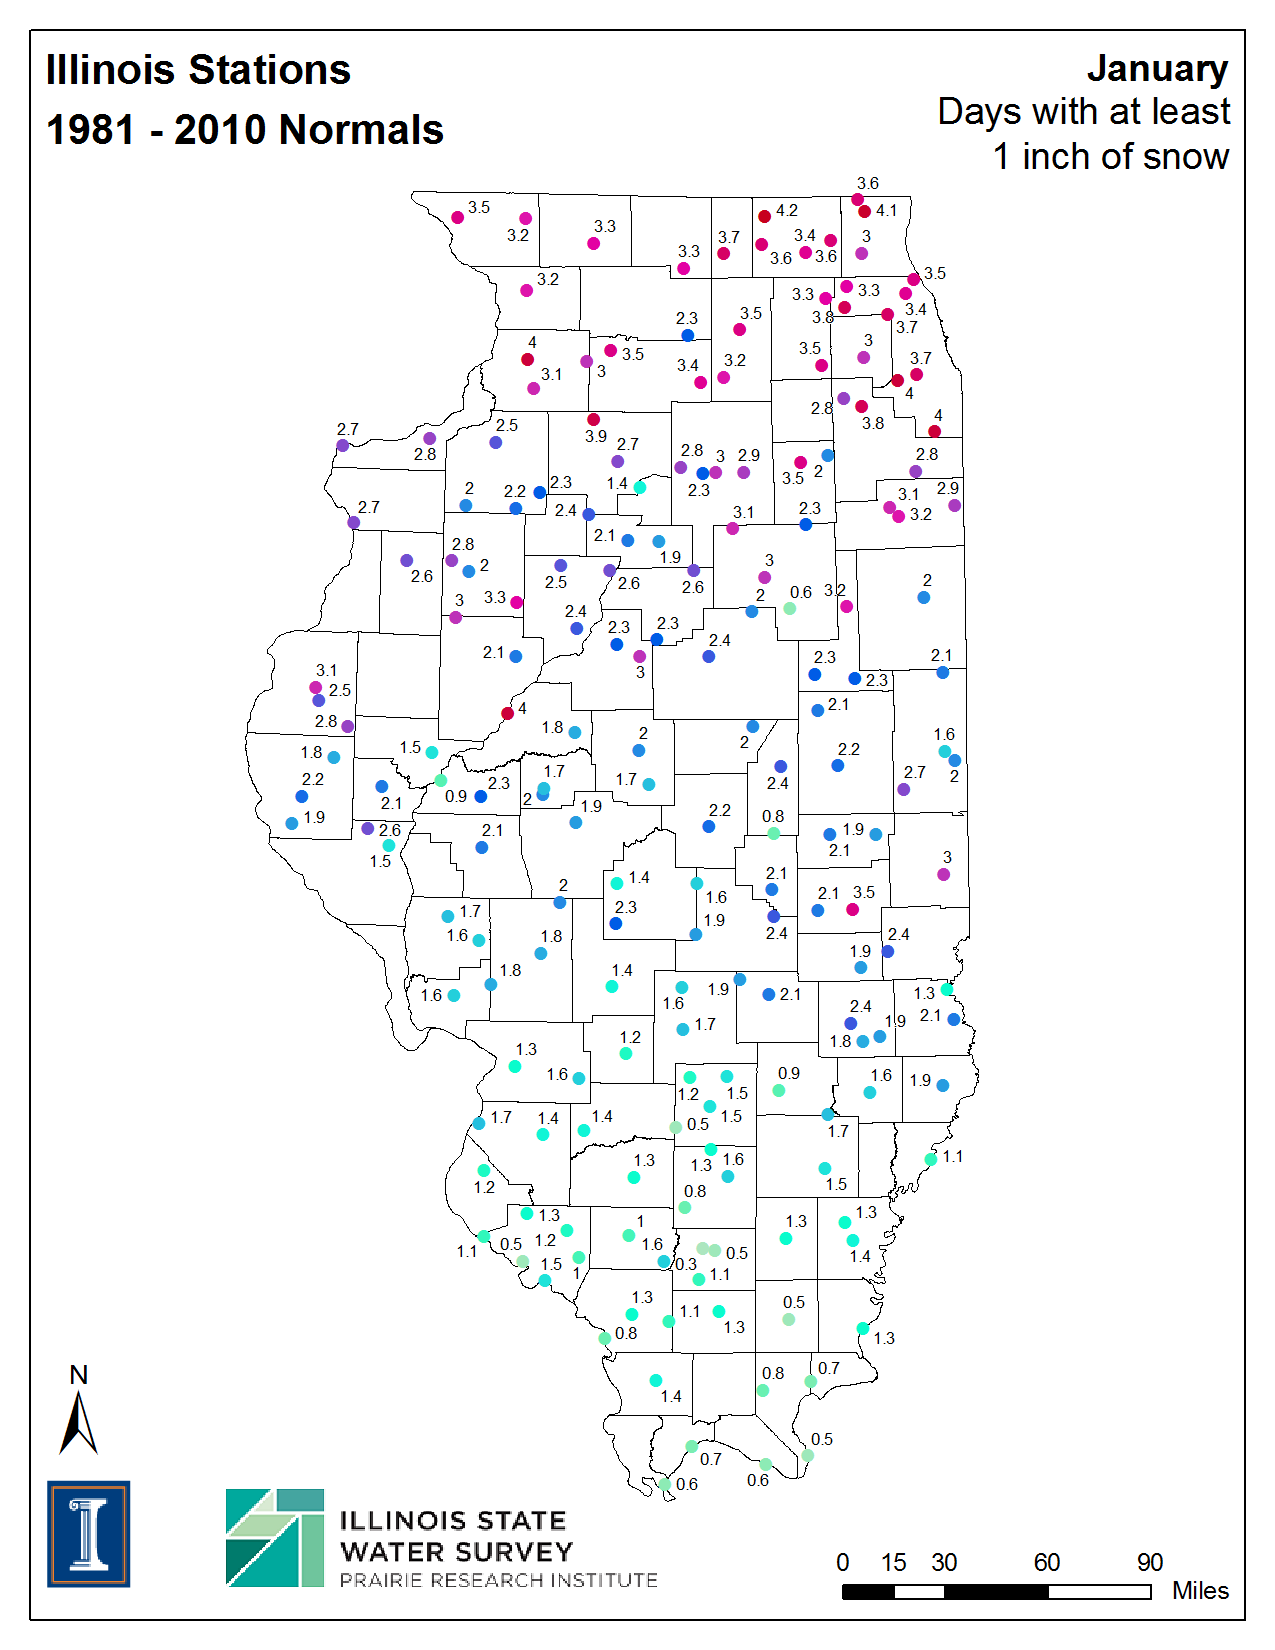
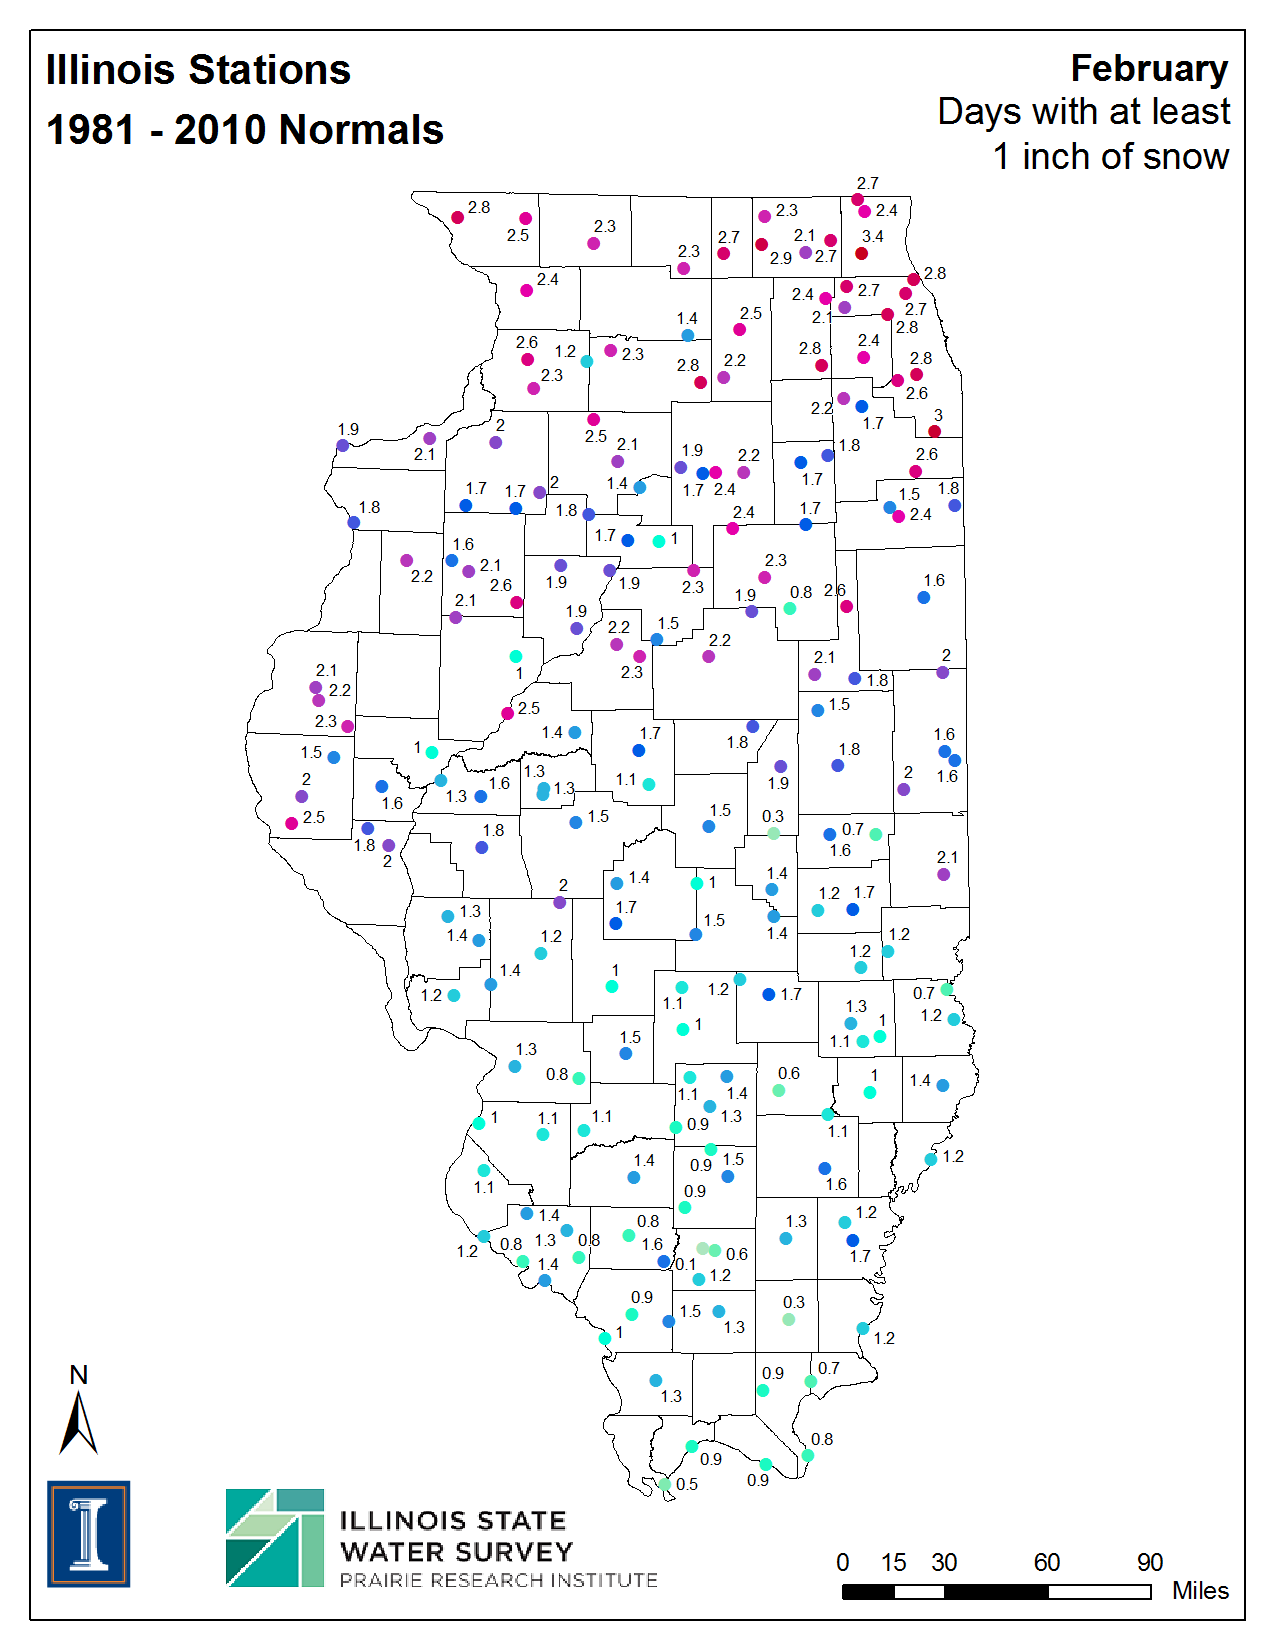
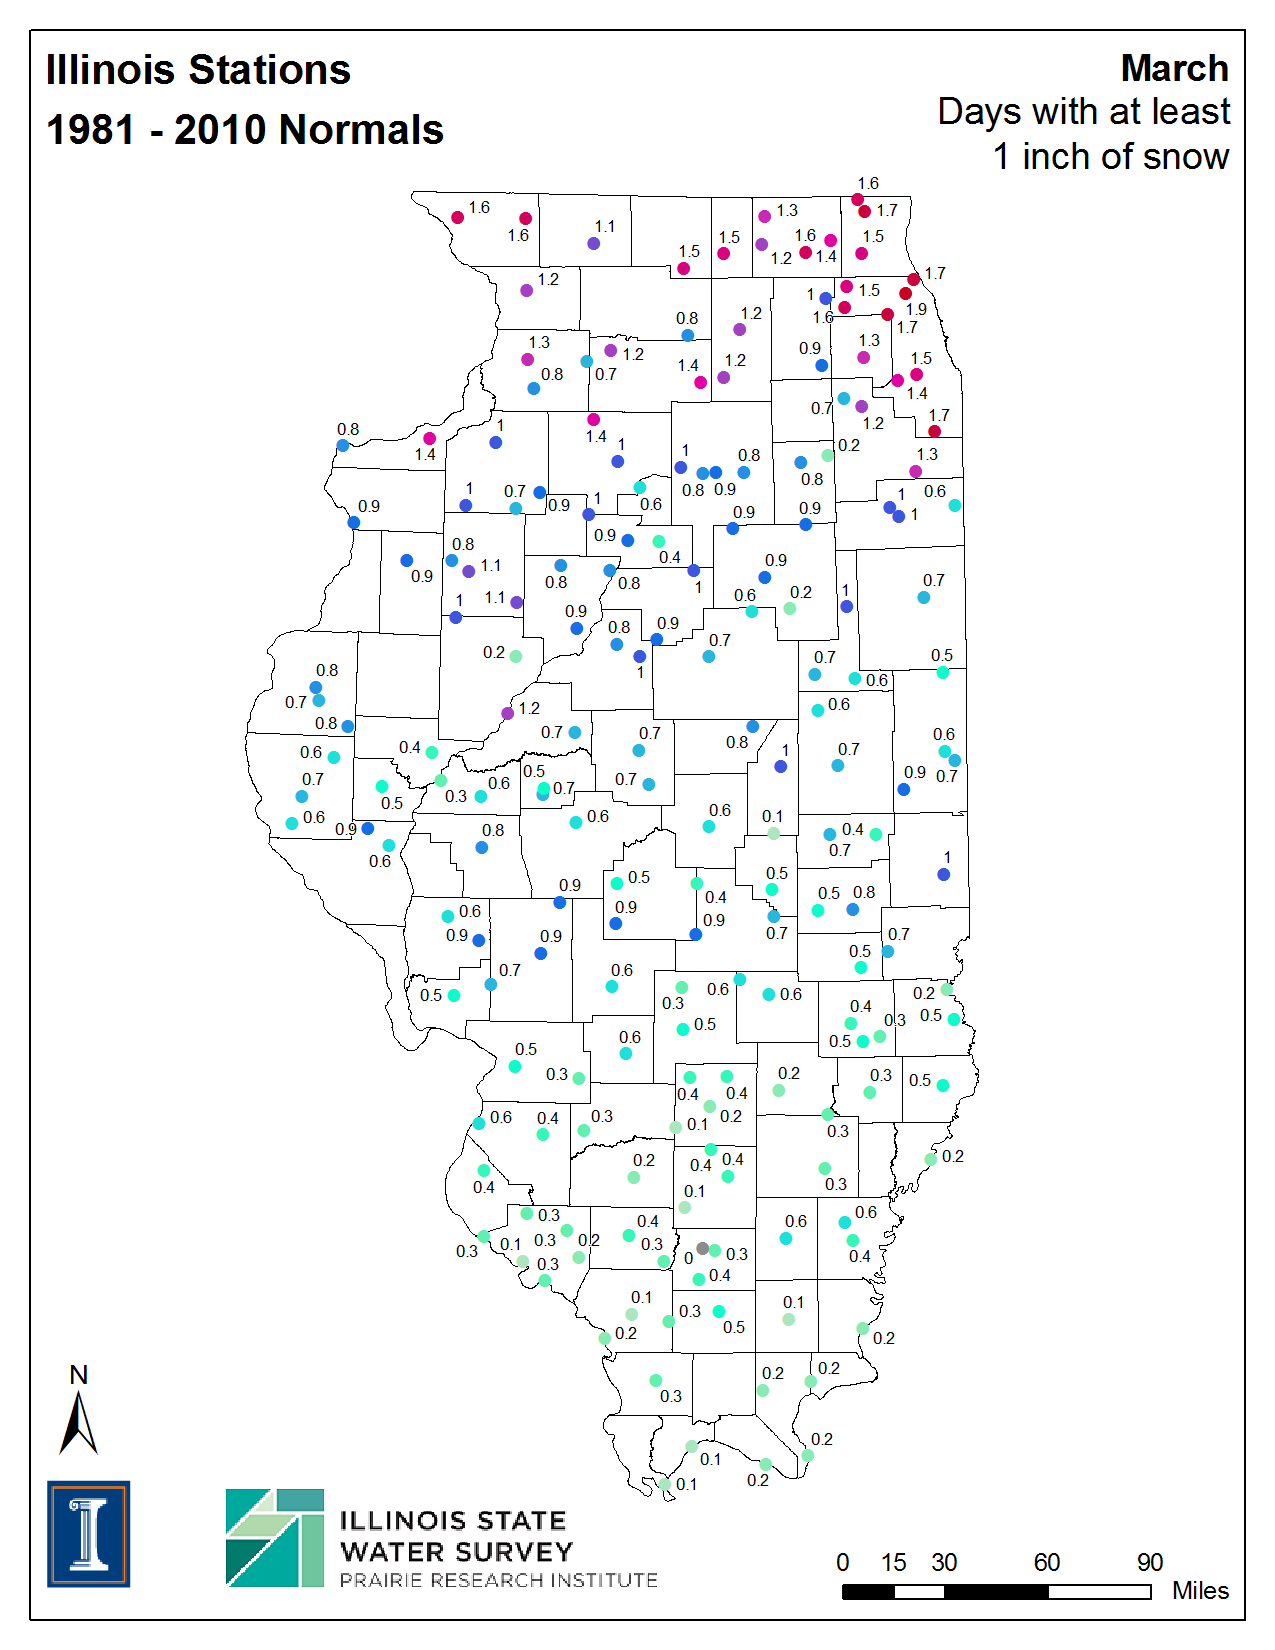
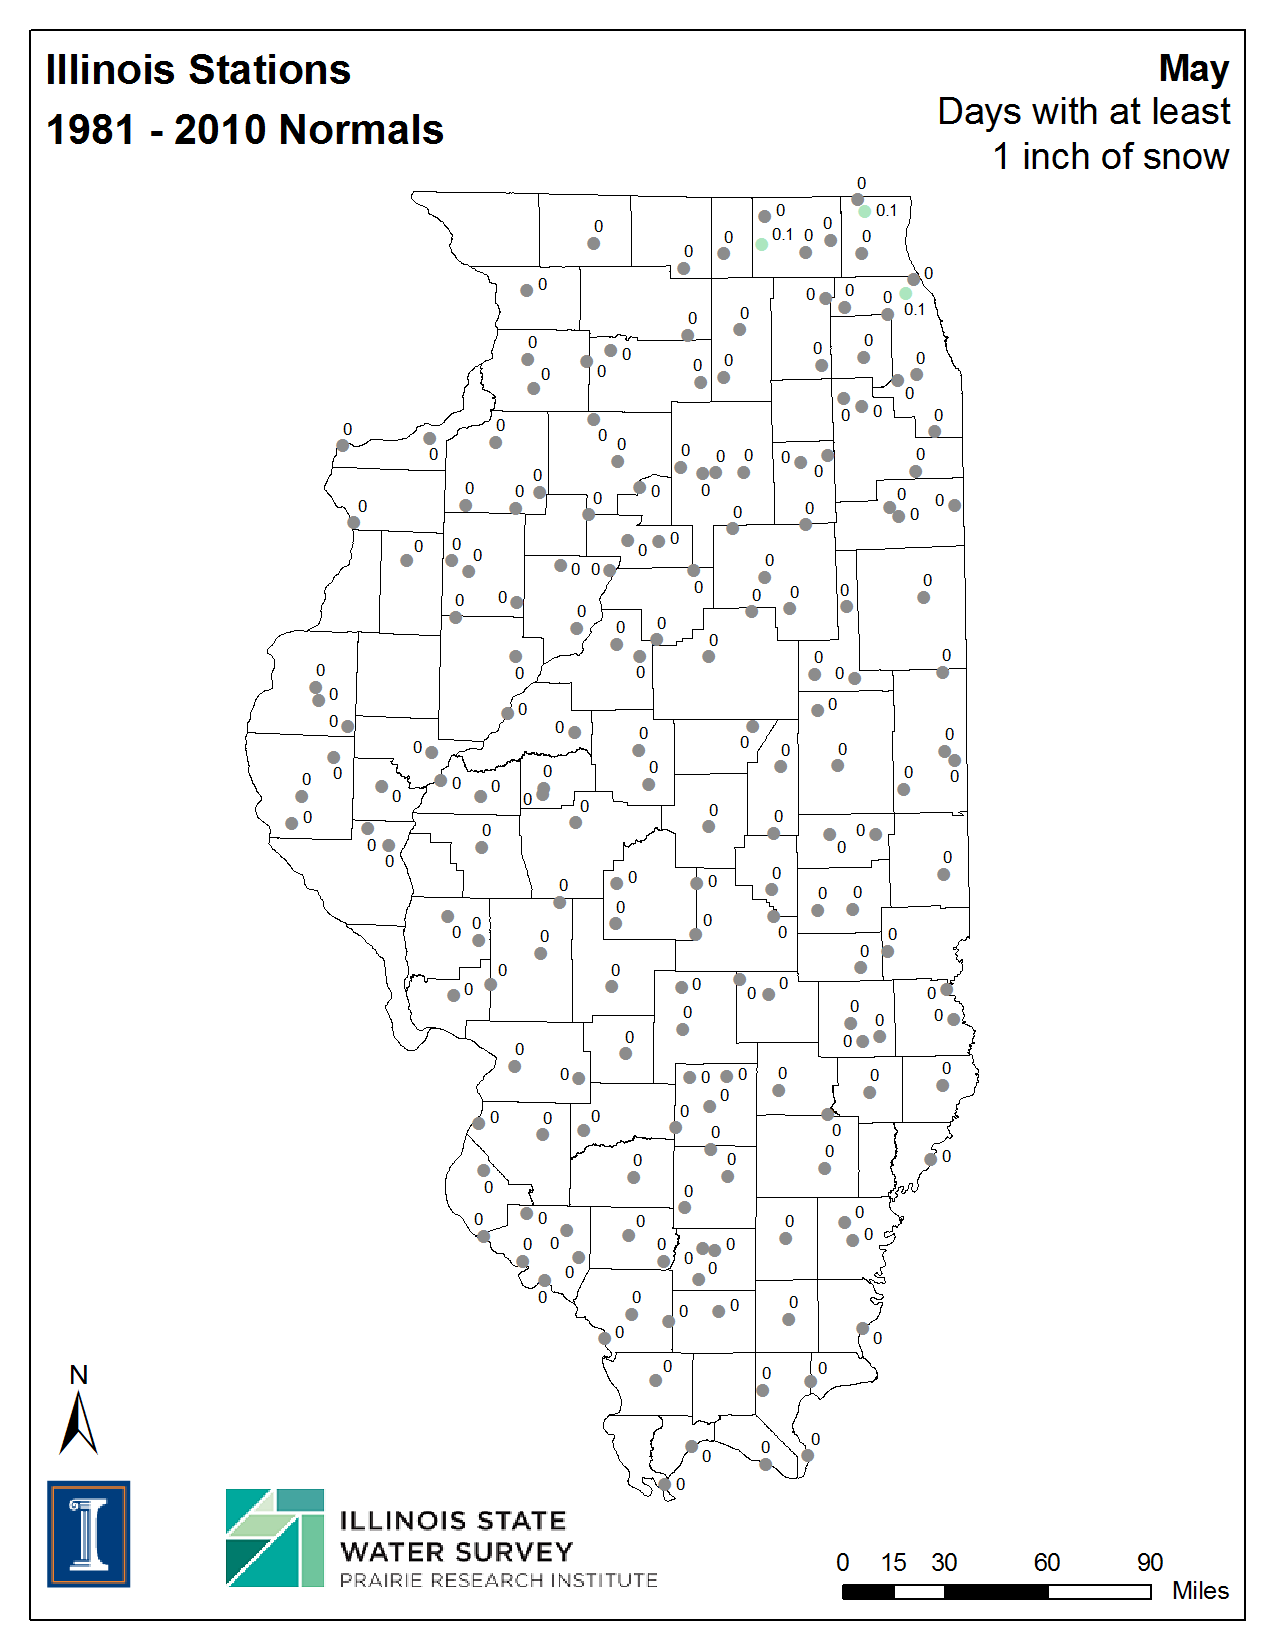
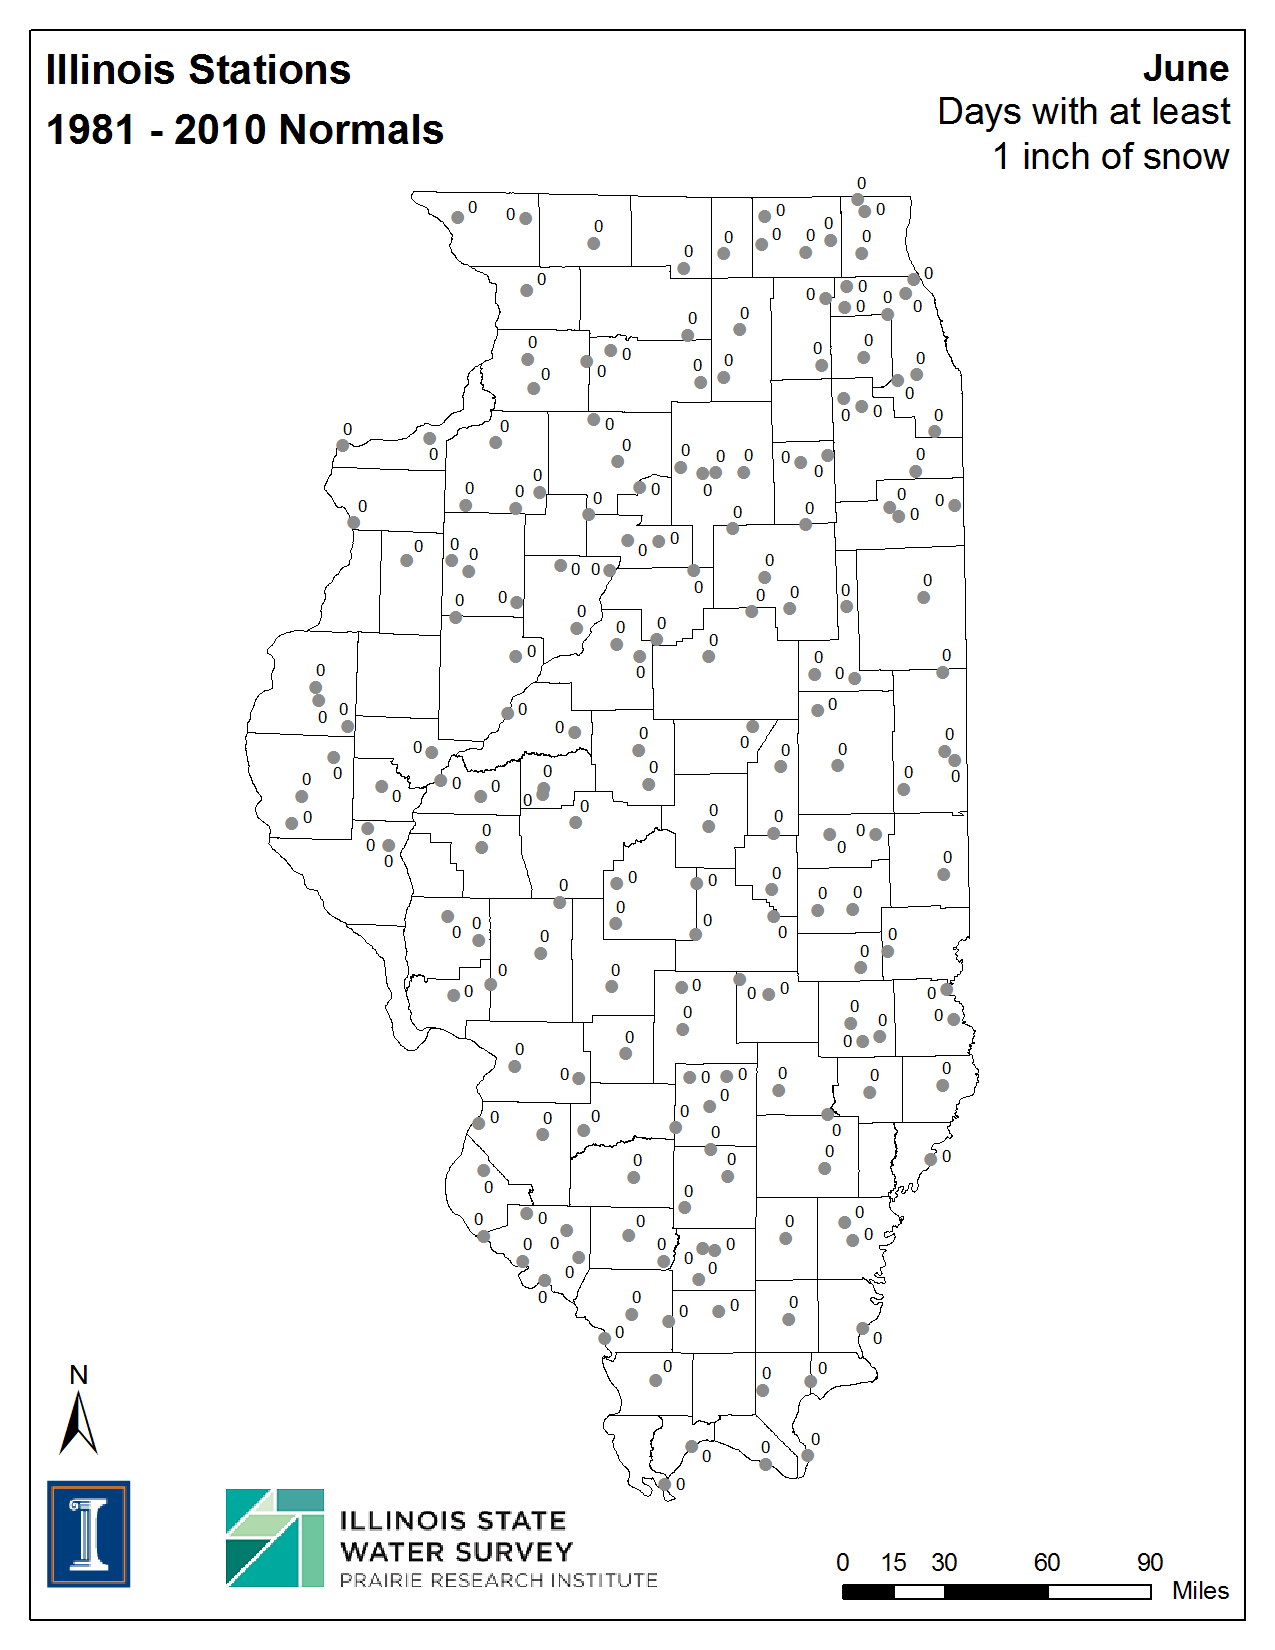
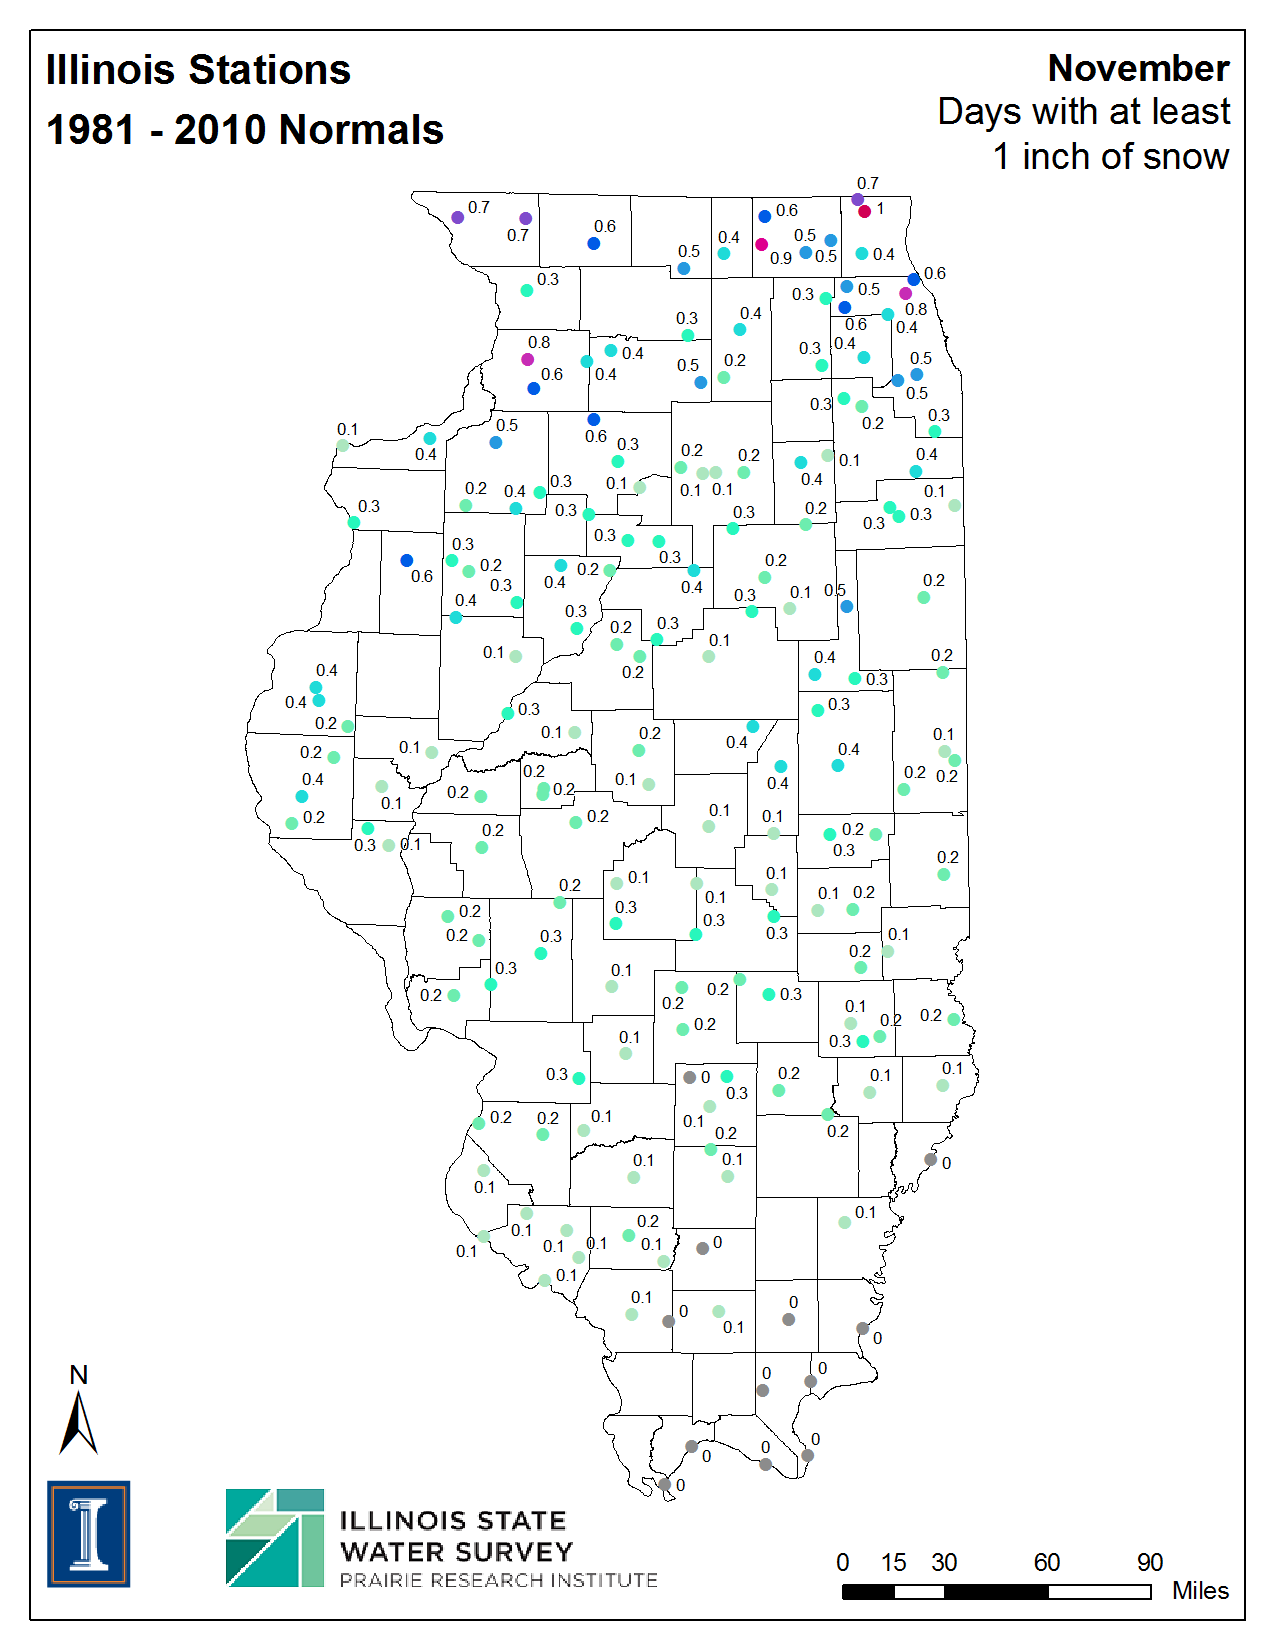
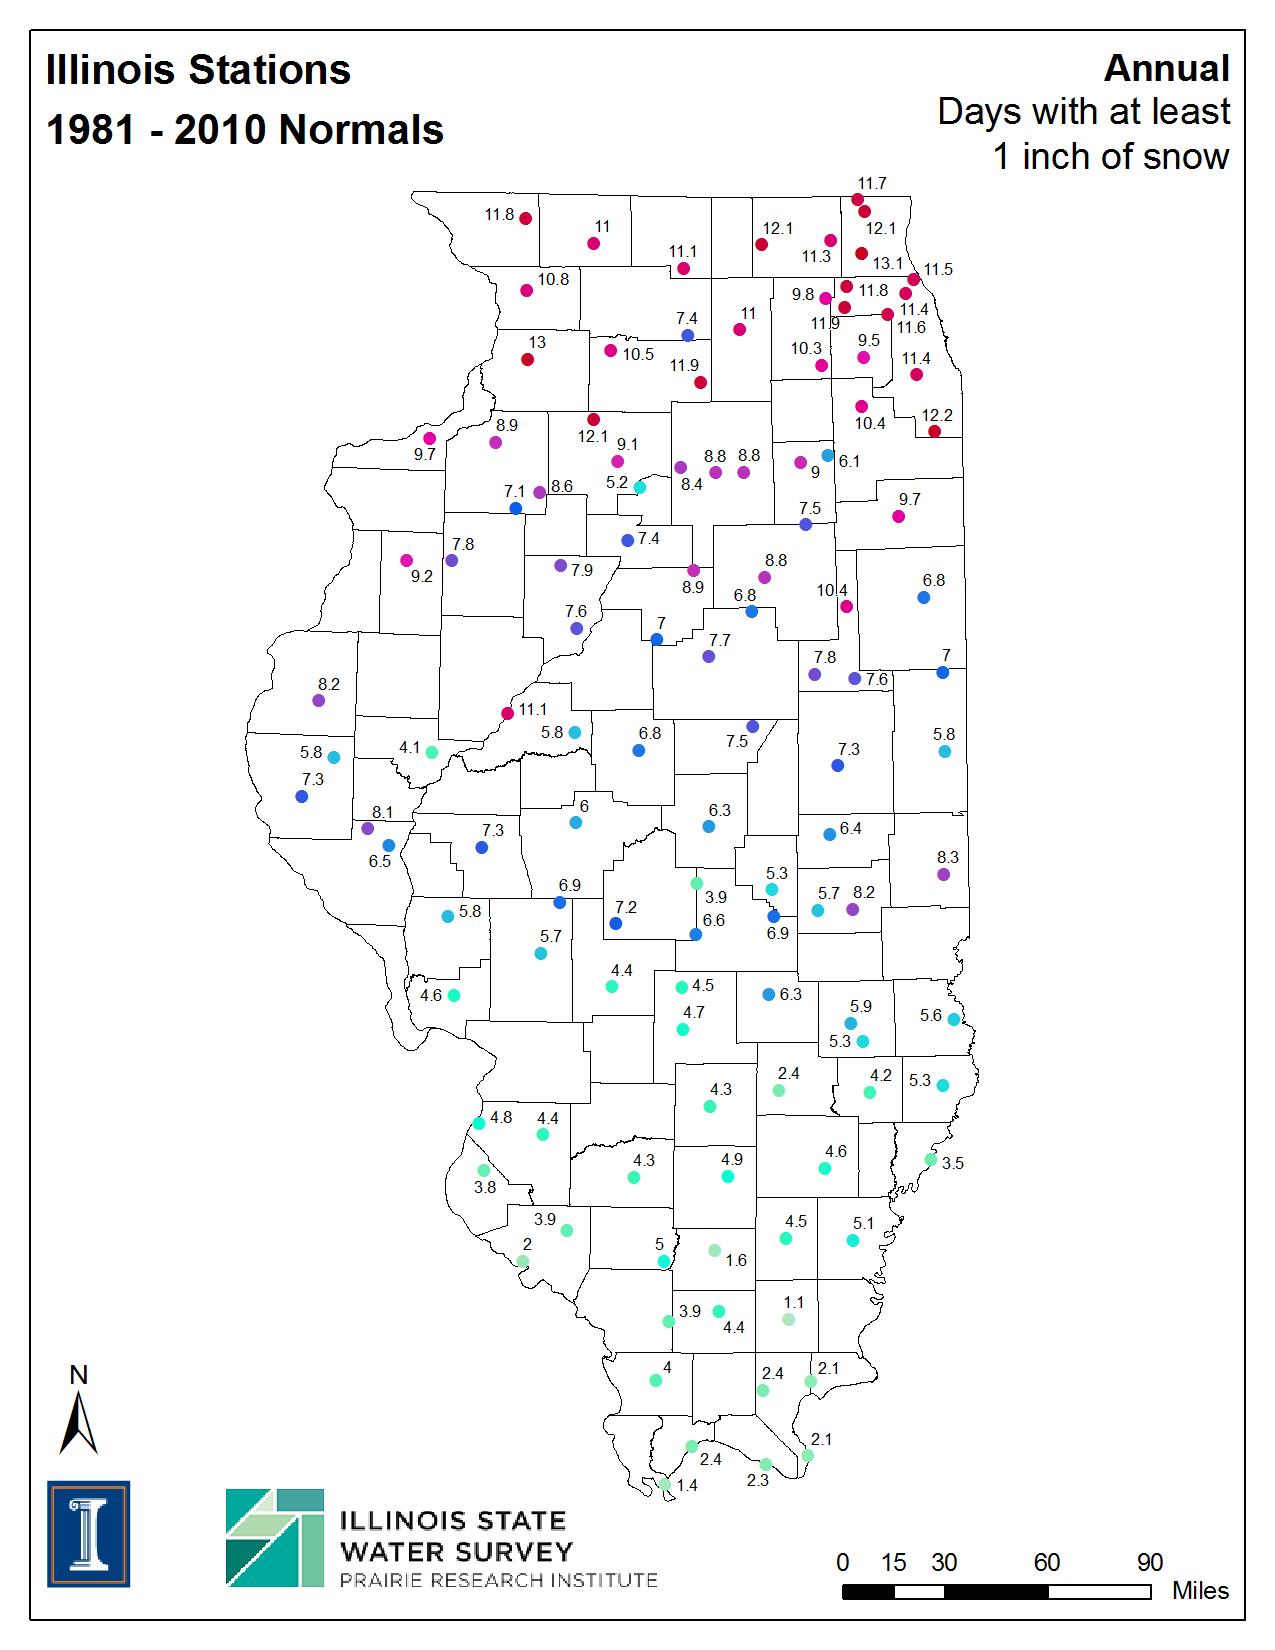
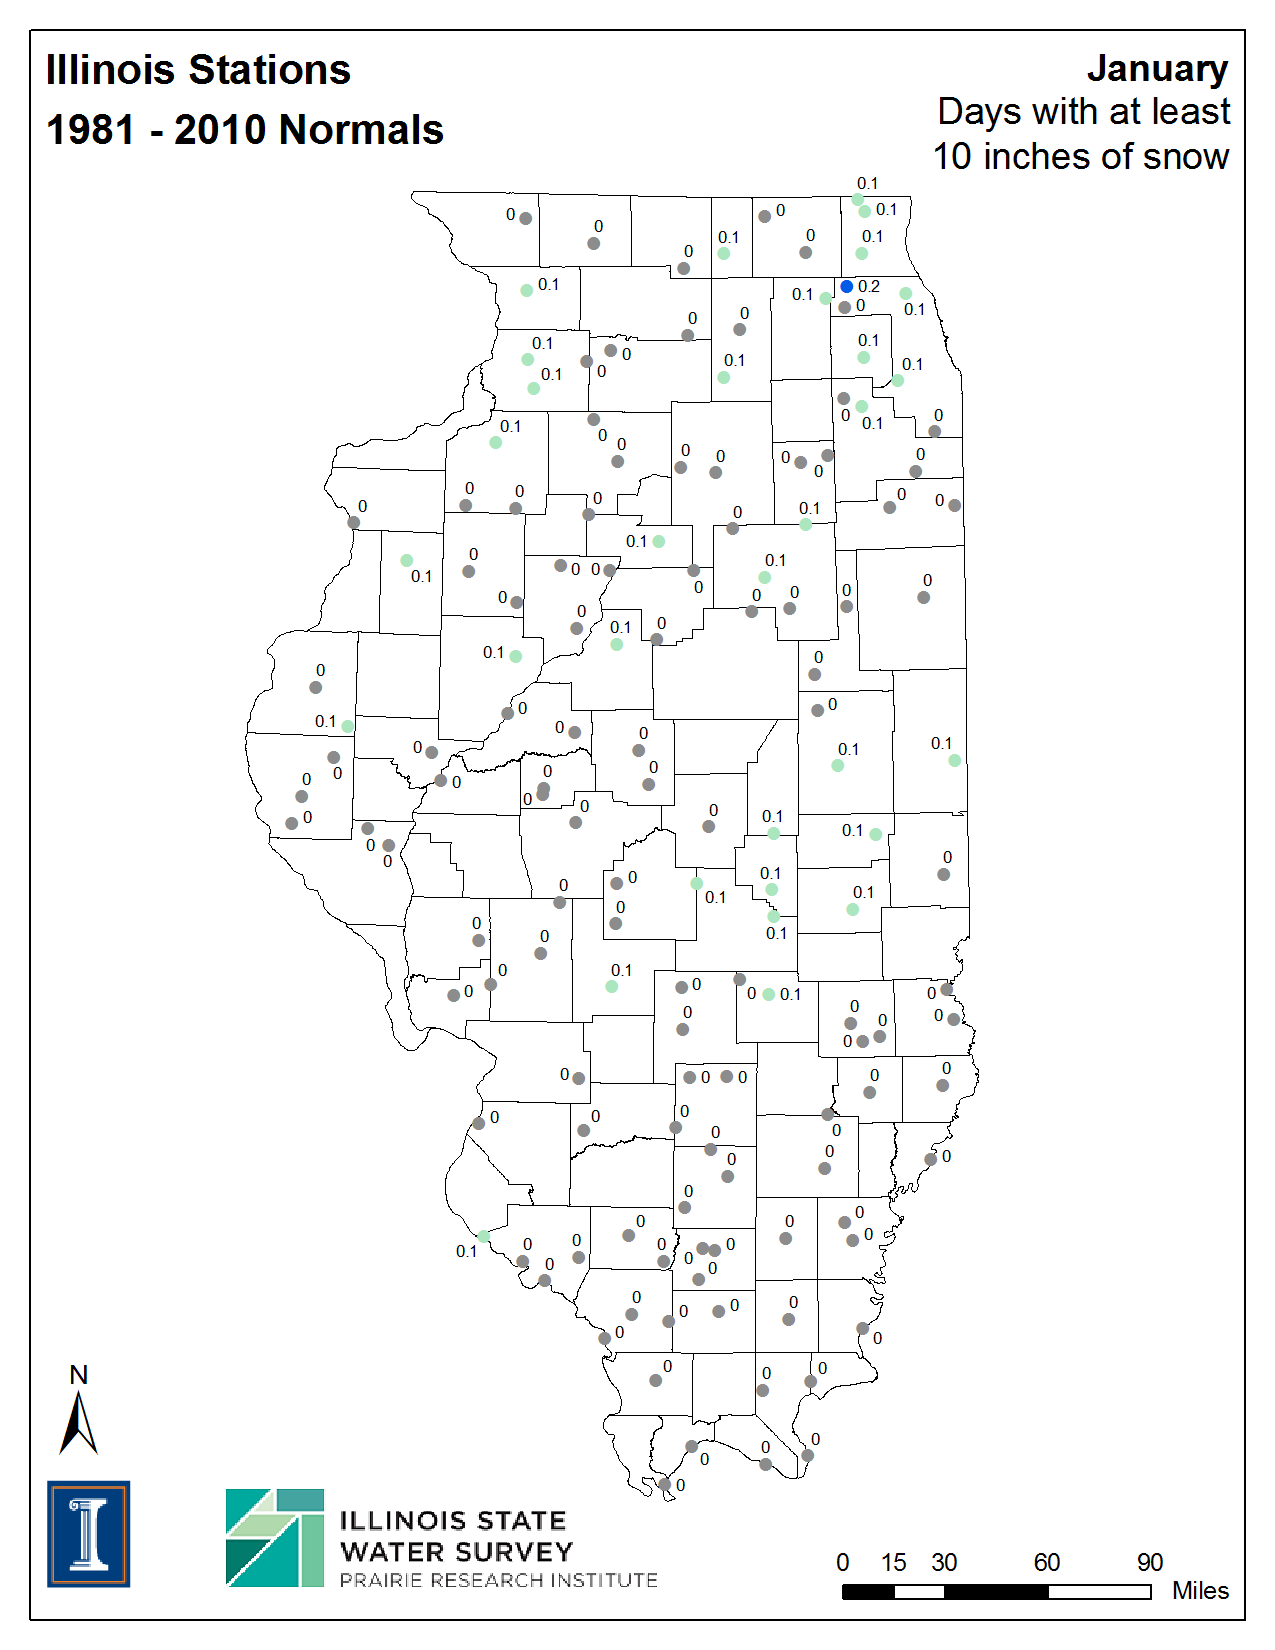
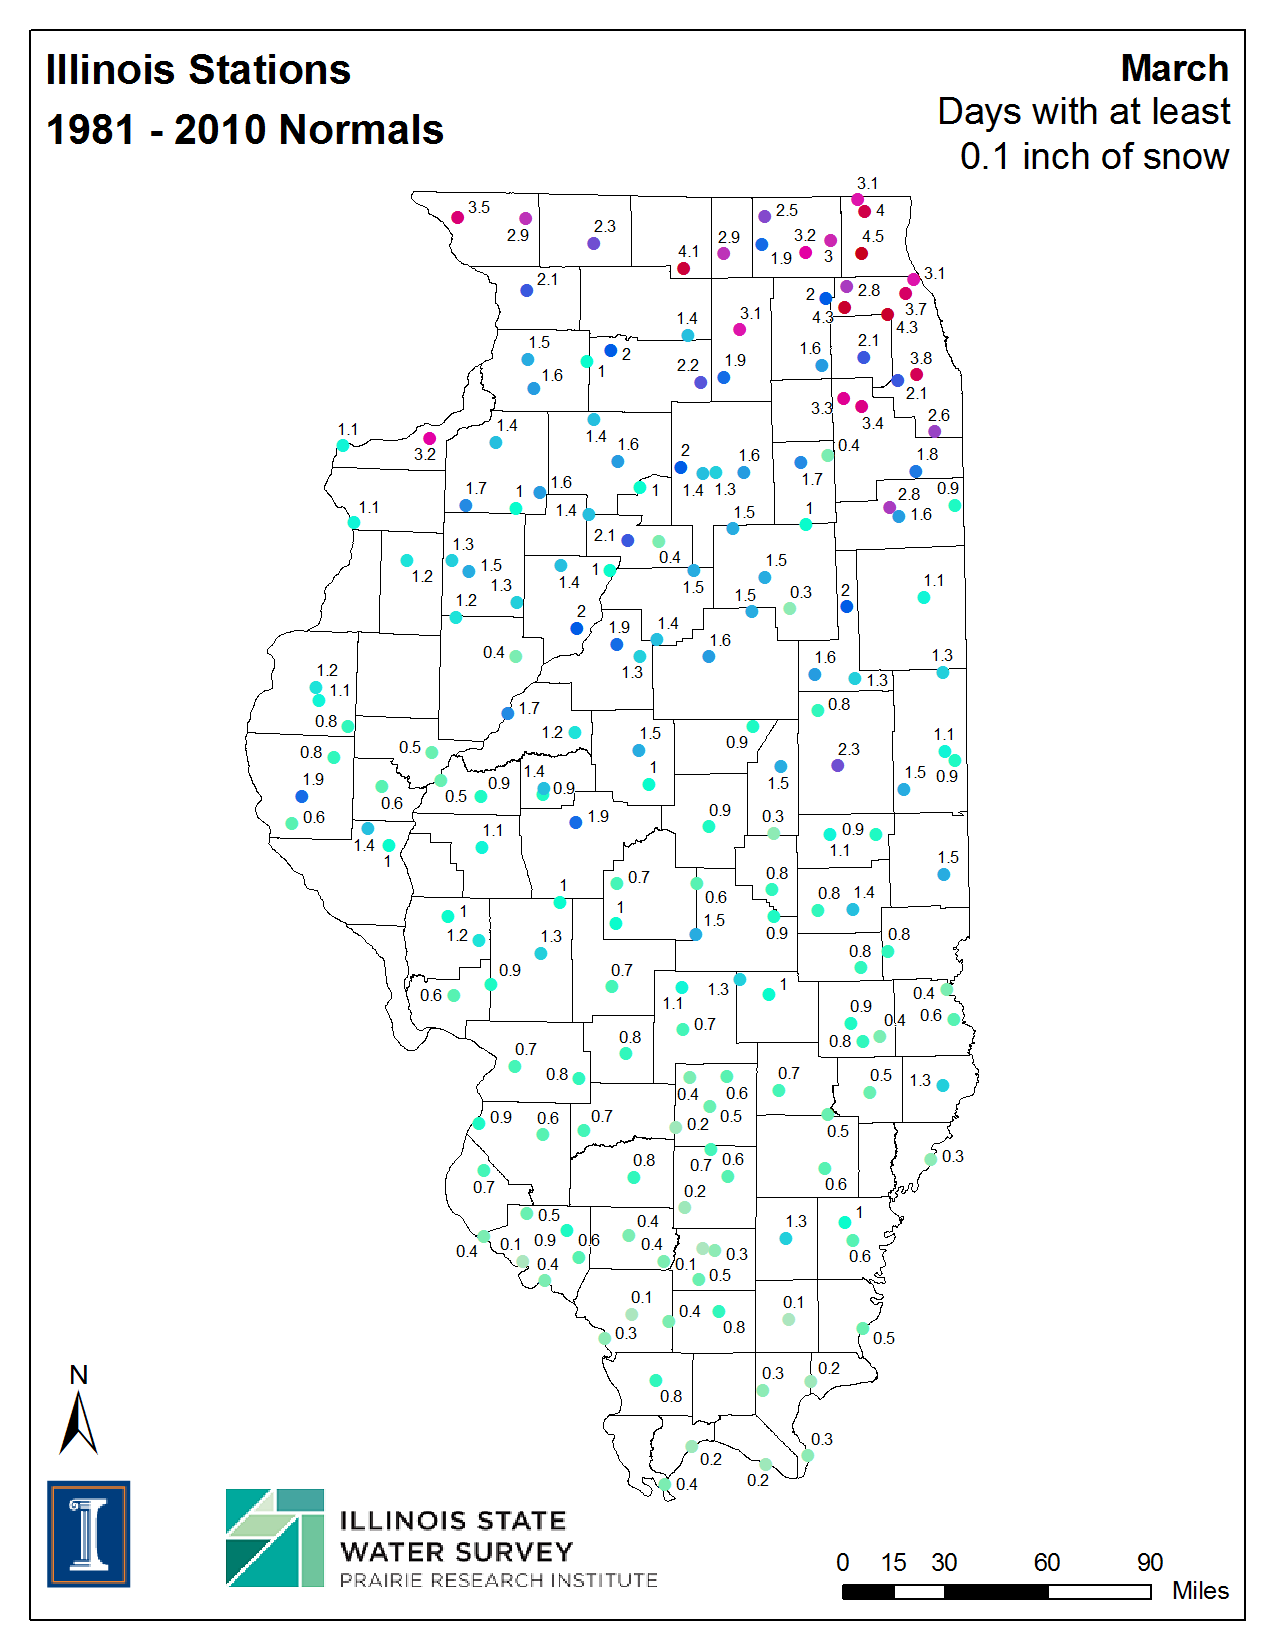
Illinois 1991 – 2020 Normals
NCEI maintains an excellent, easy-to-use data tool for obtaining the updated 30-year normals, as well as the older (1981 – 2010) normals and the new 15-year normals (2006 – 2020): https://www.ncei.noaa.gov/access/us-climate-normals/.
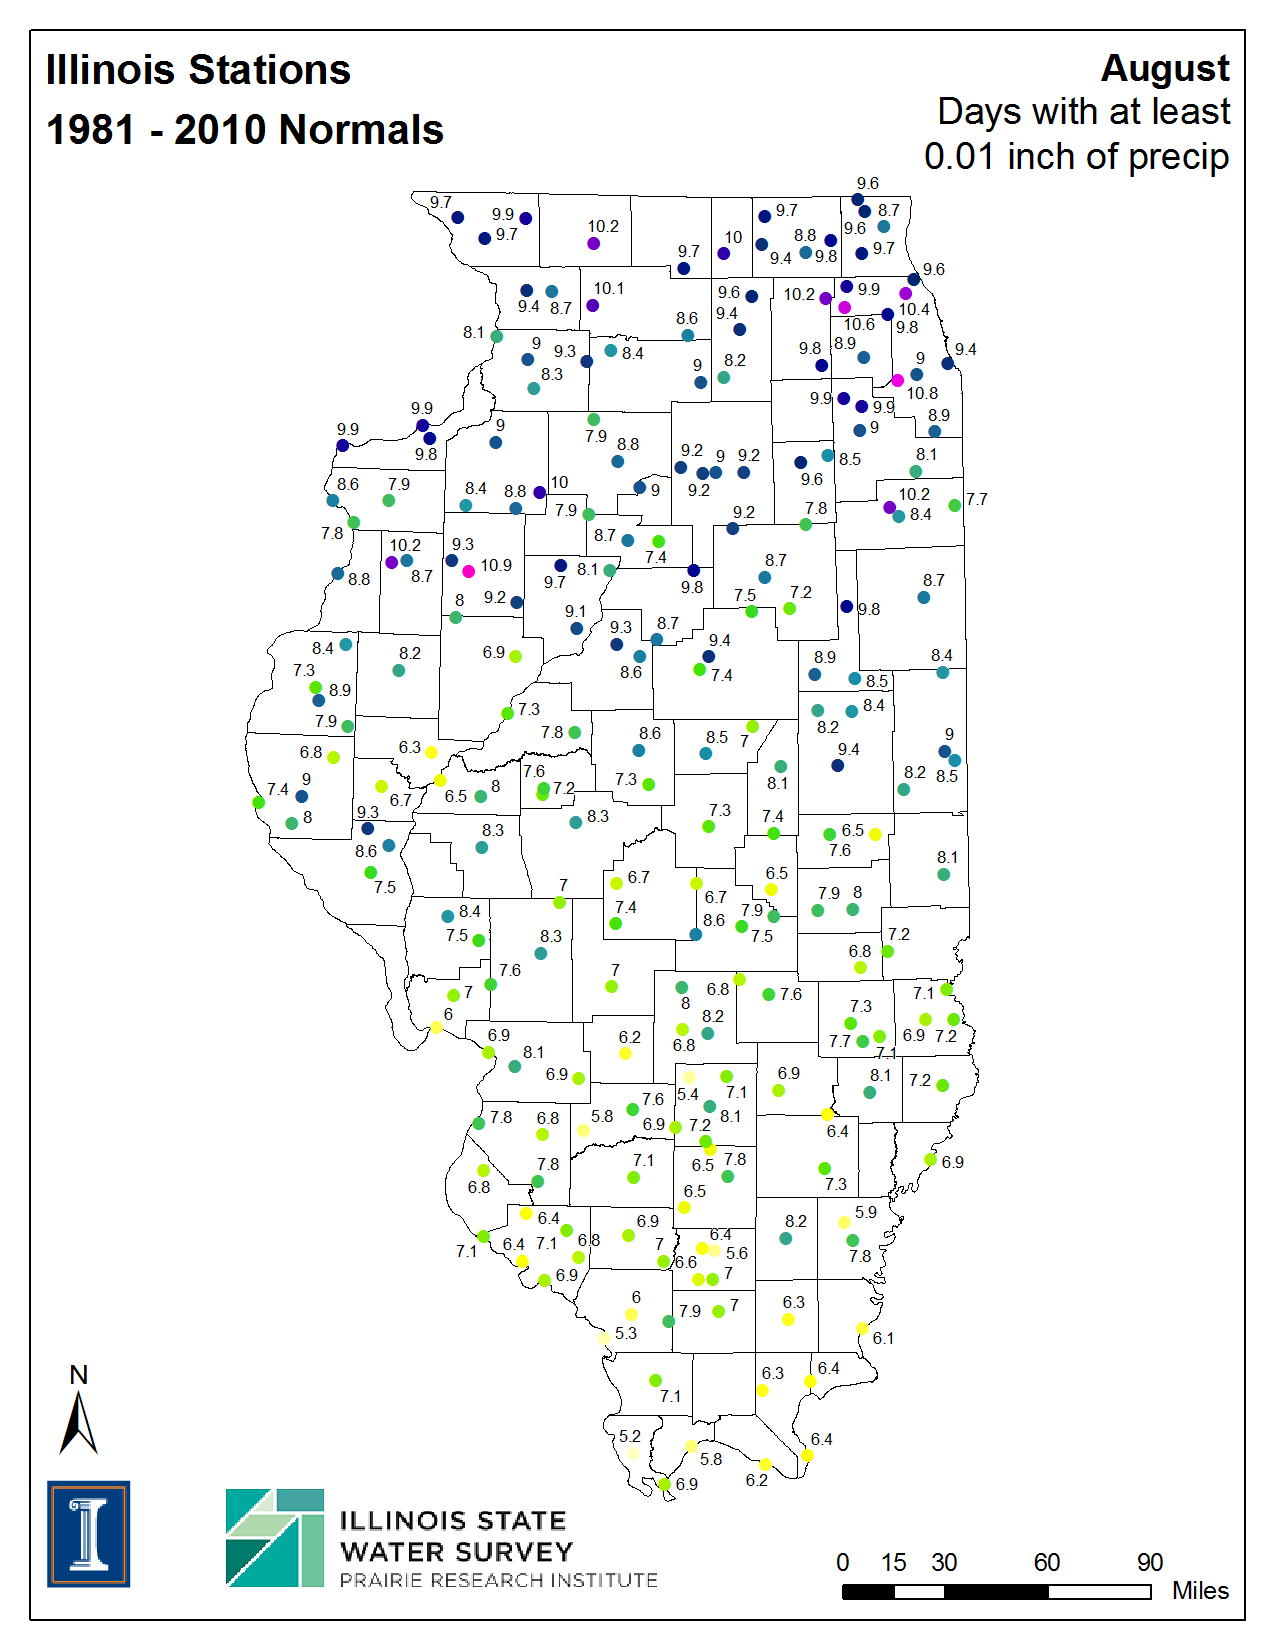
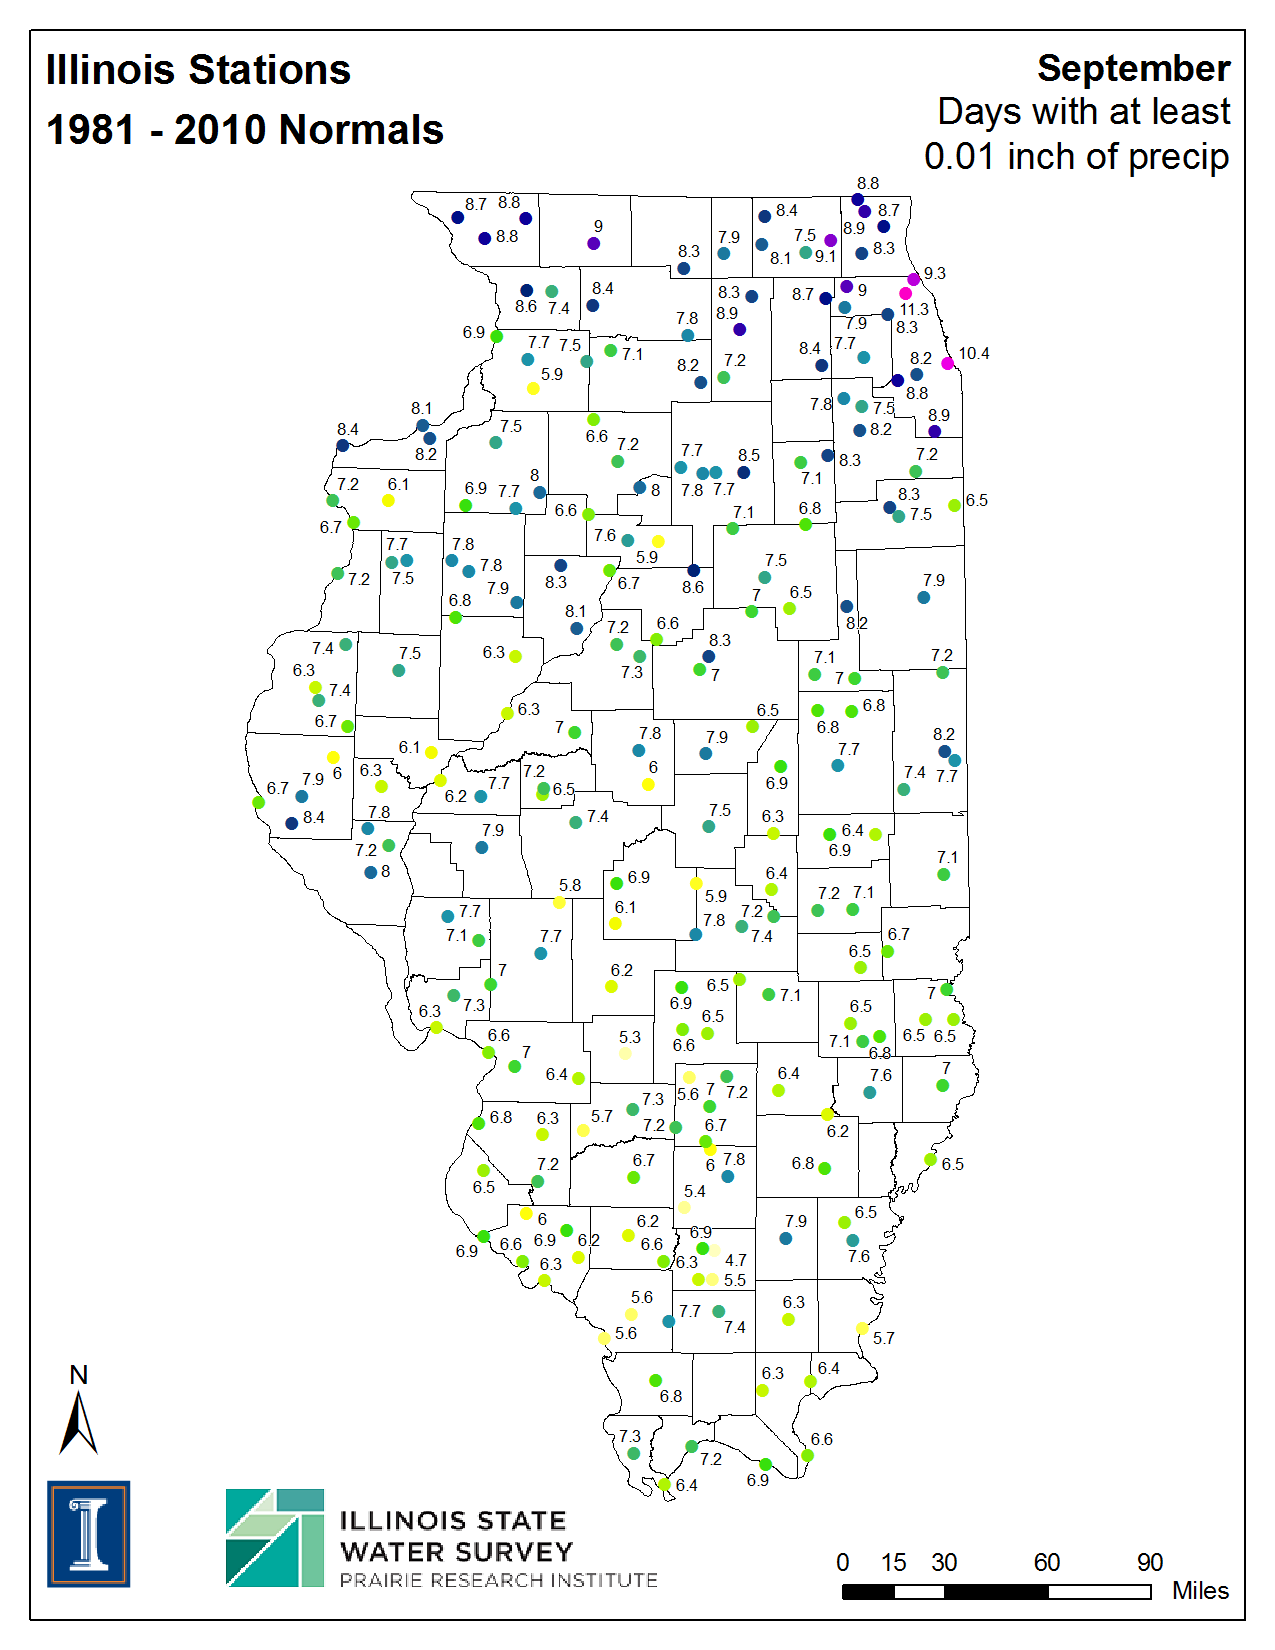
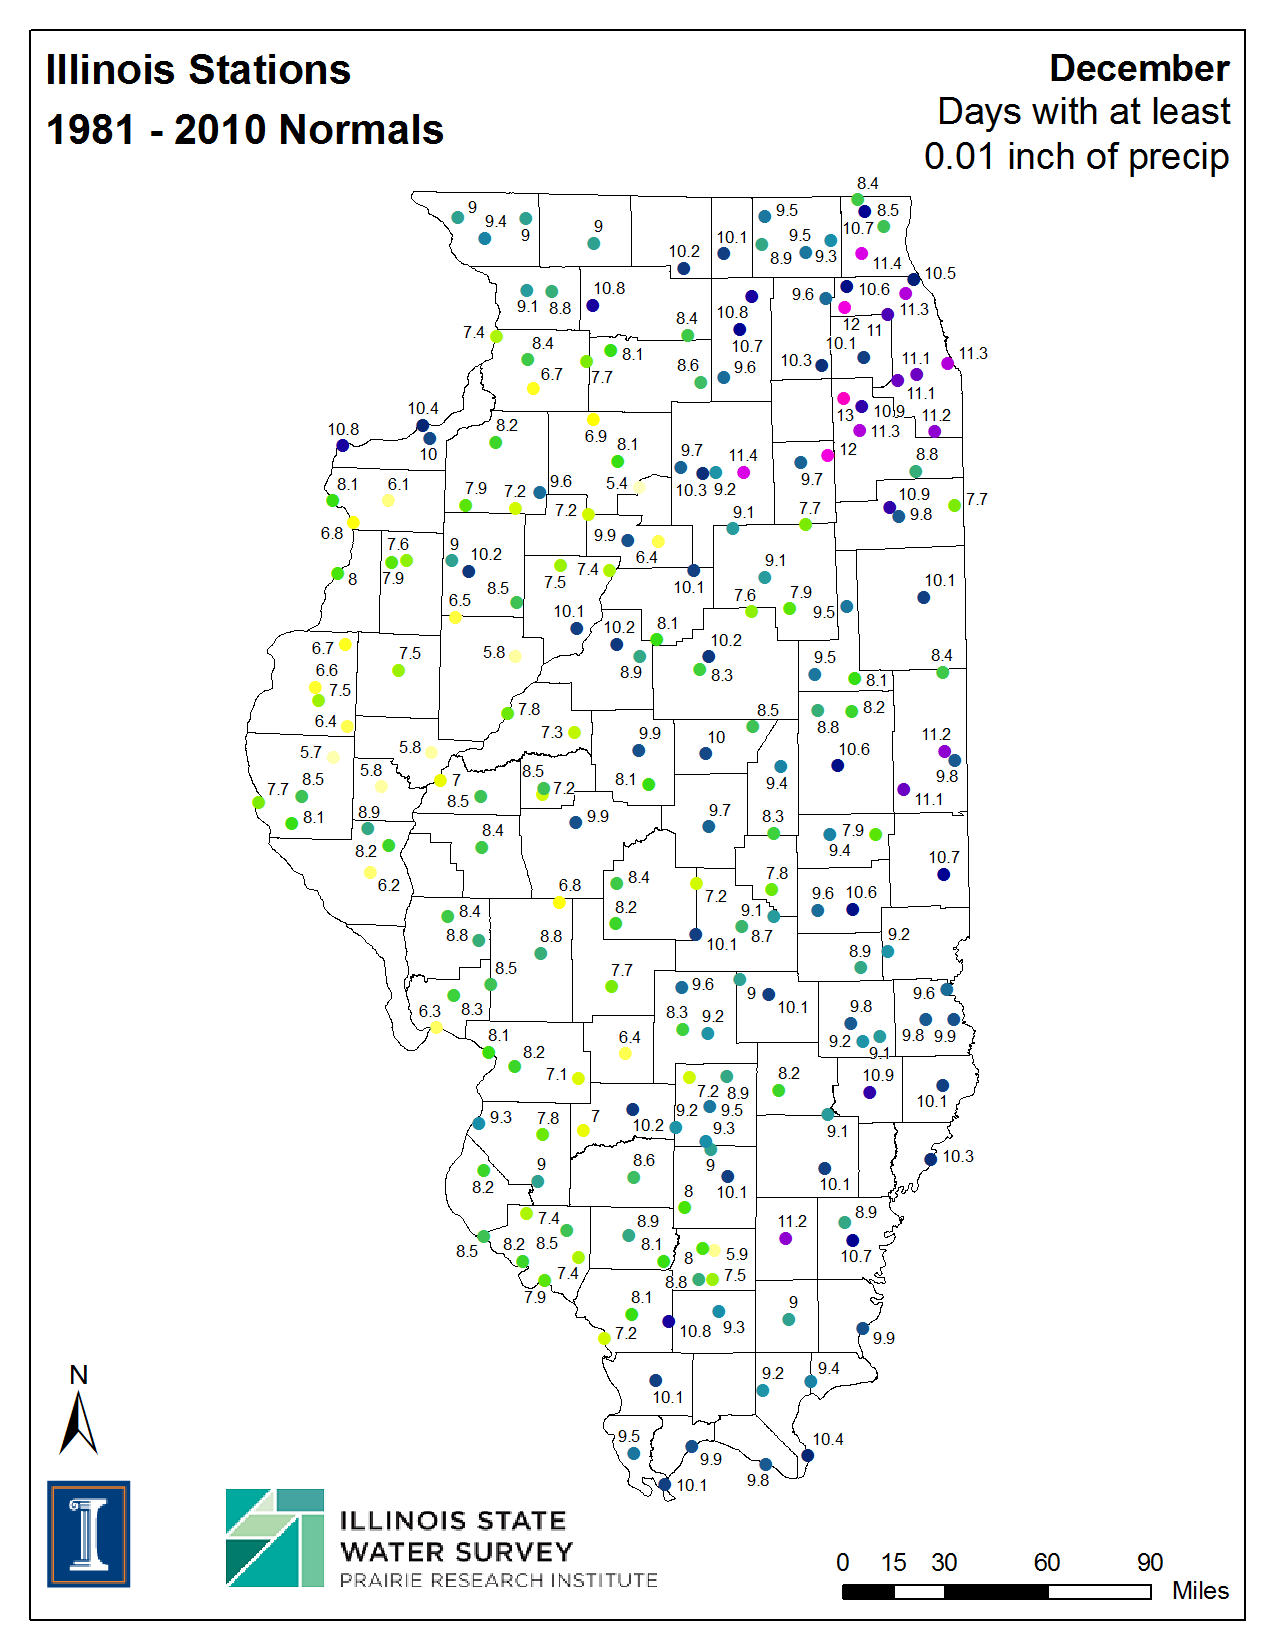
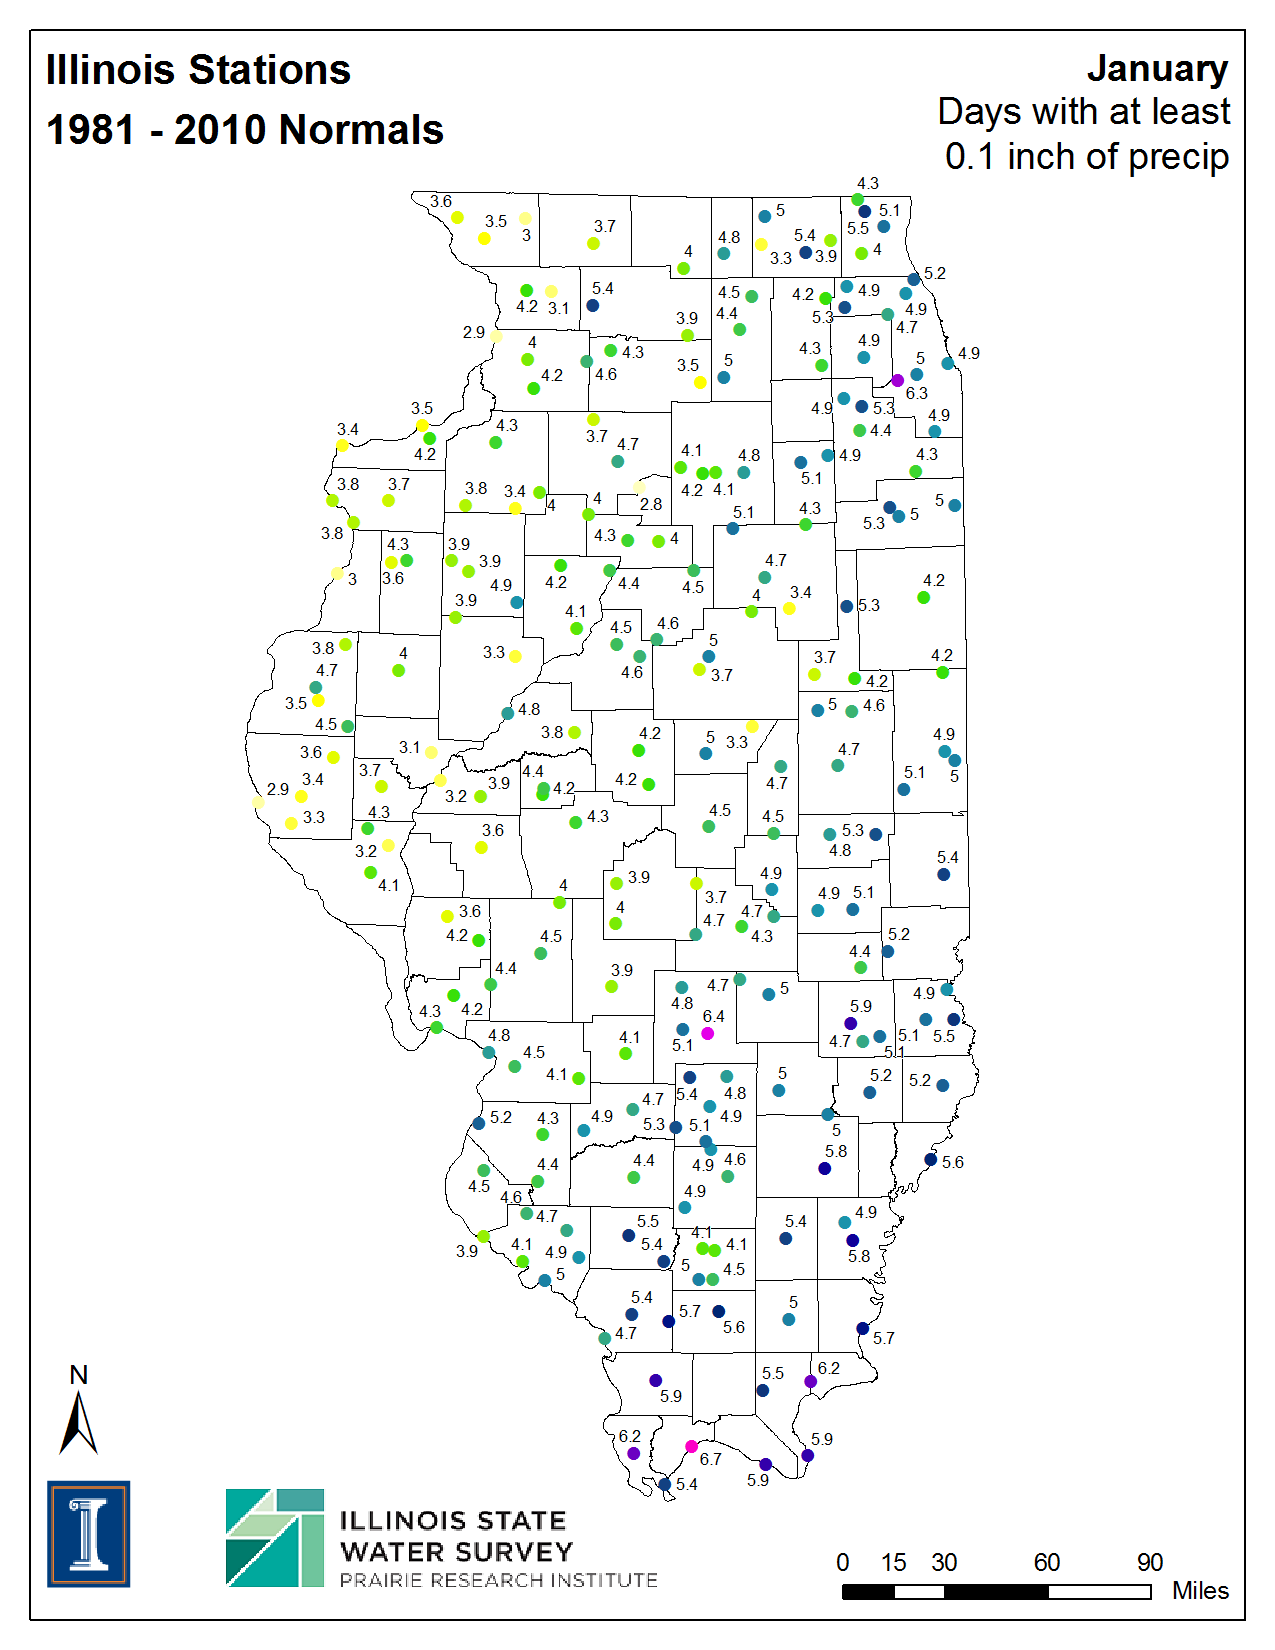
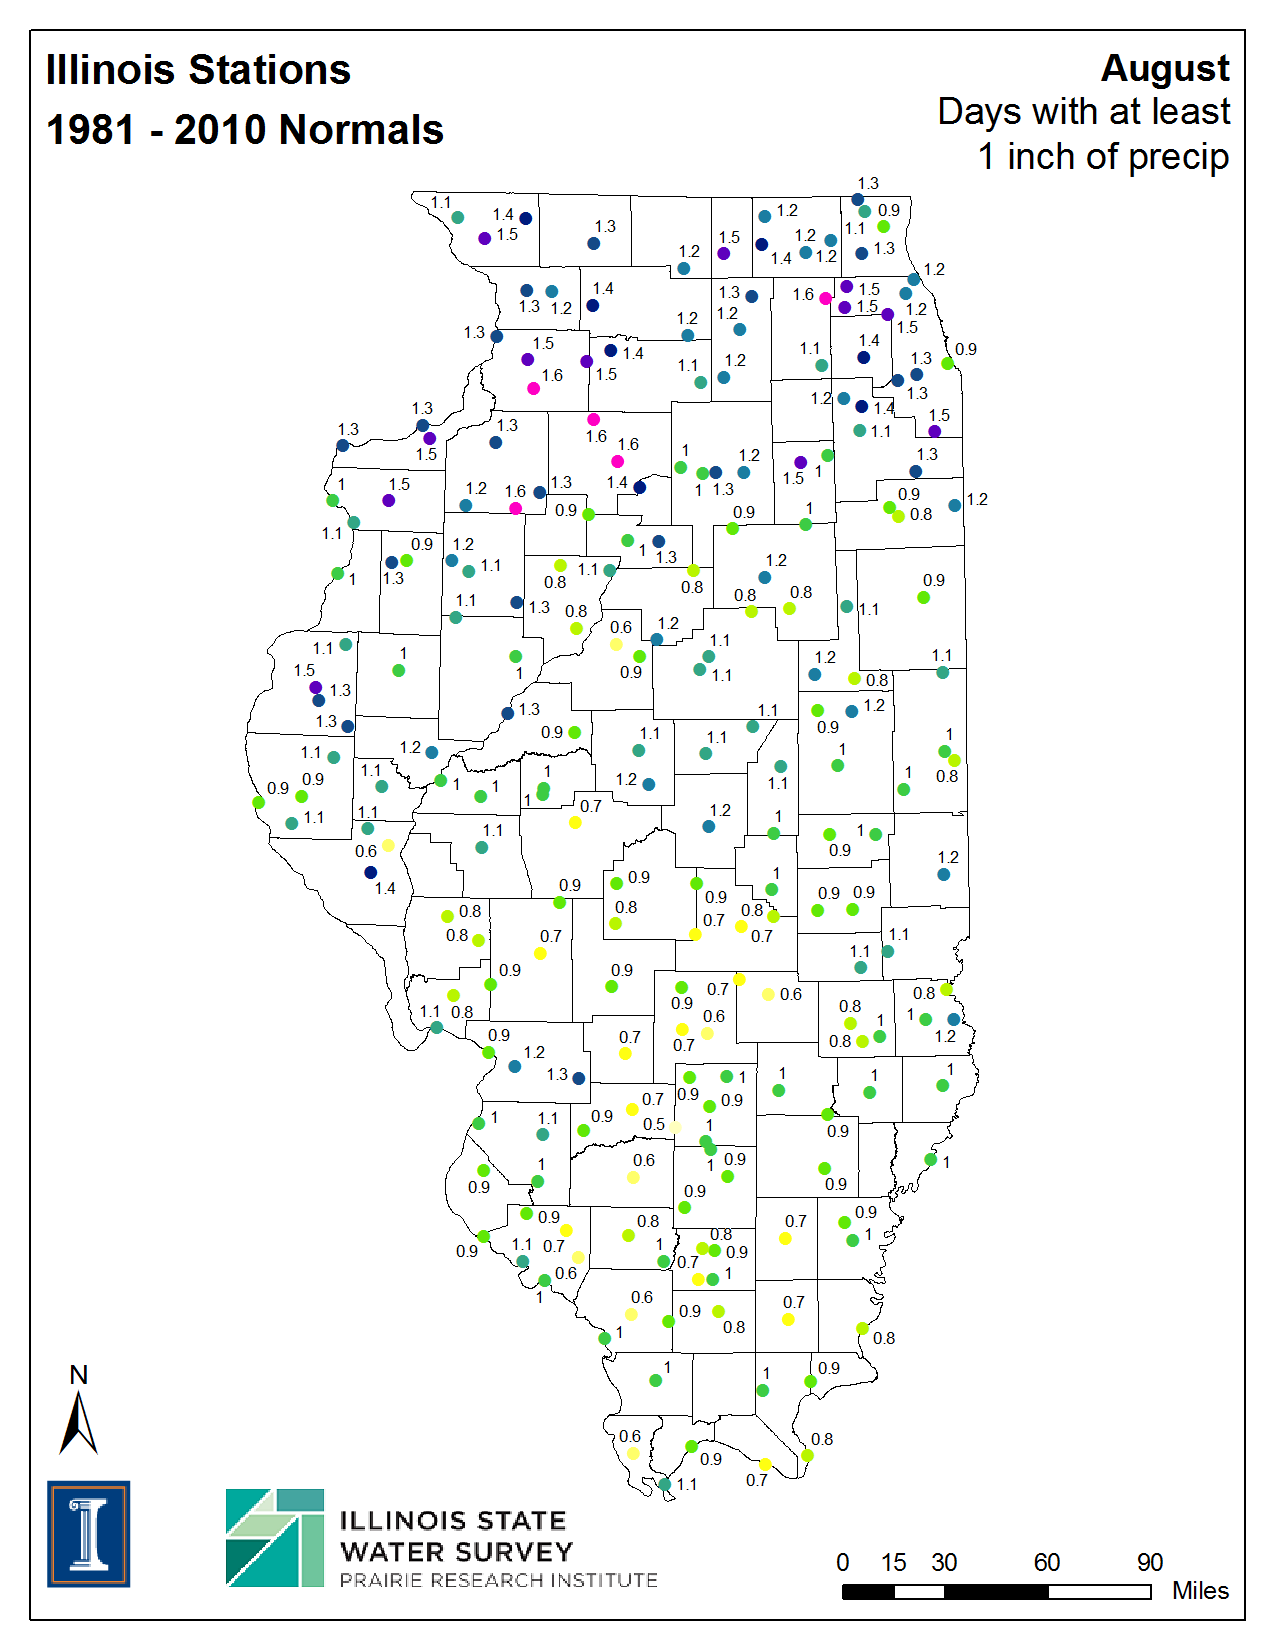
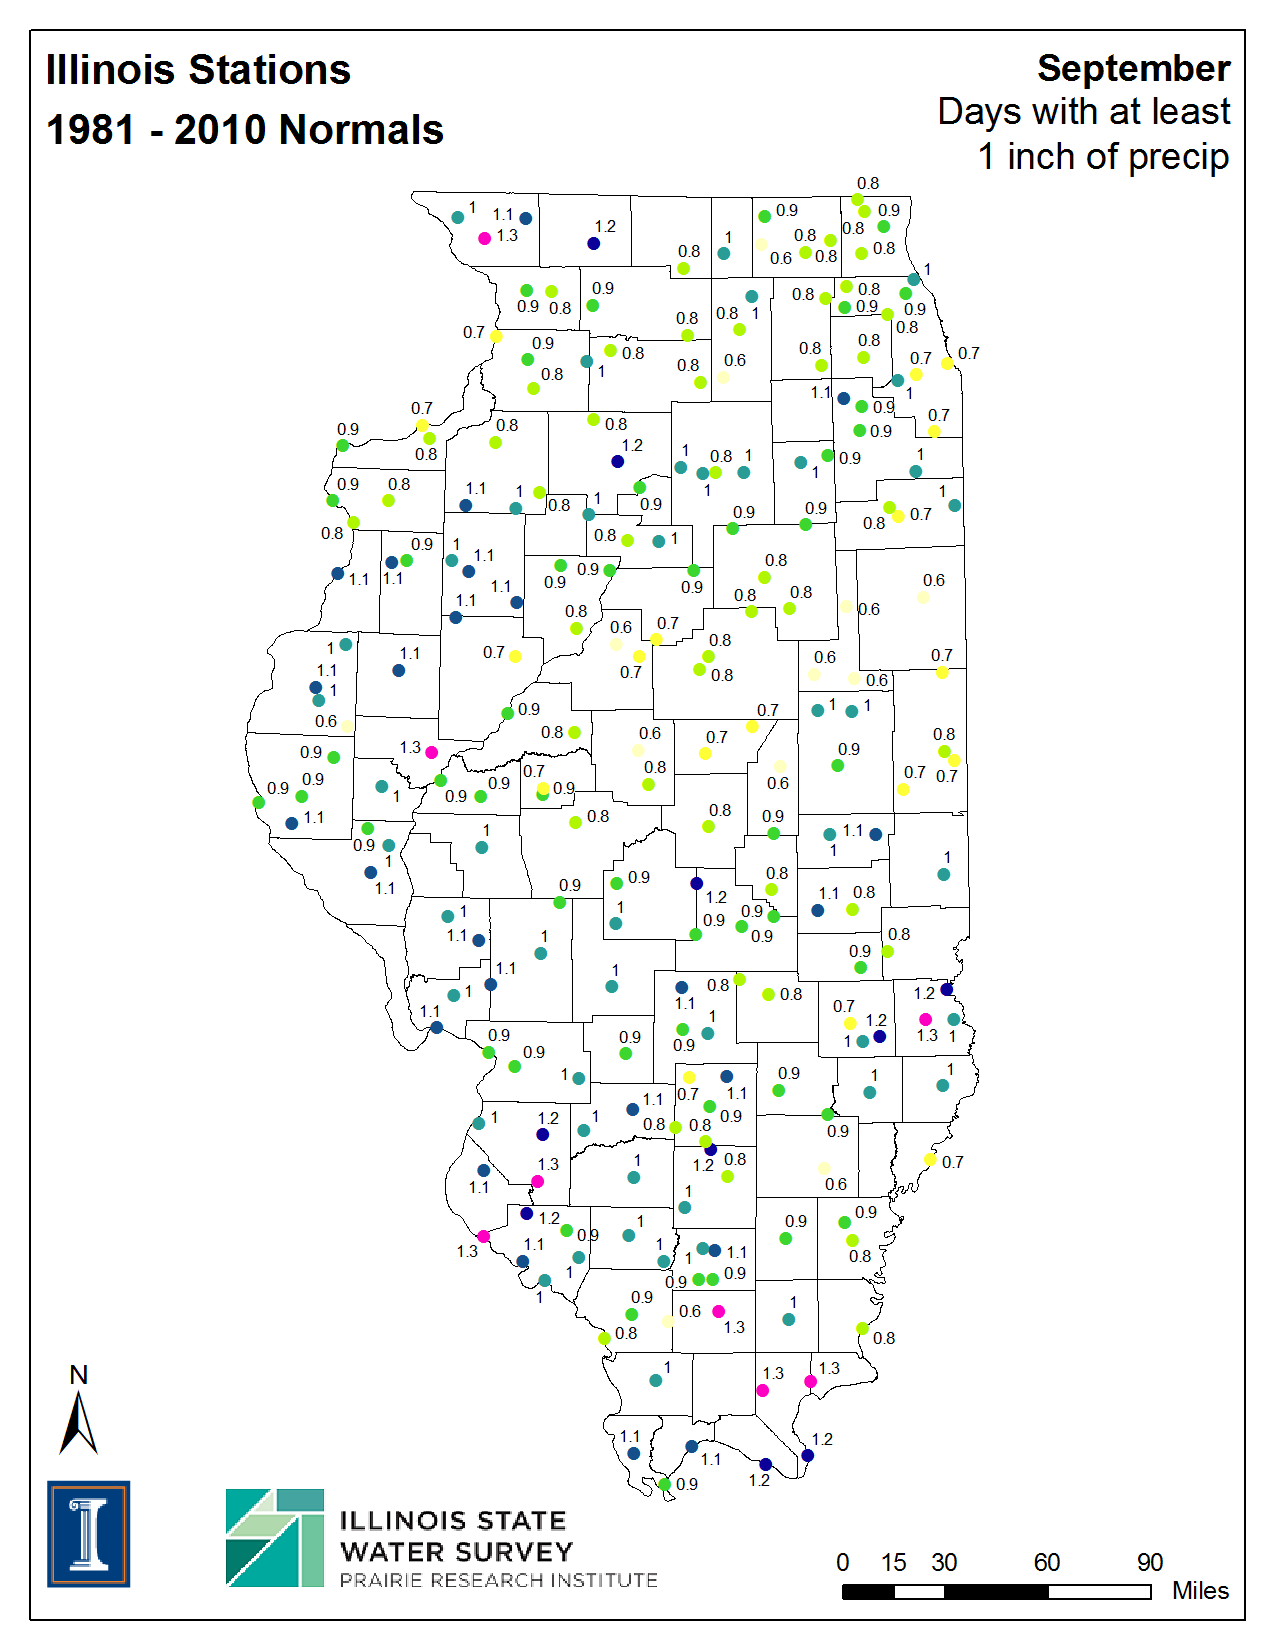
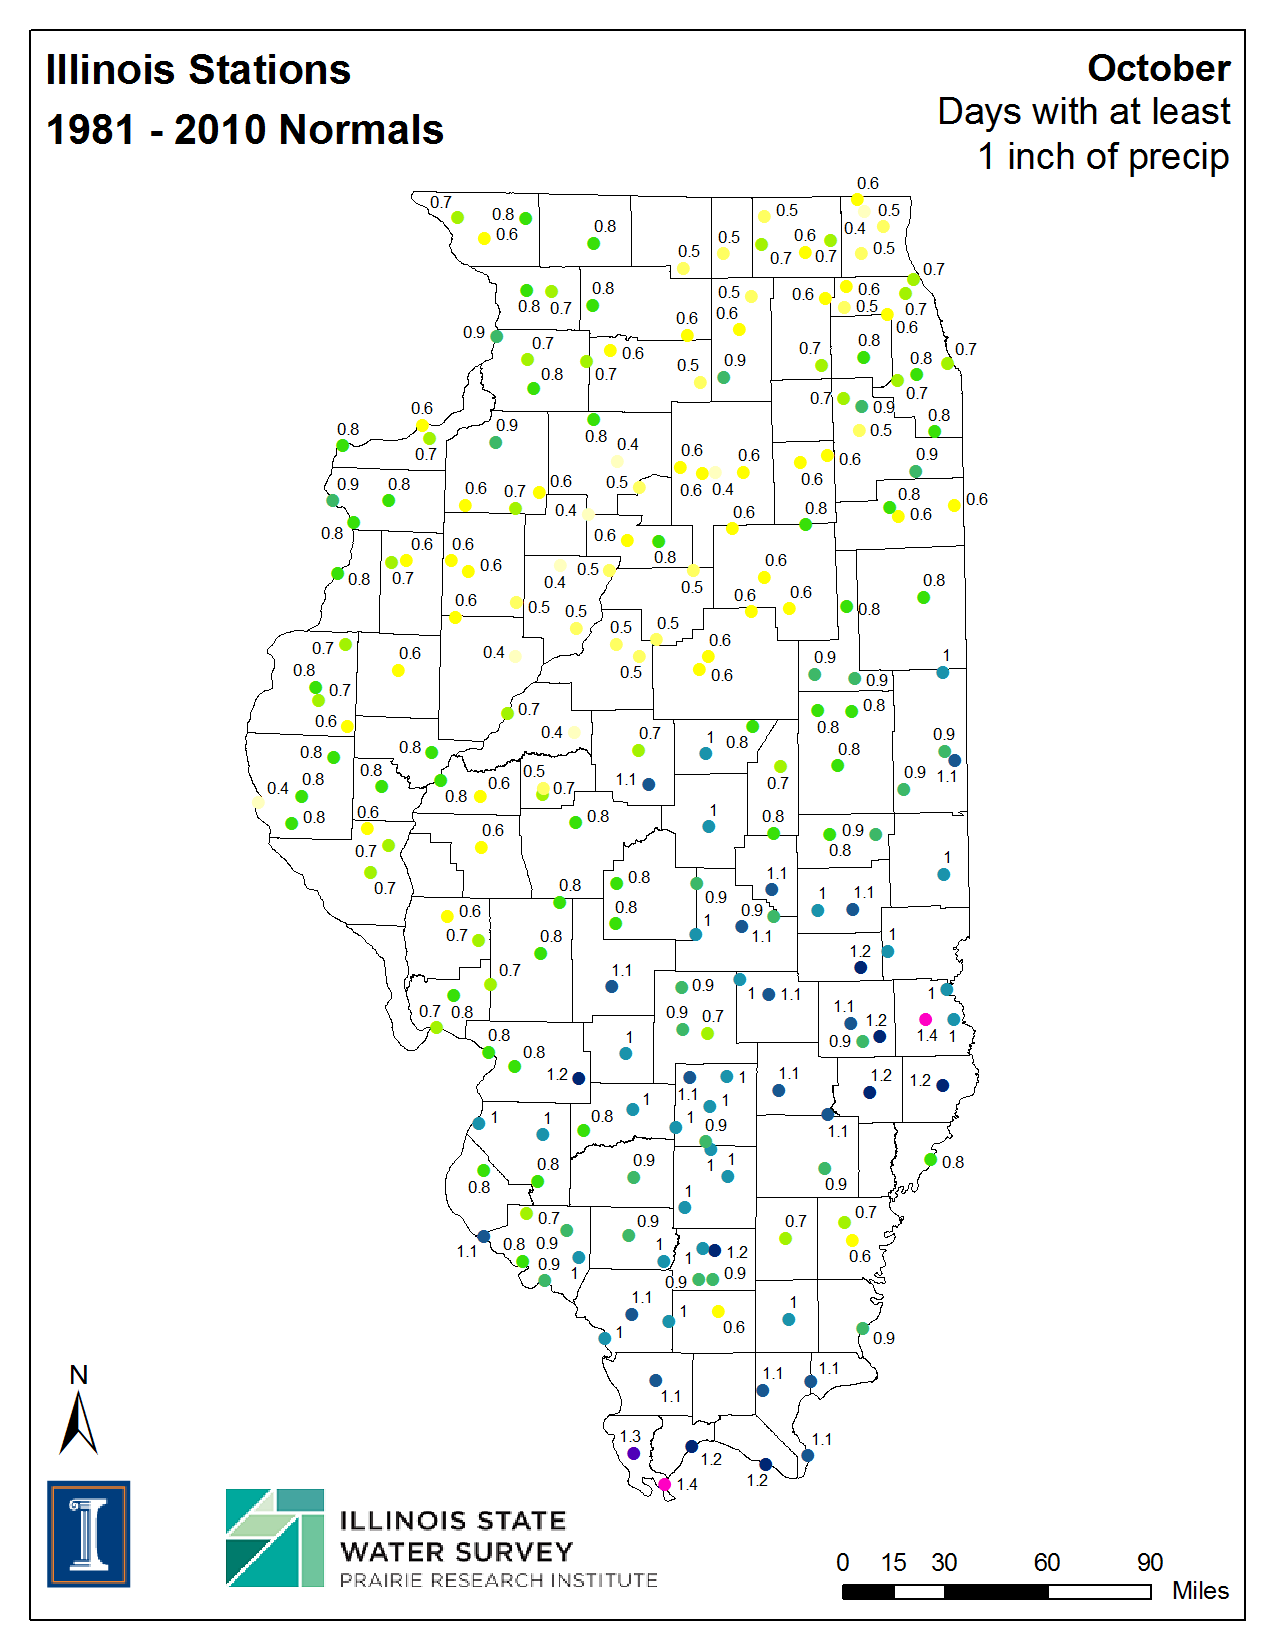
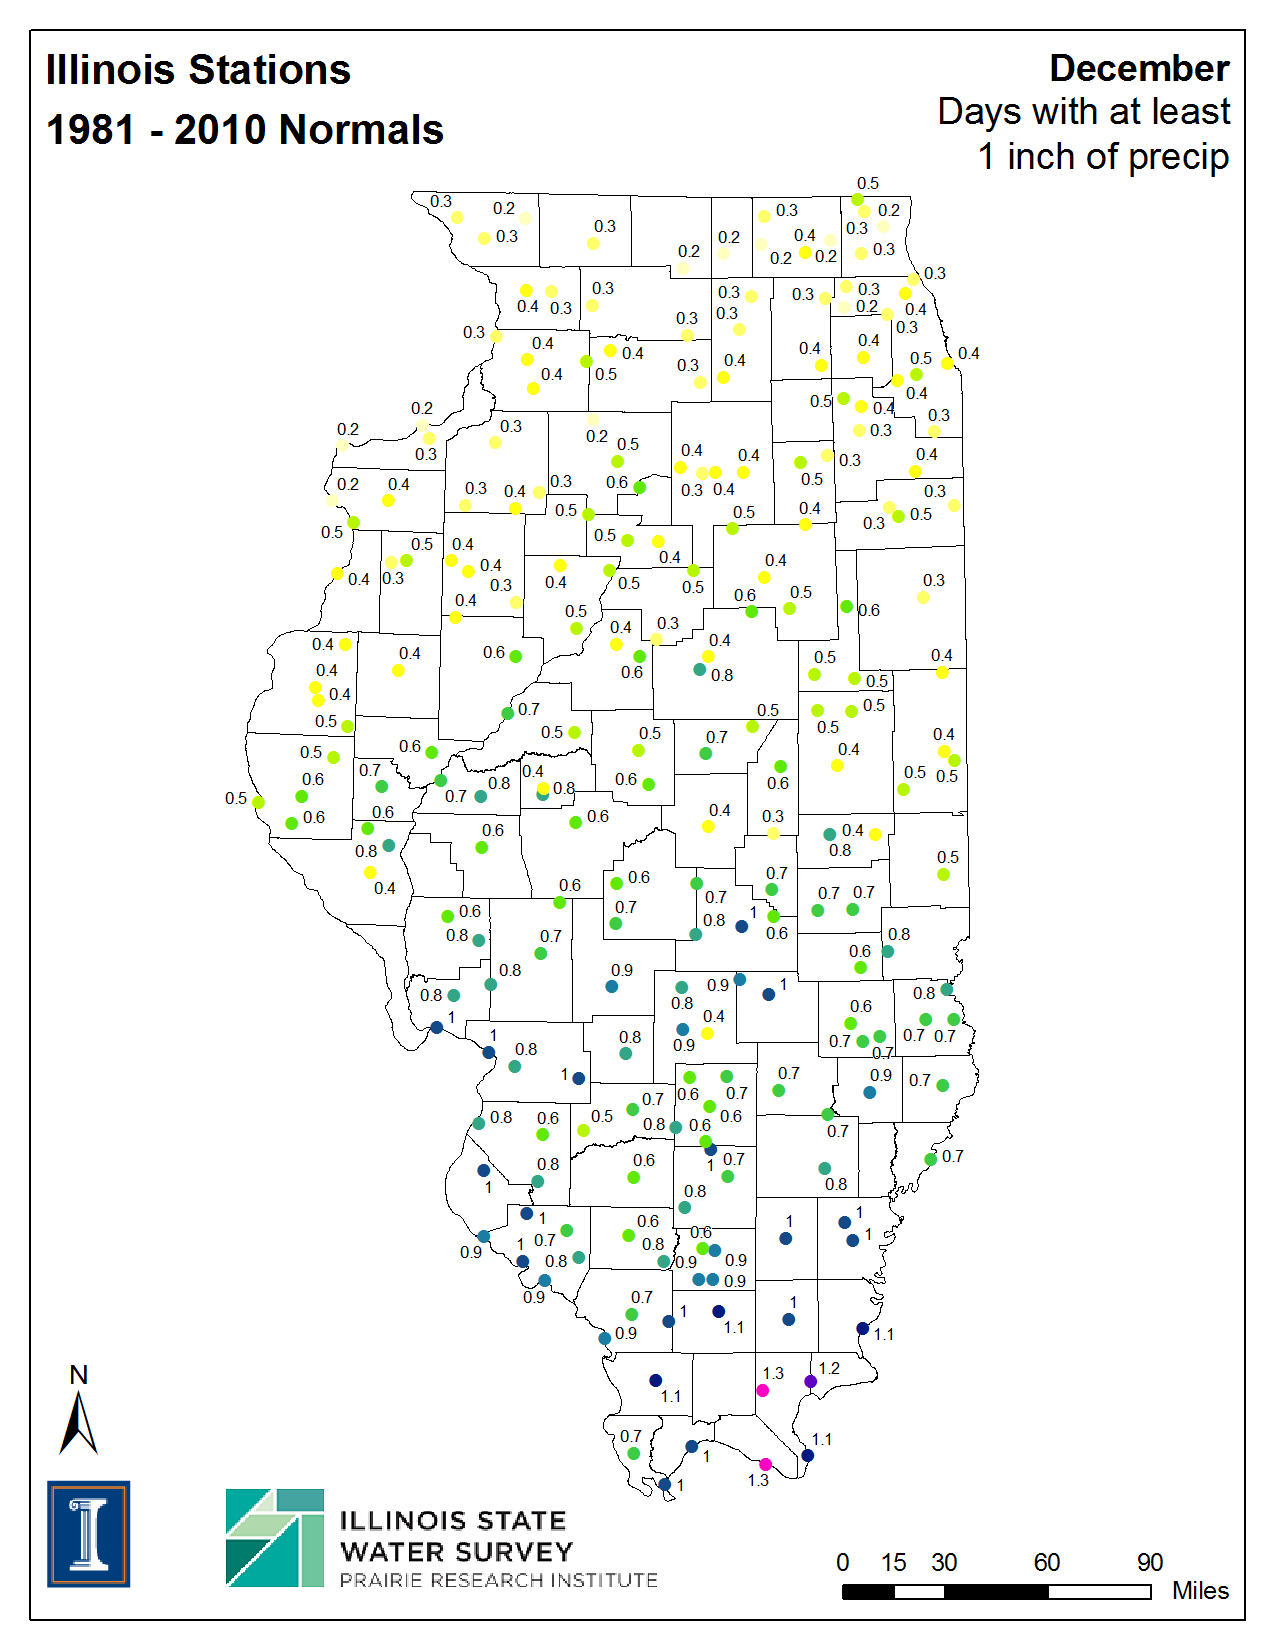
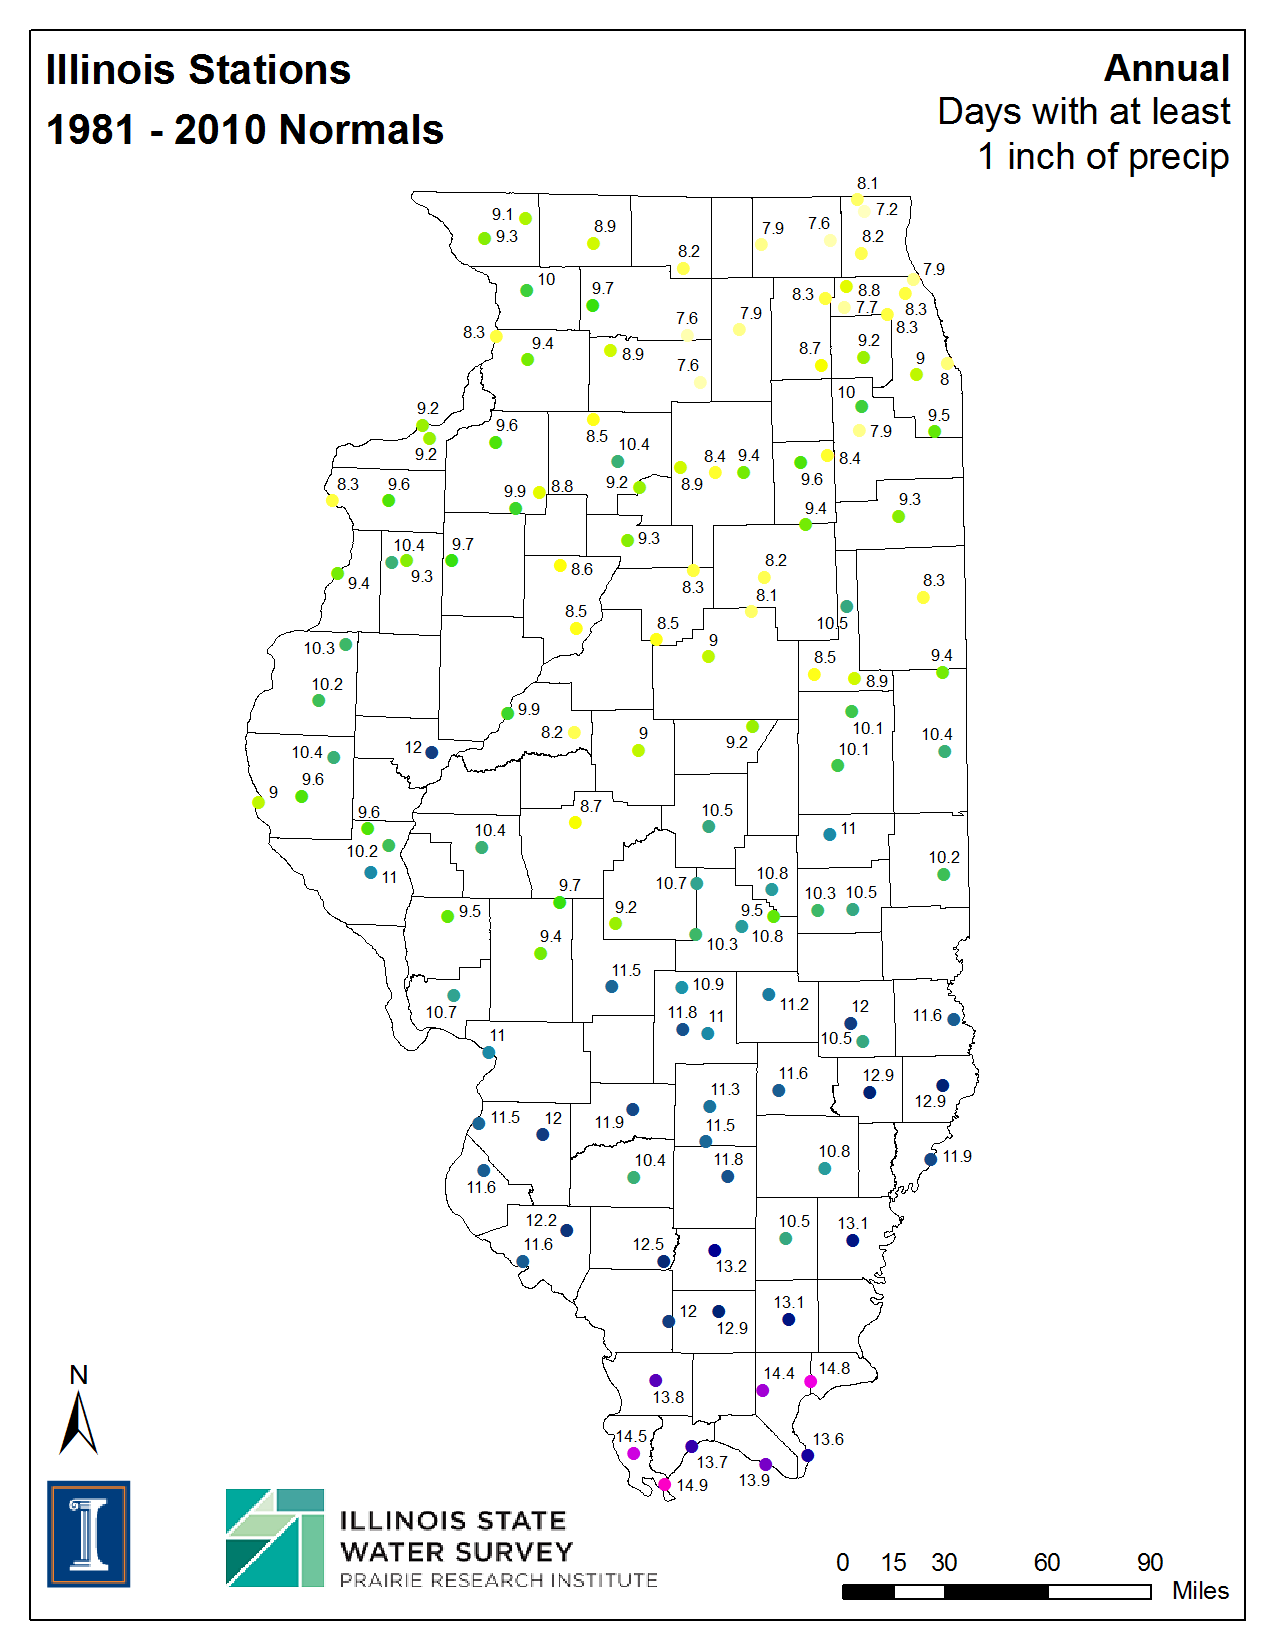
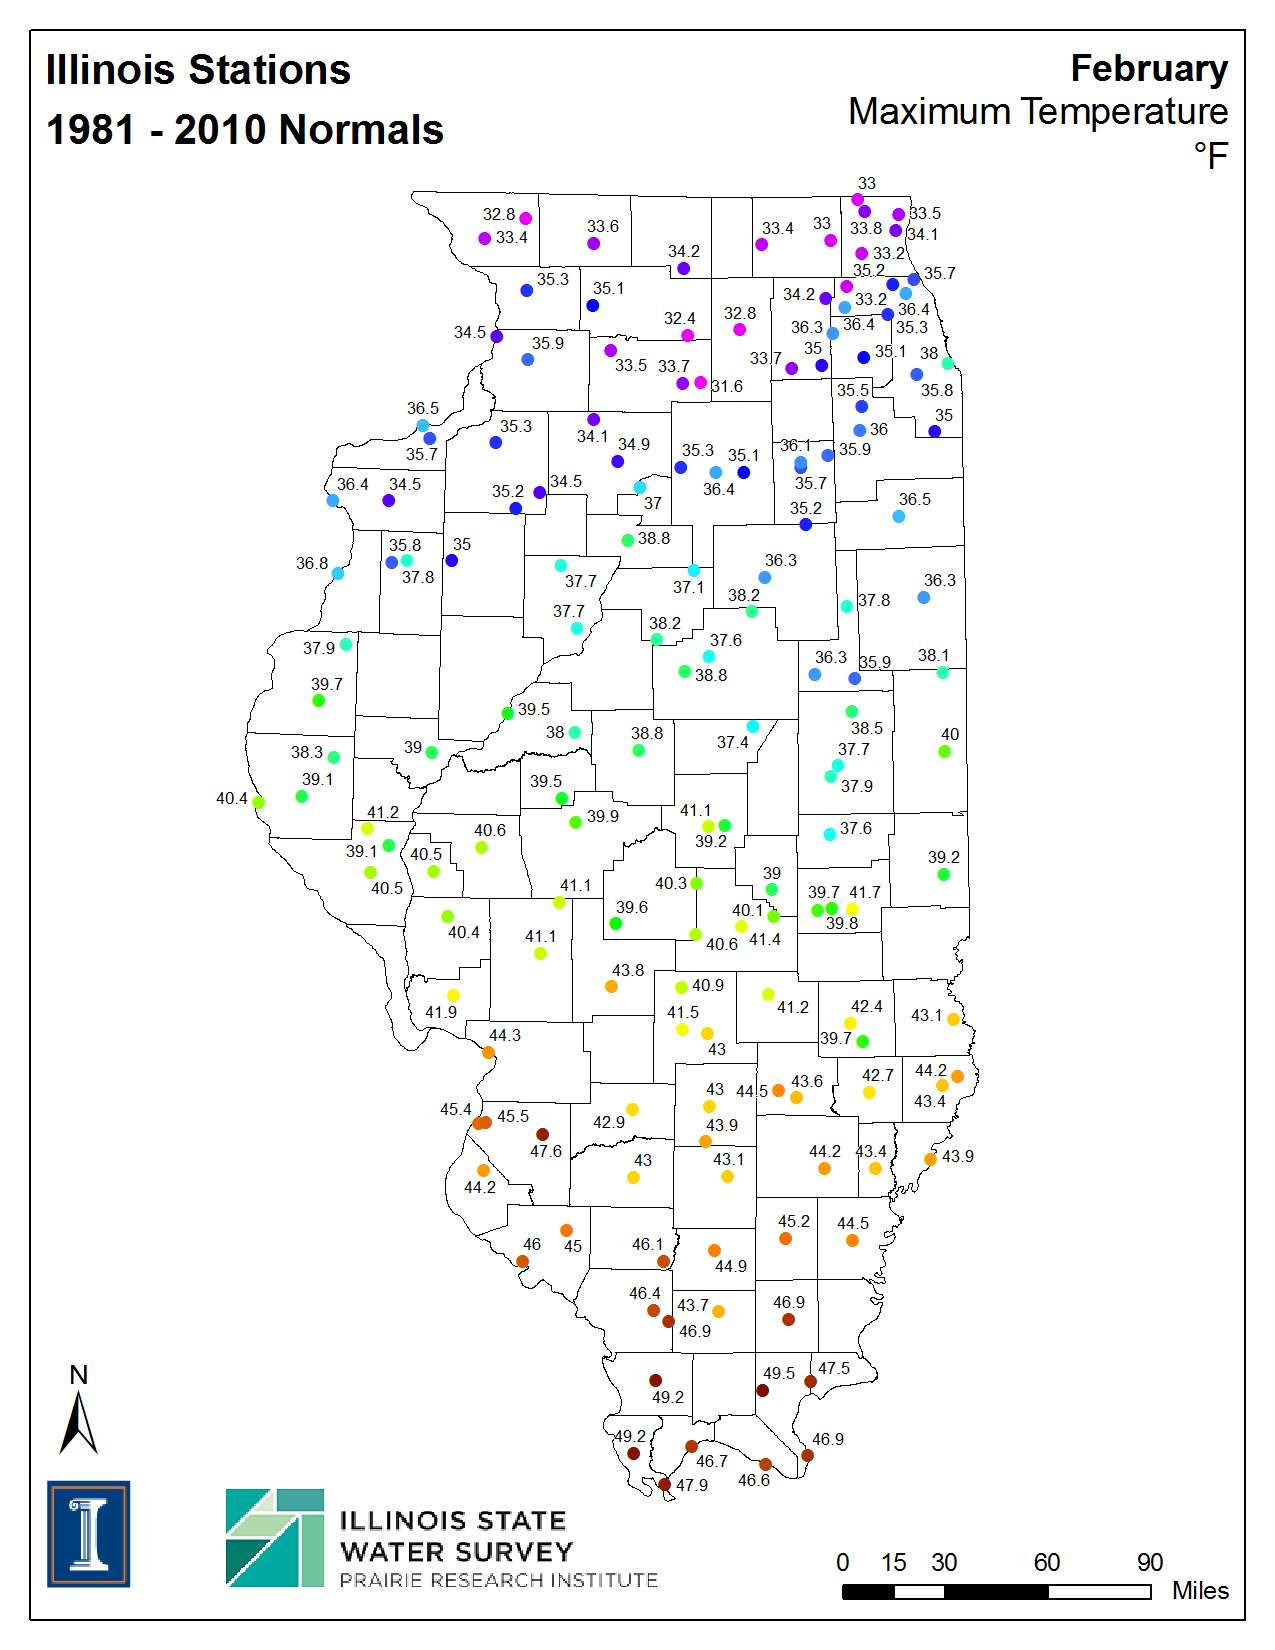
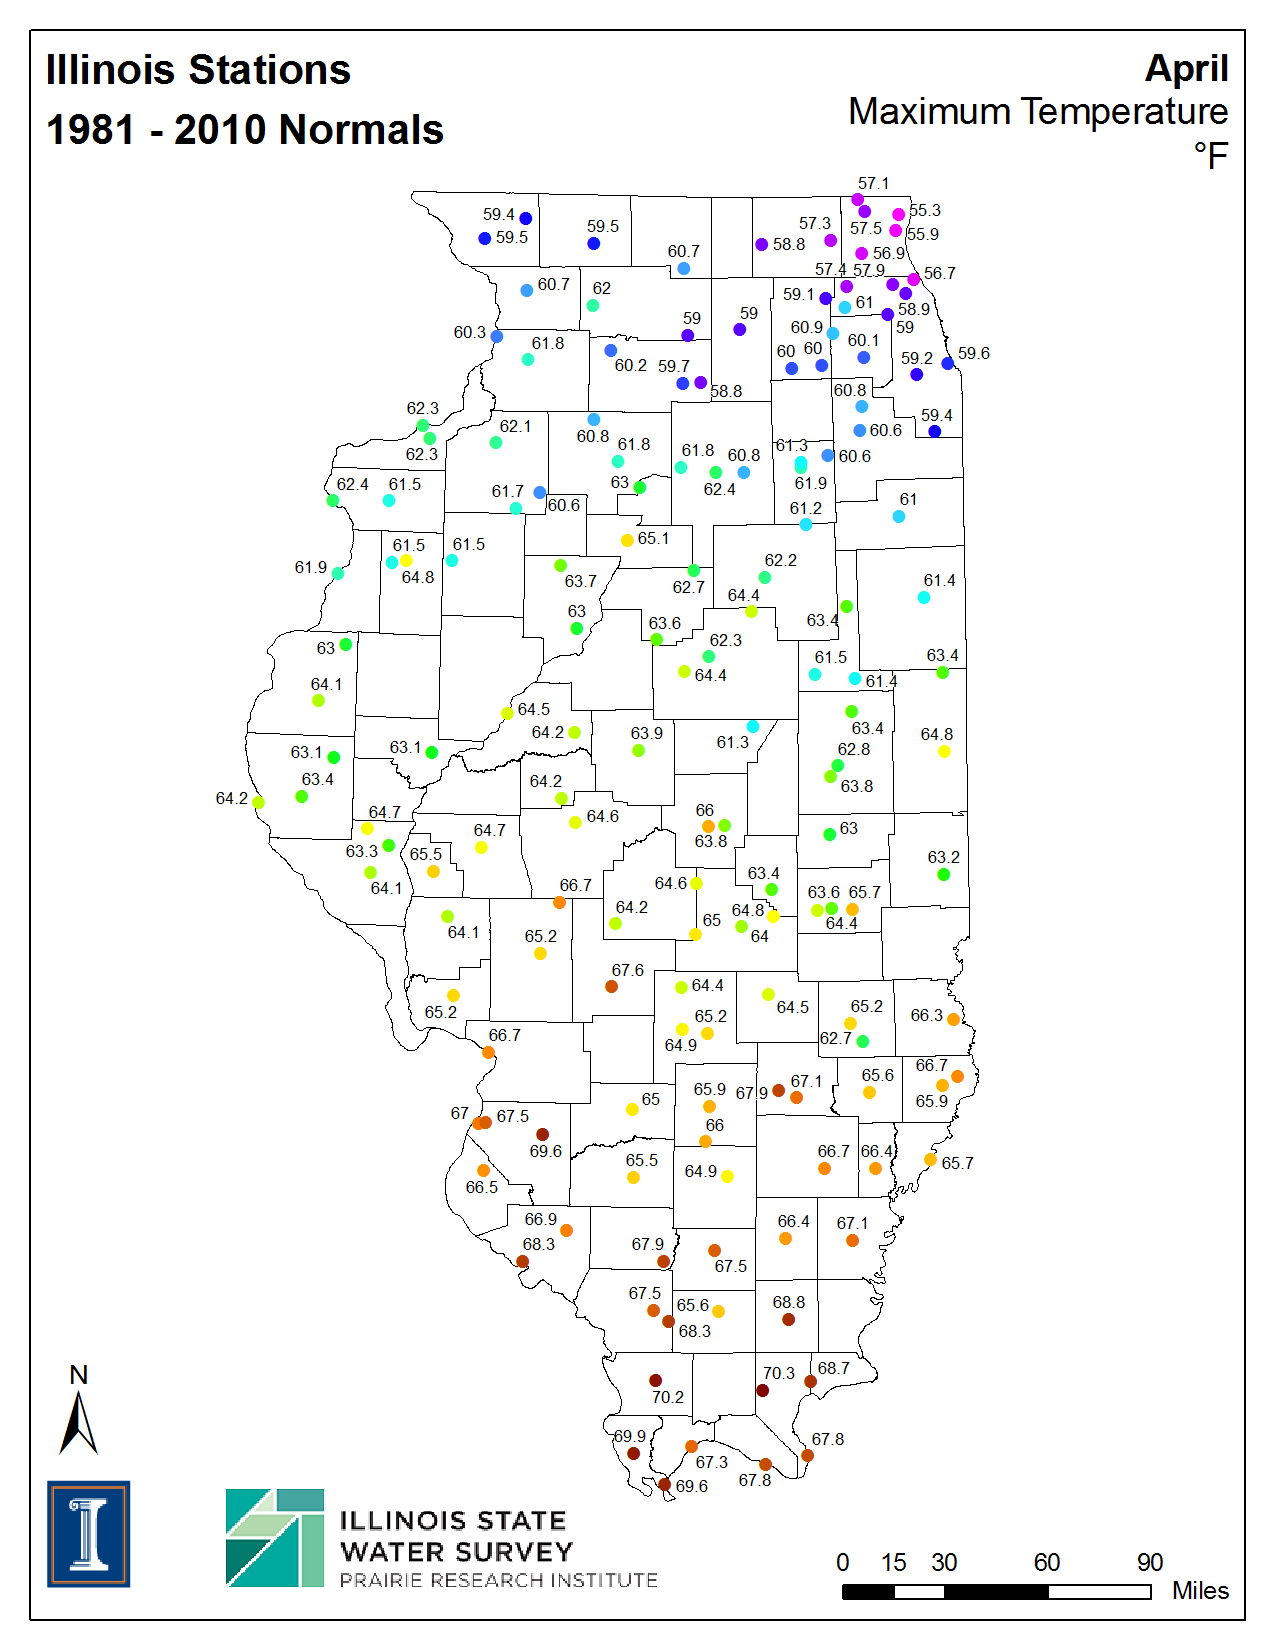
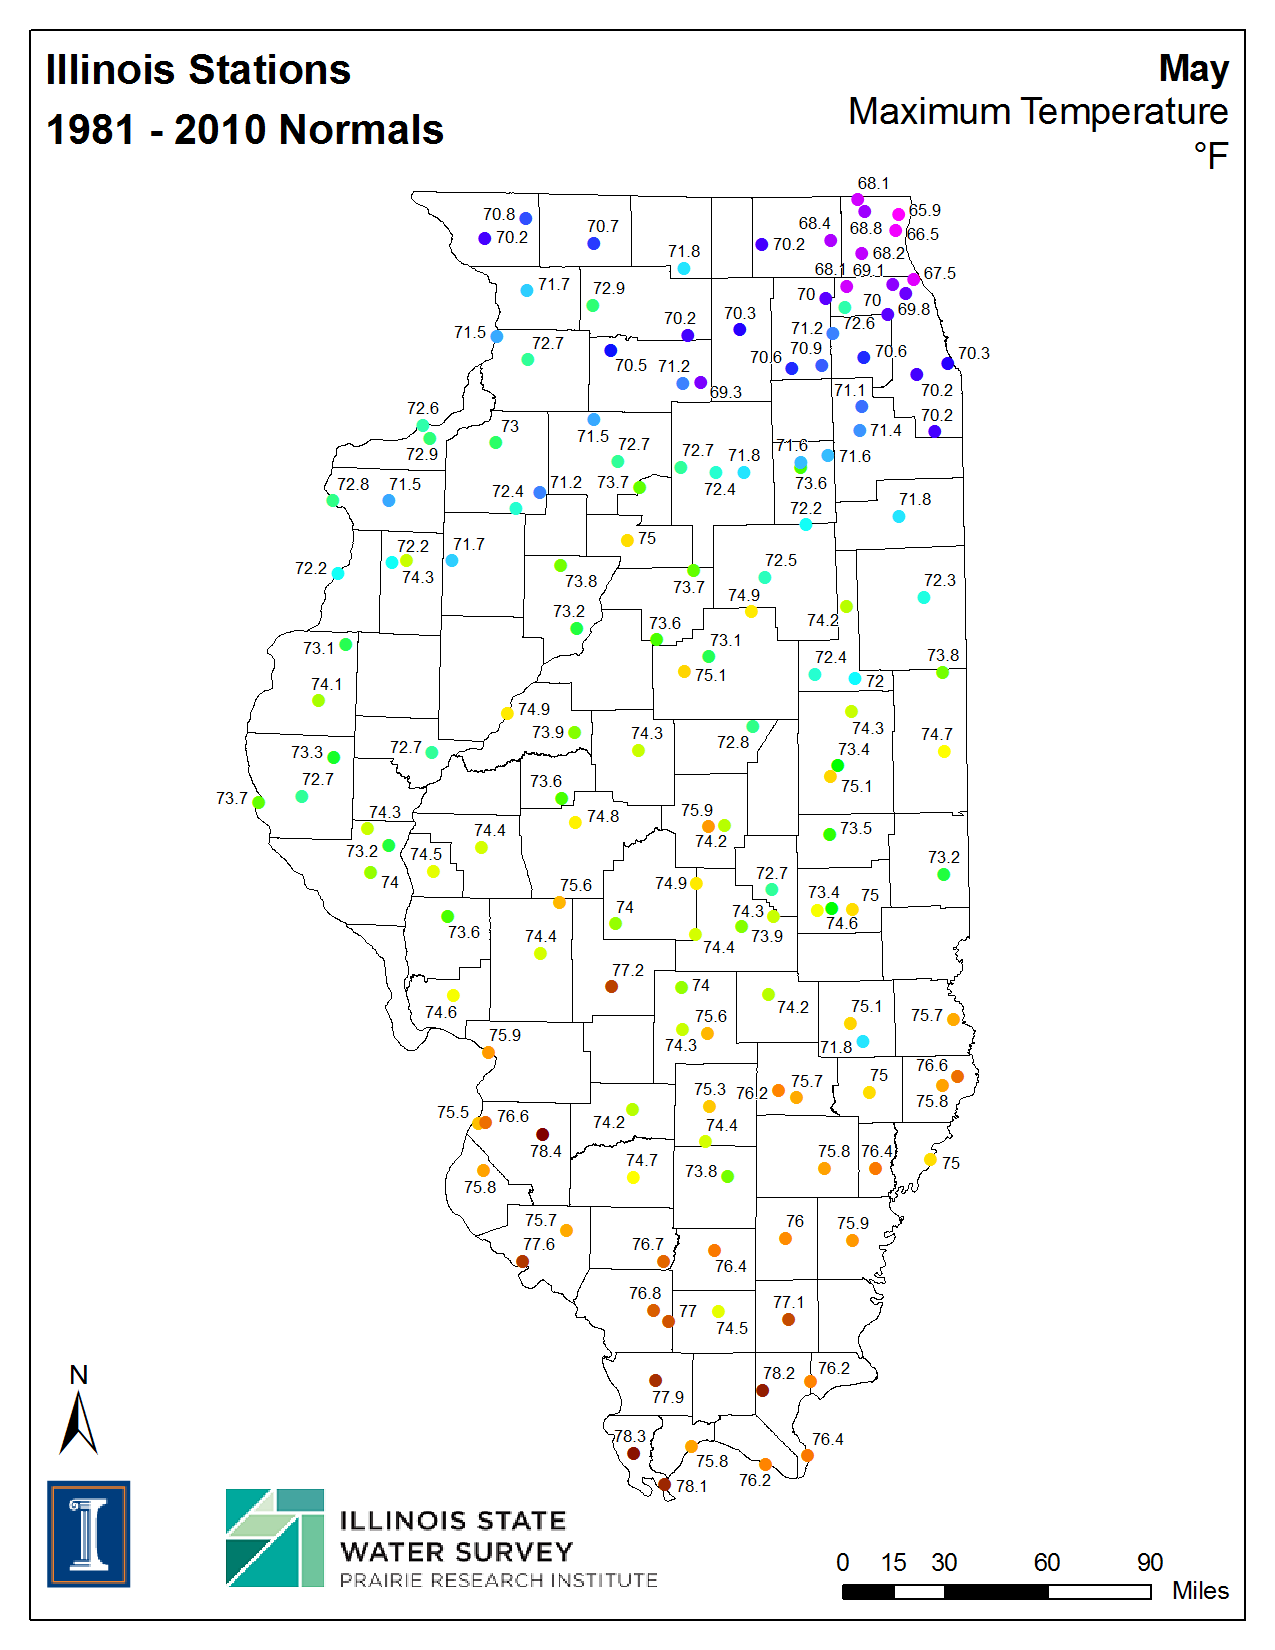
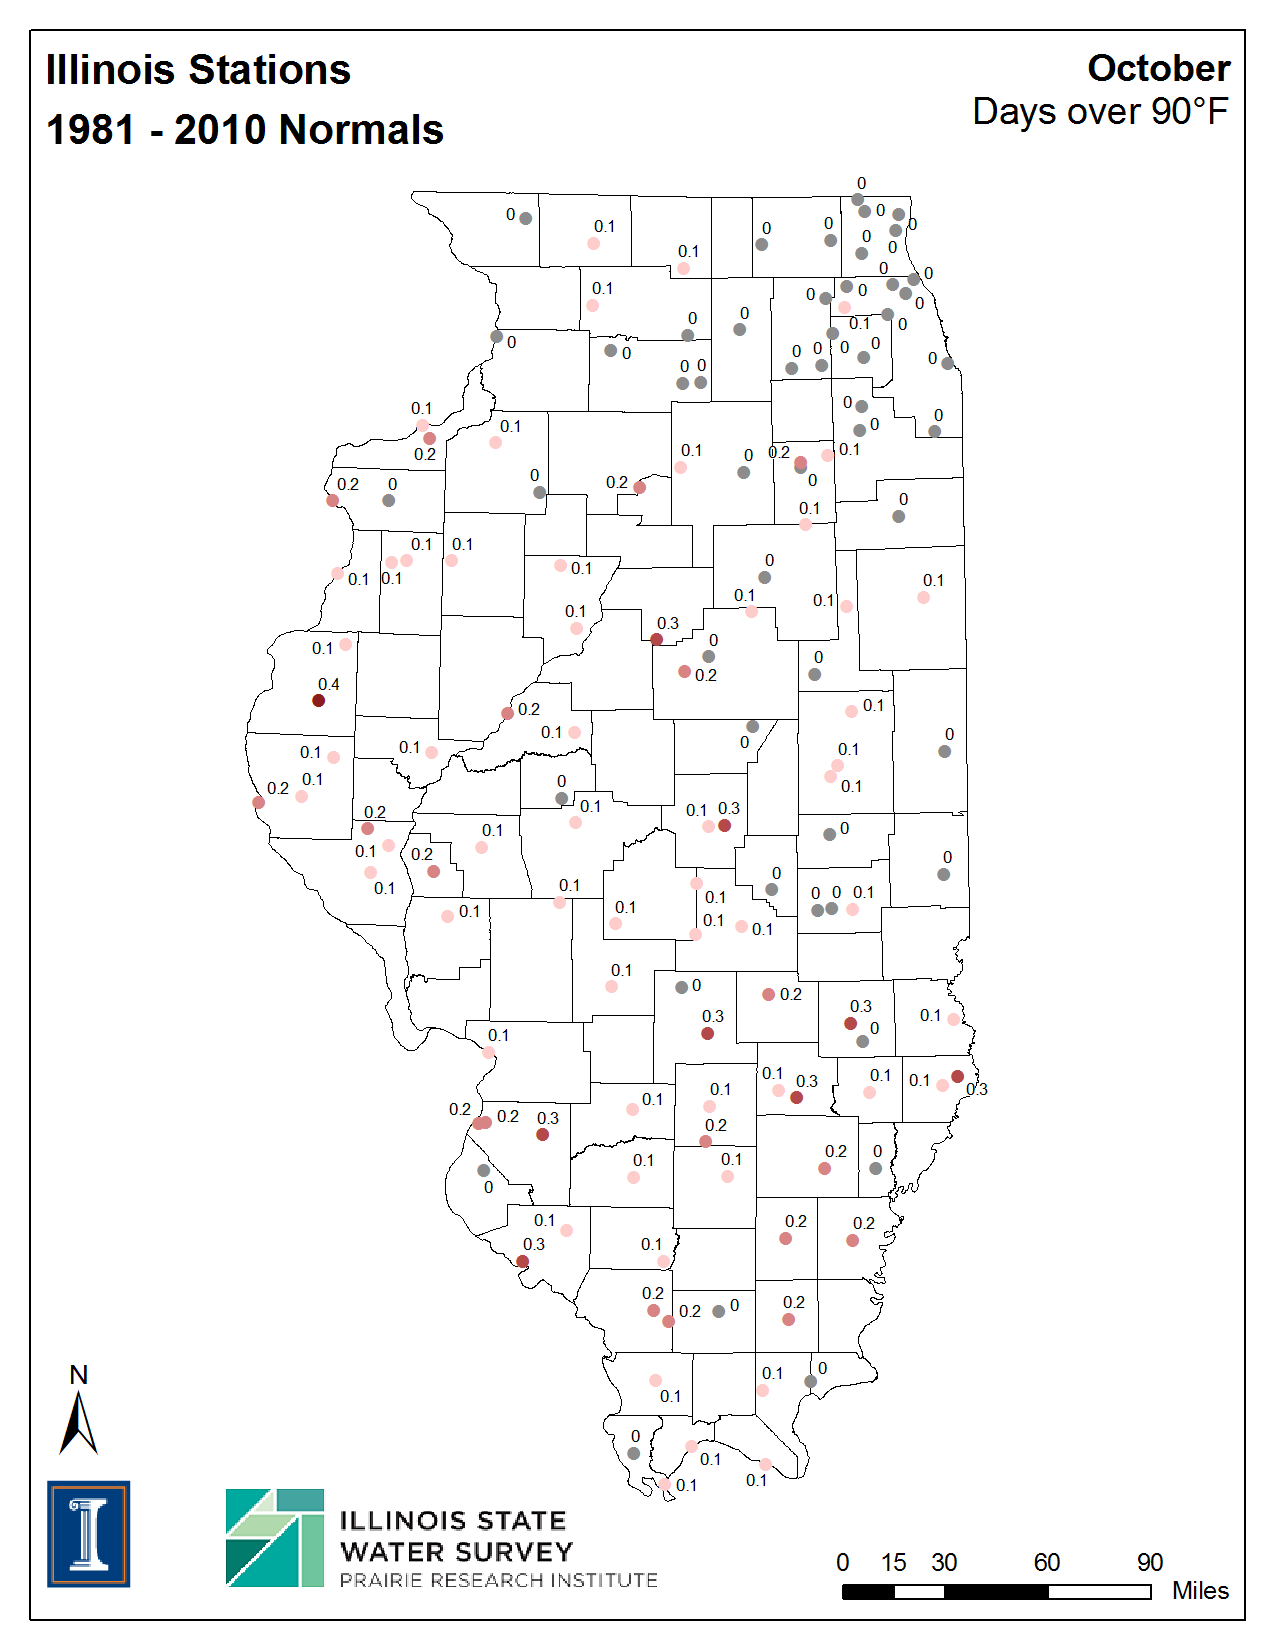
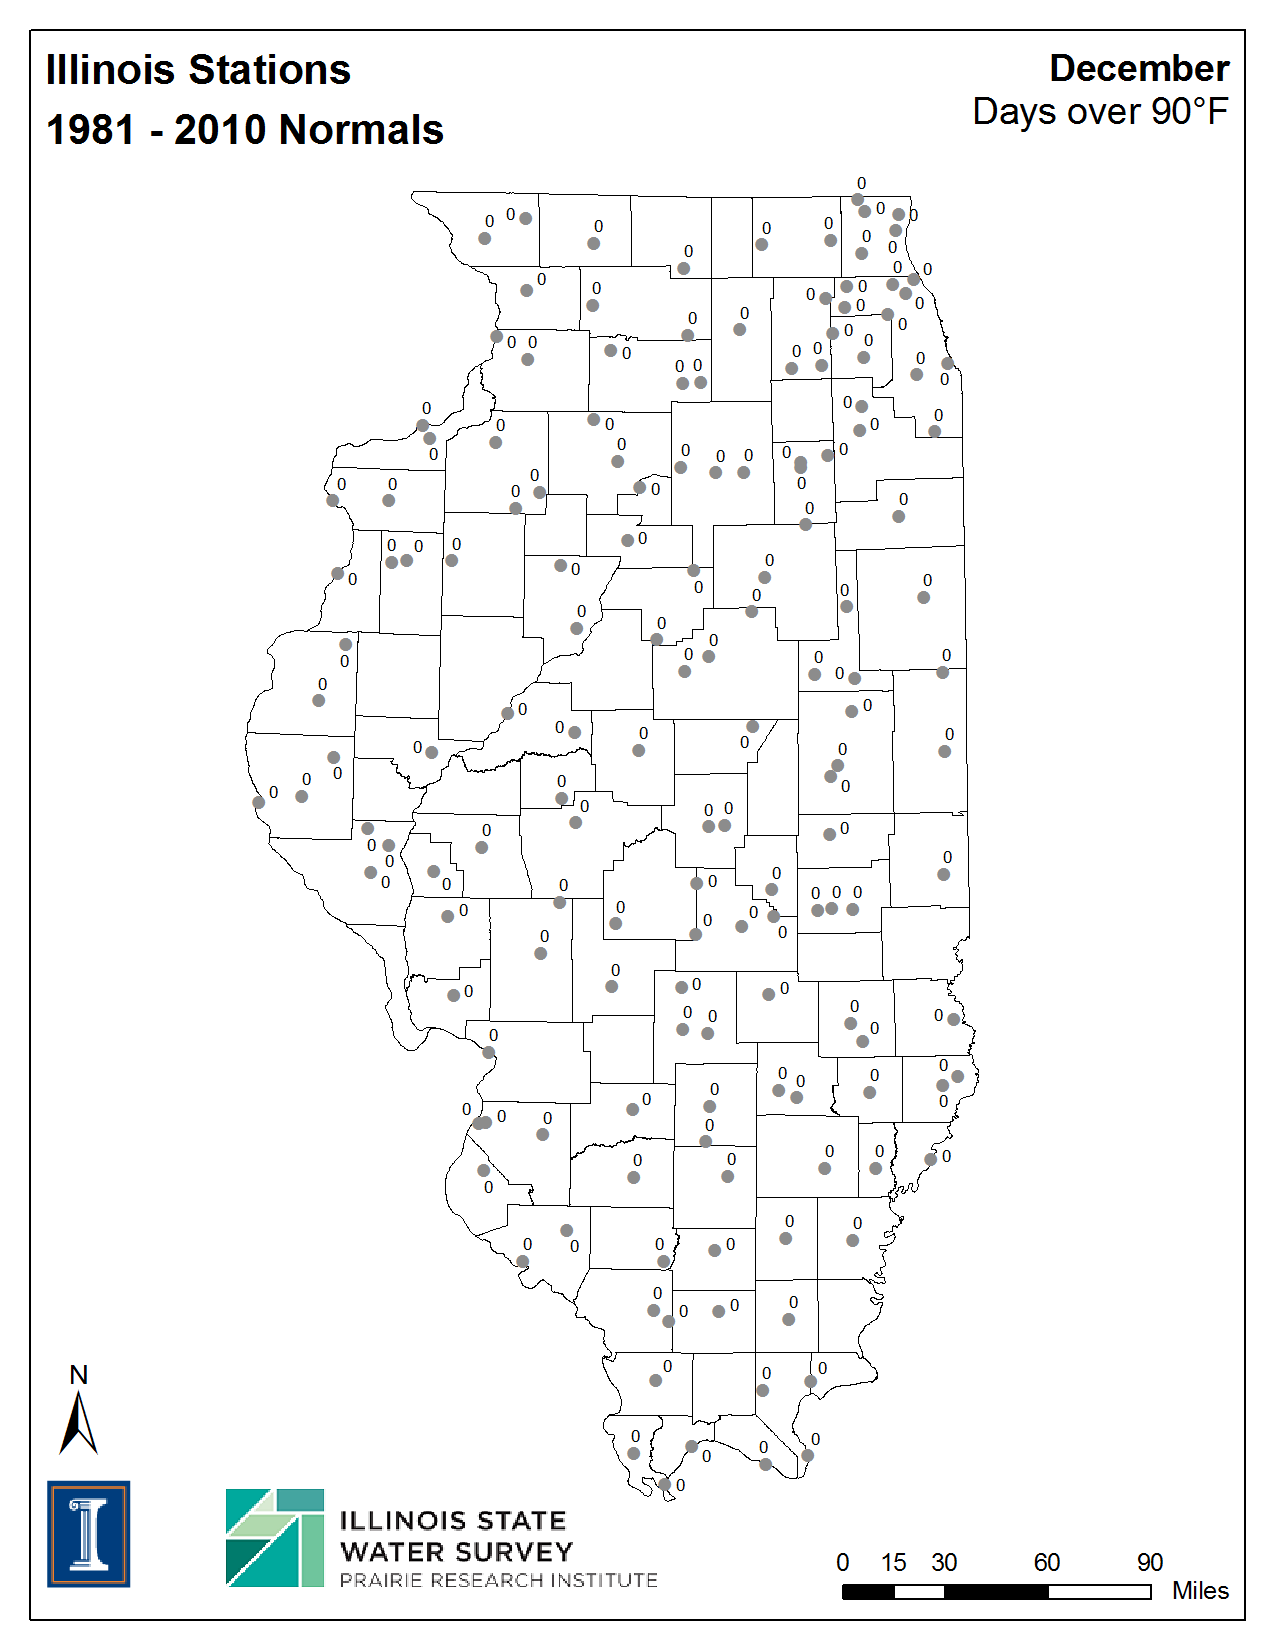
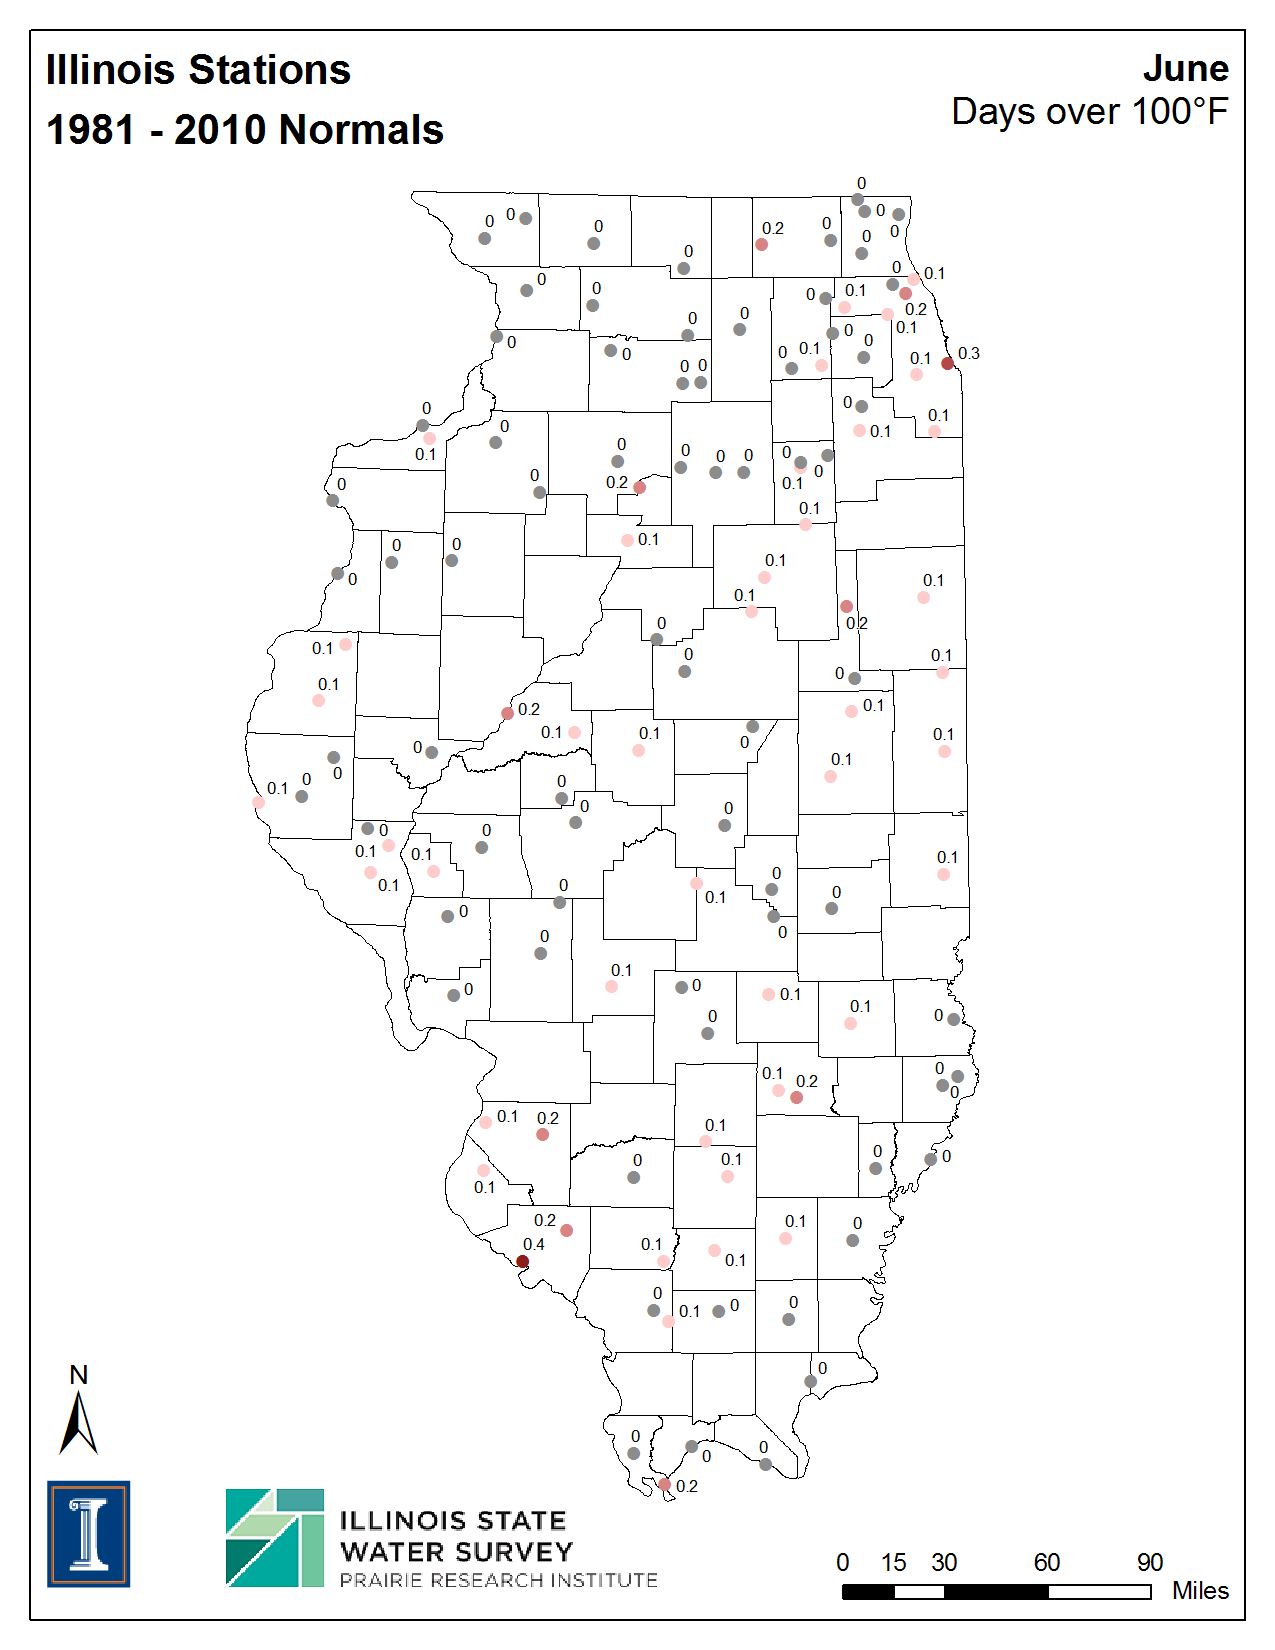
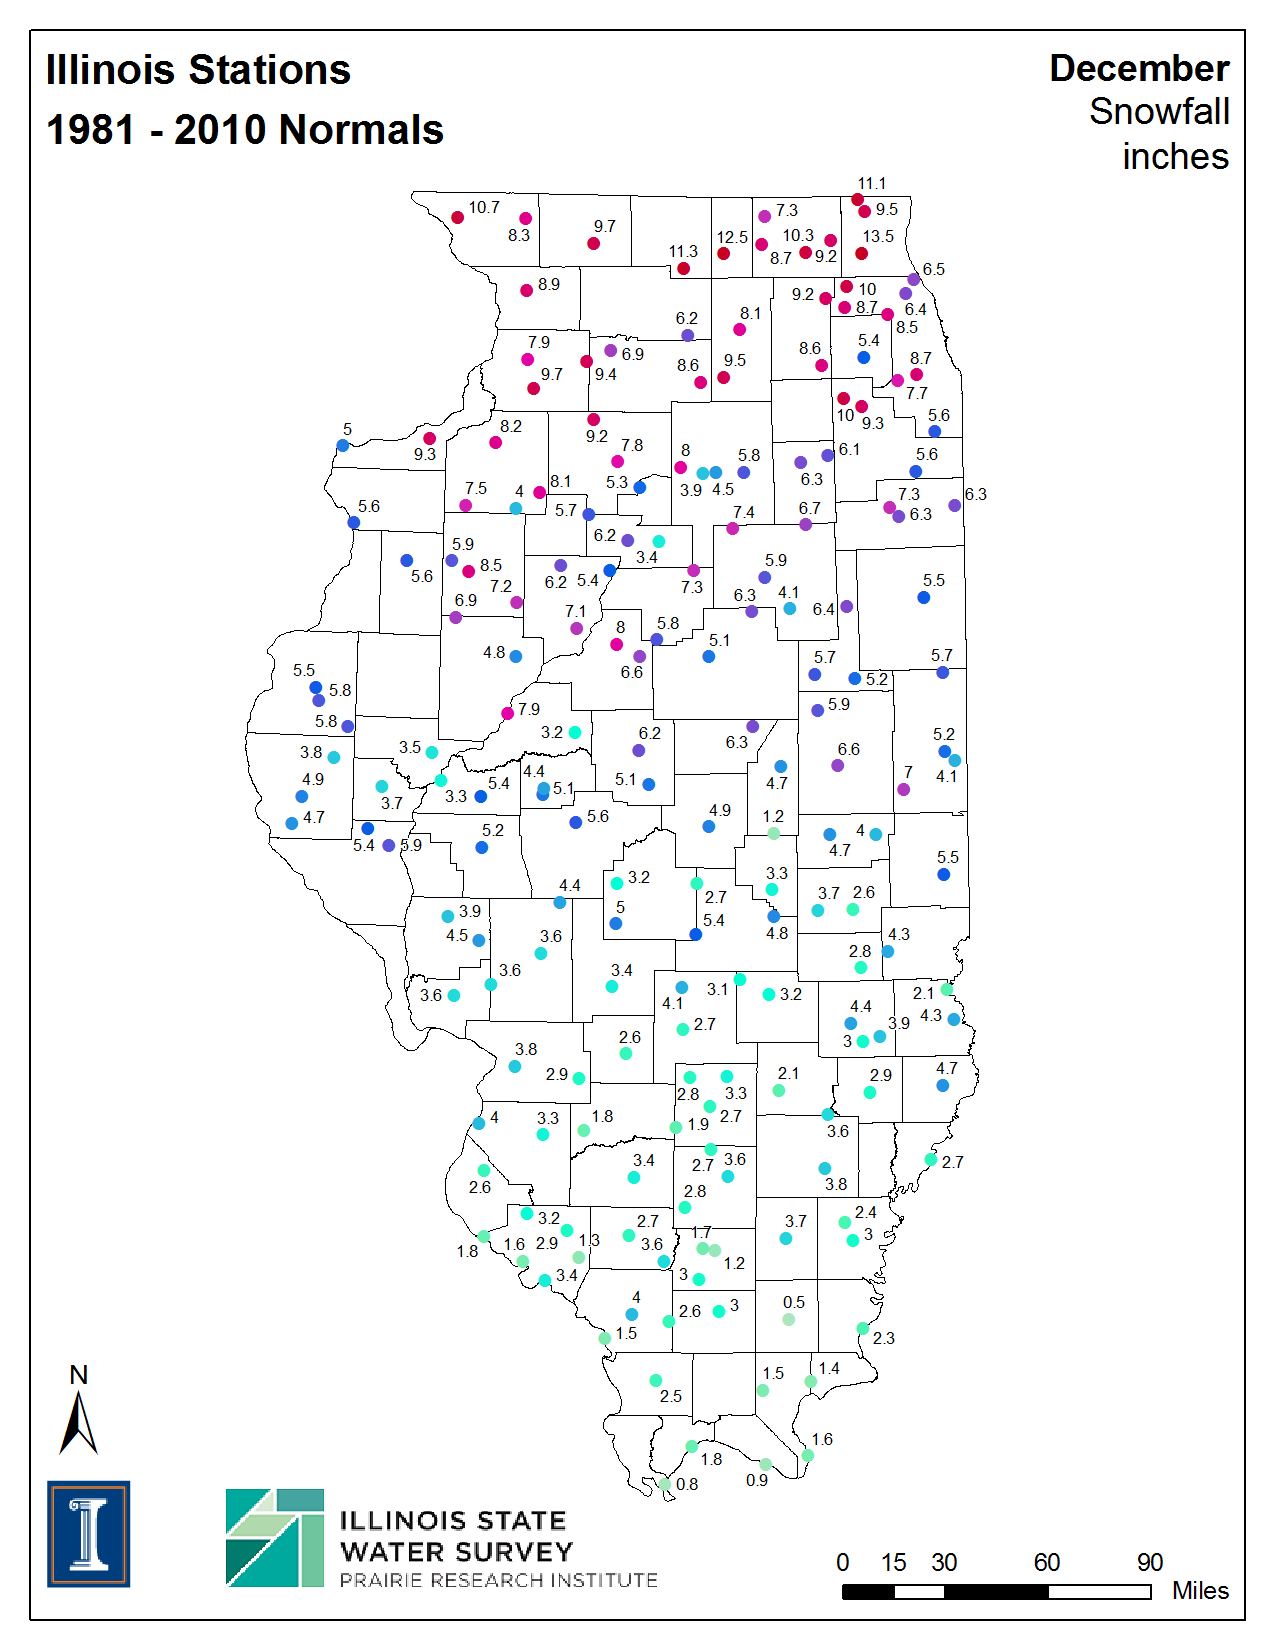
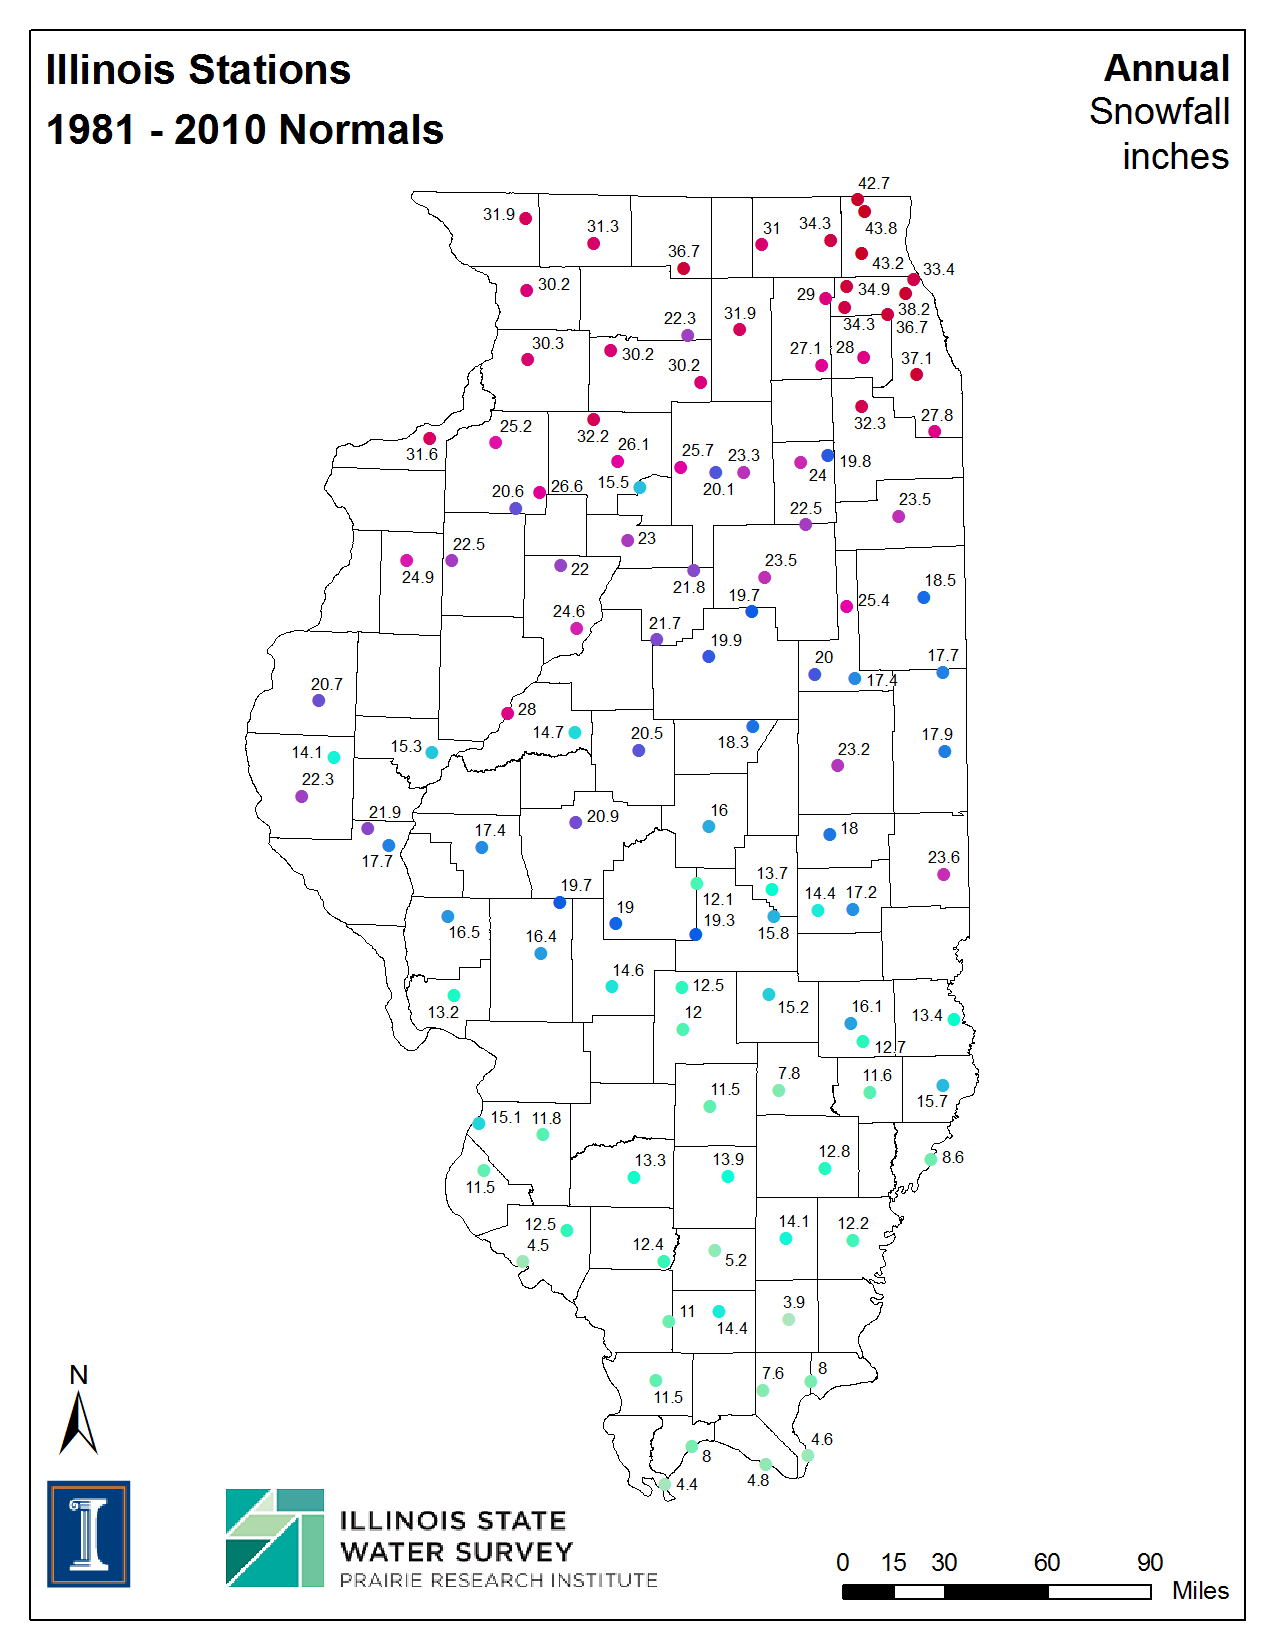
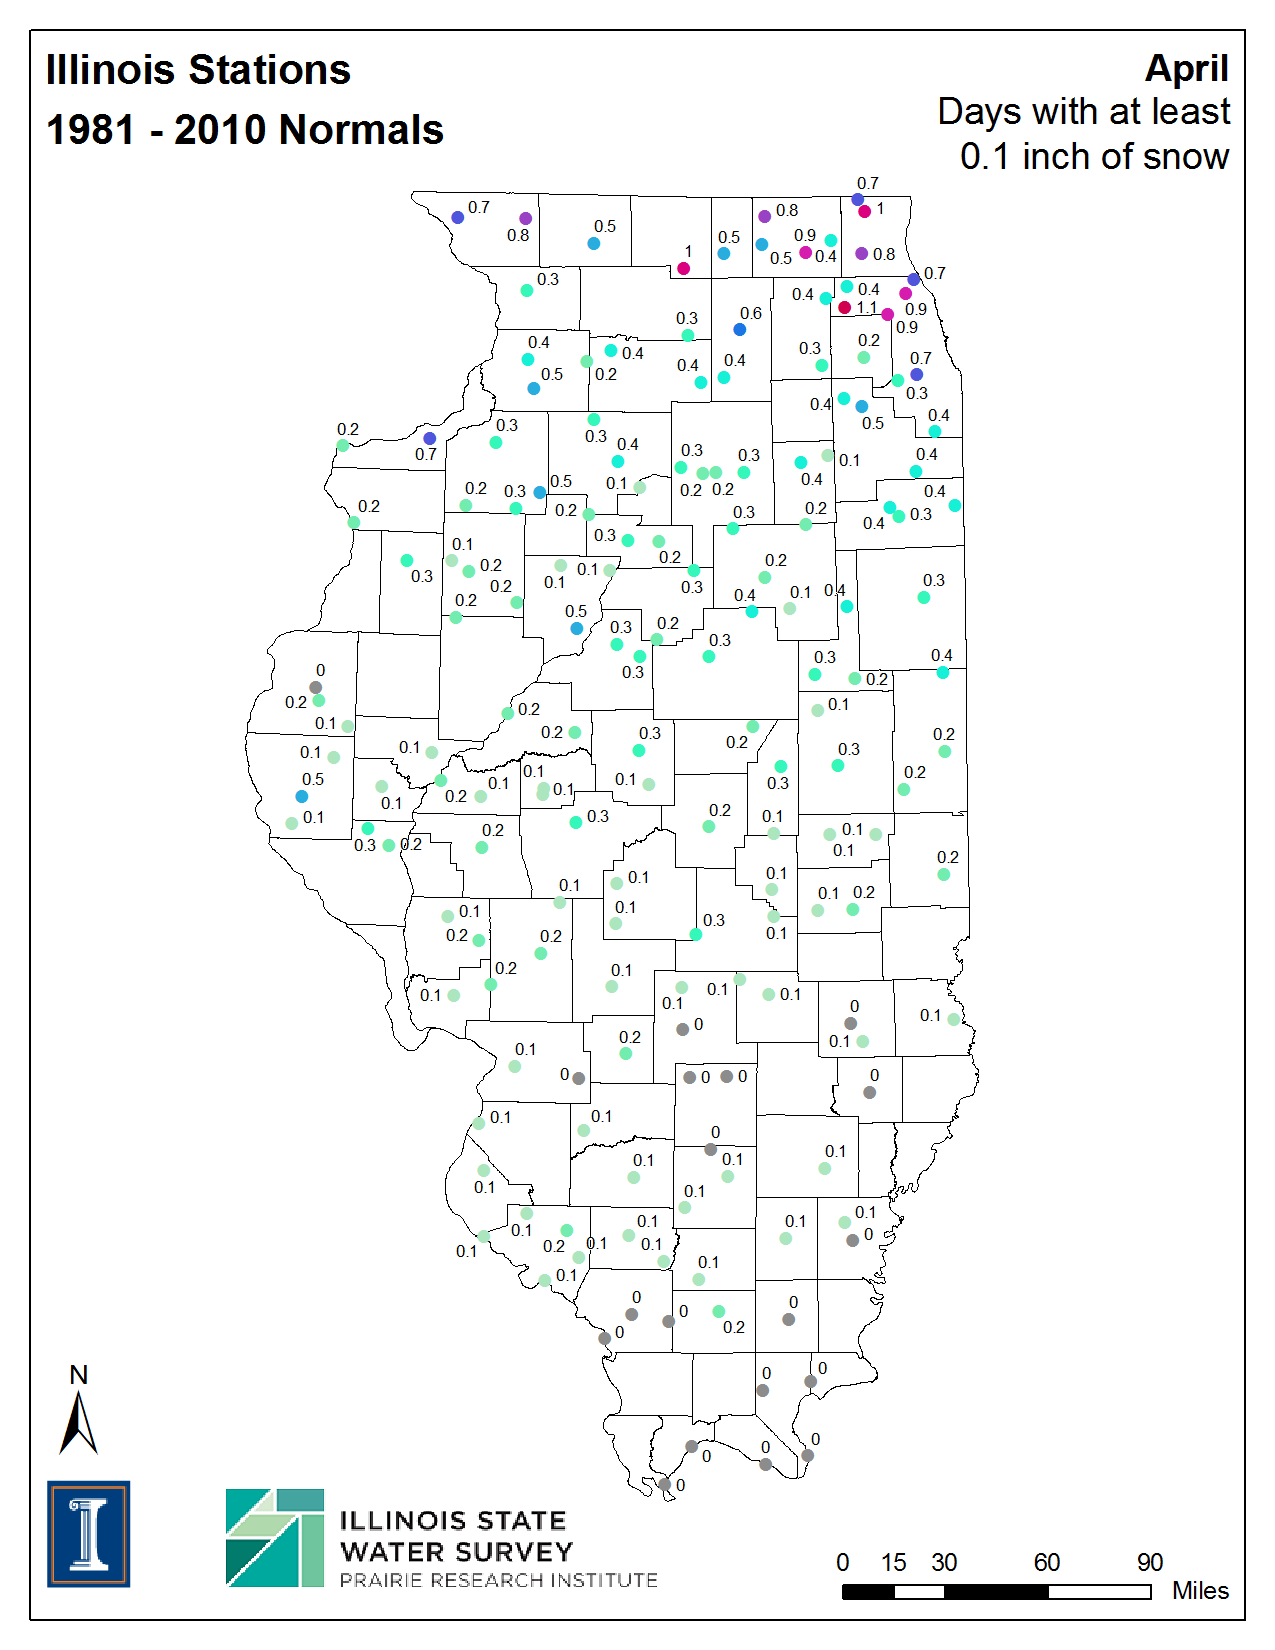
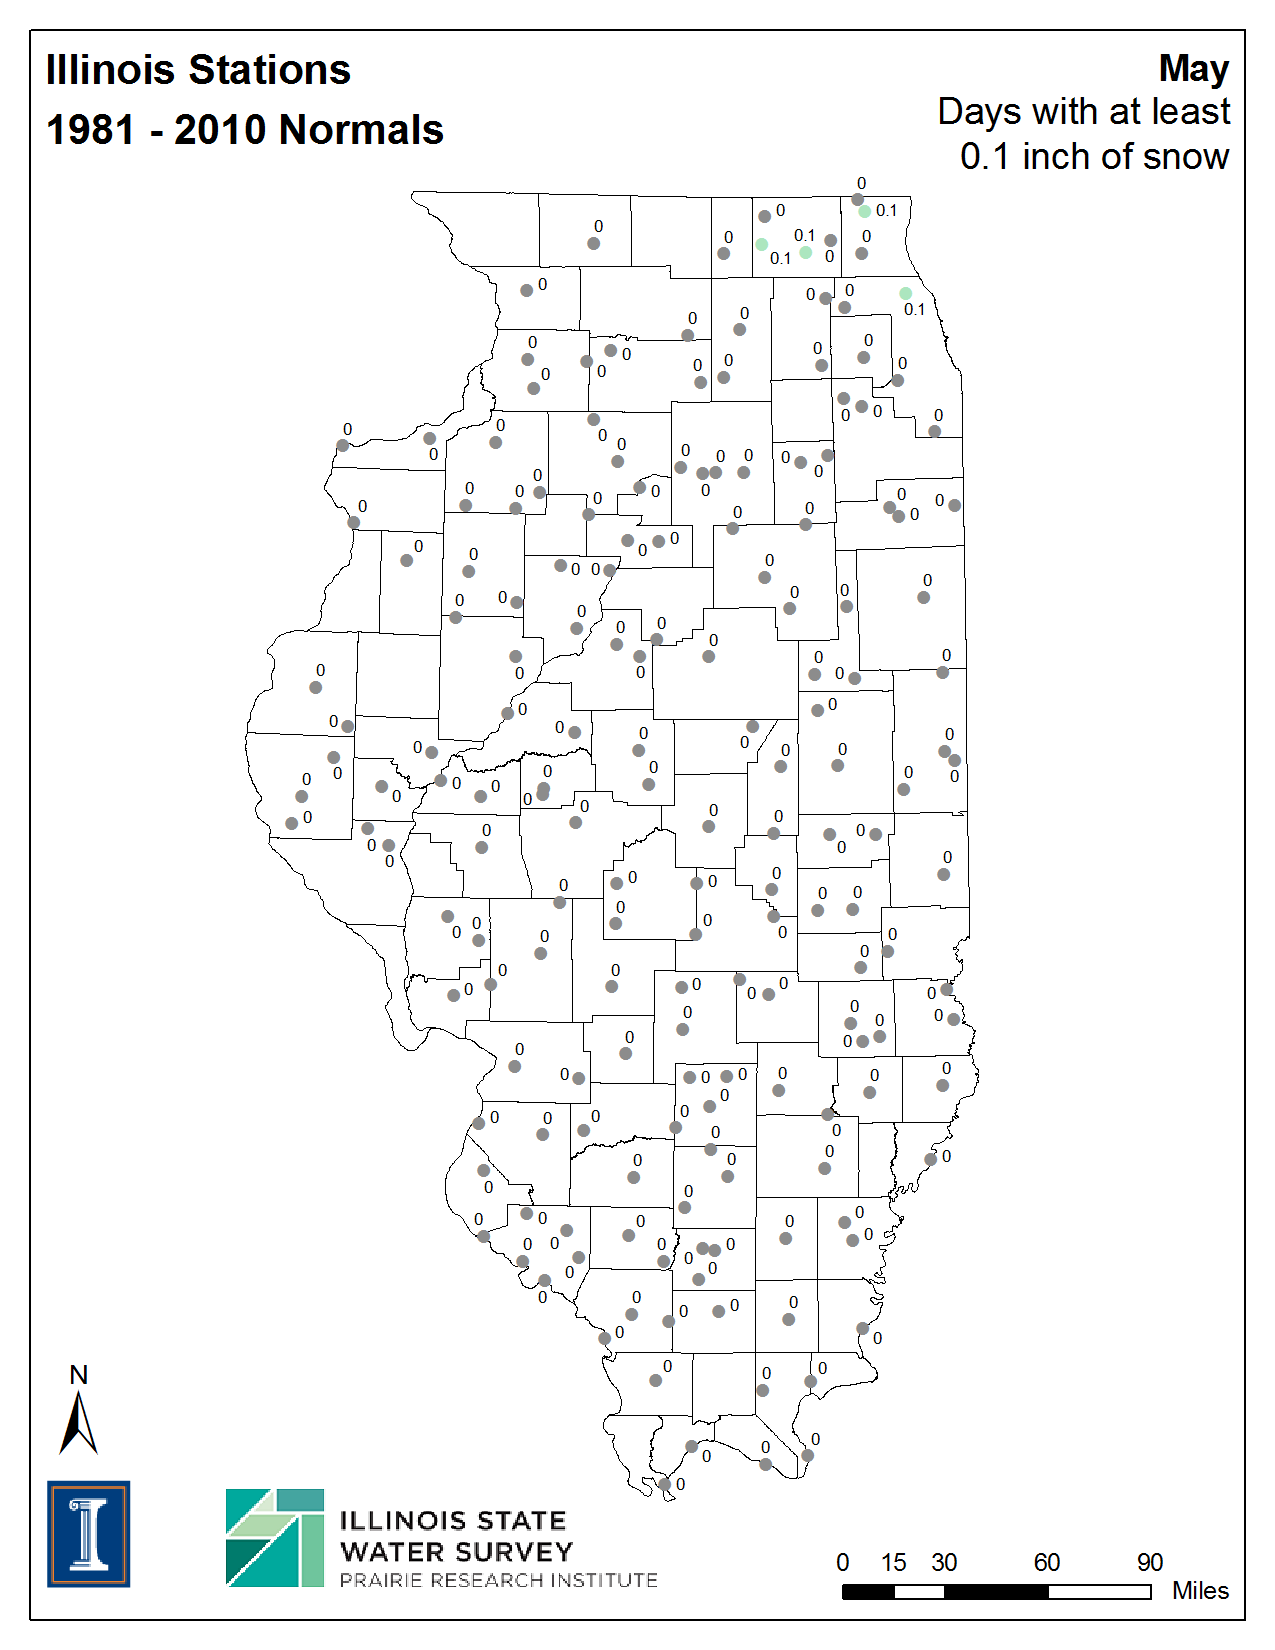
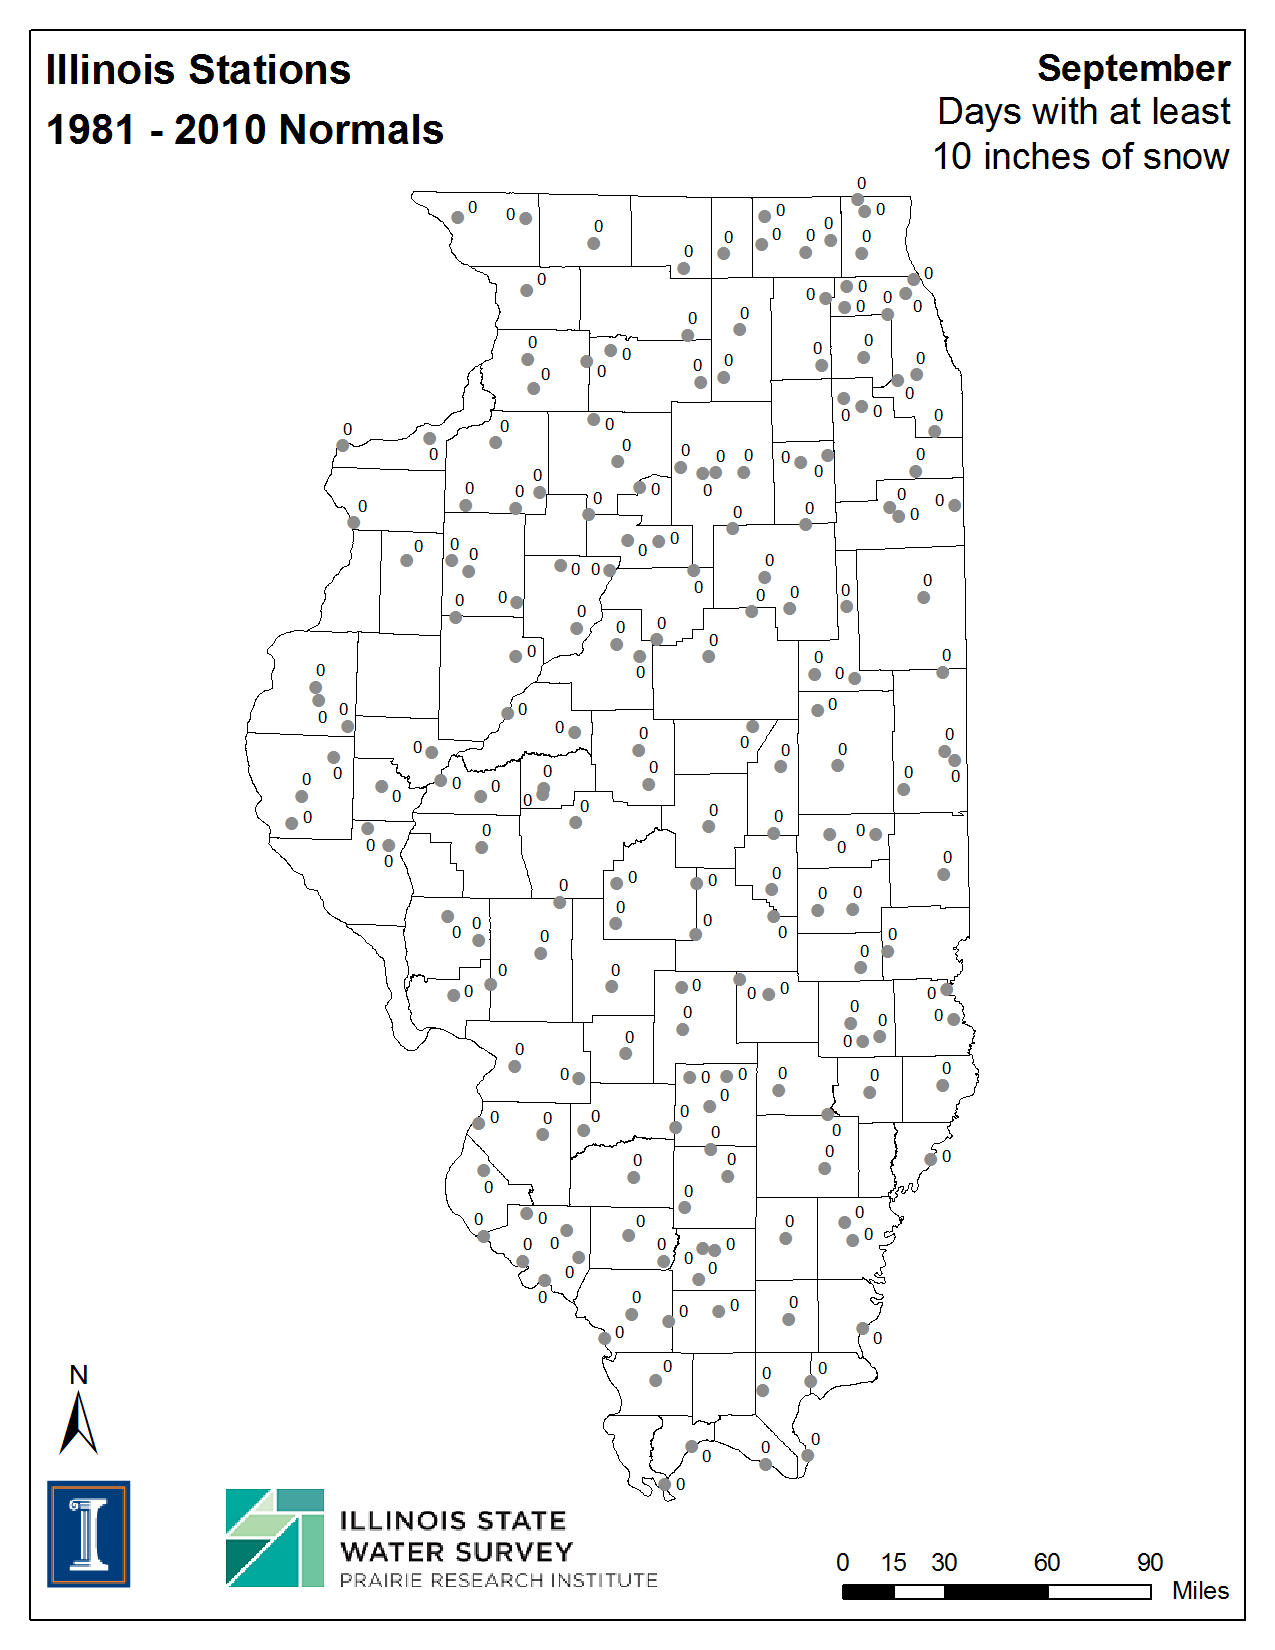
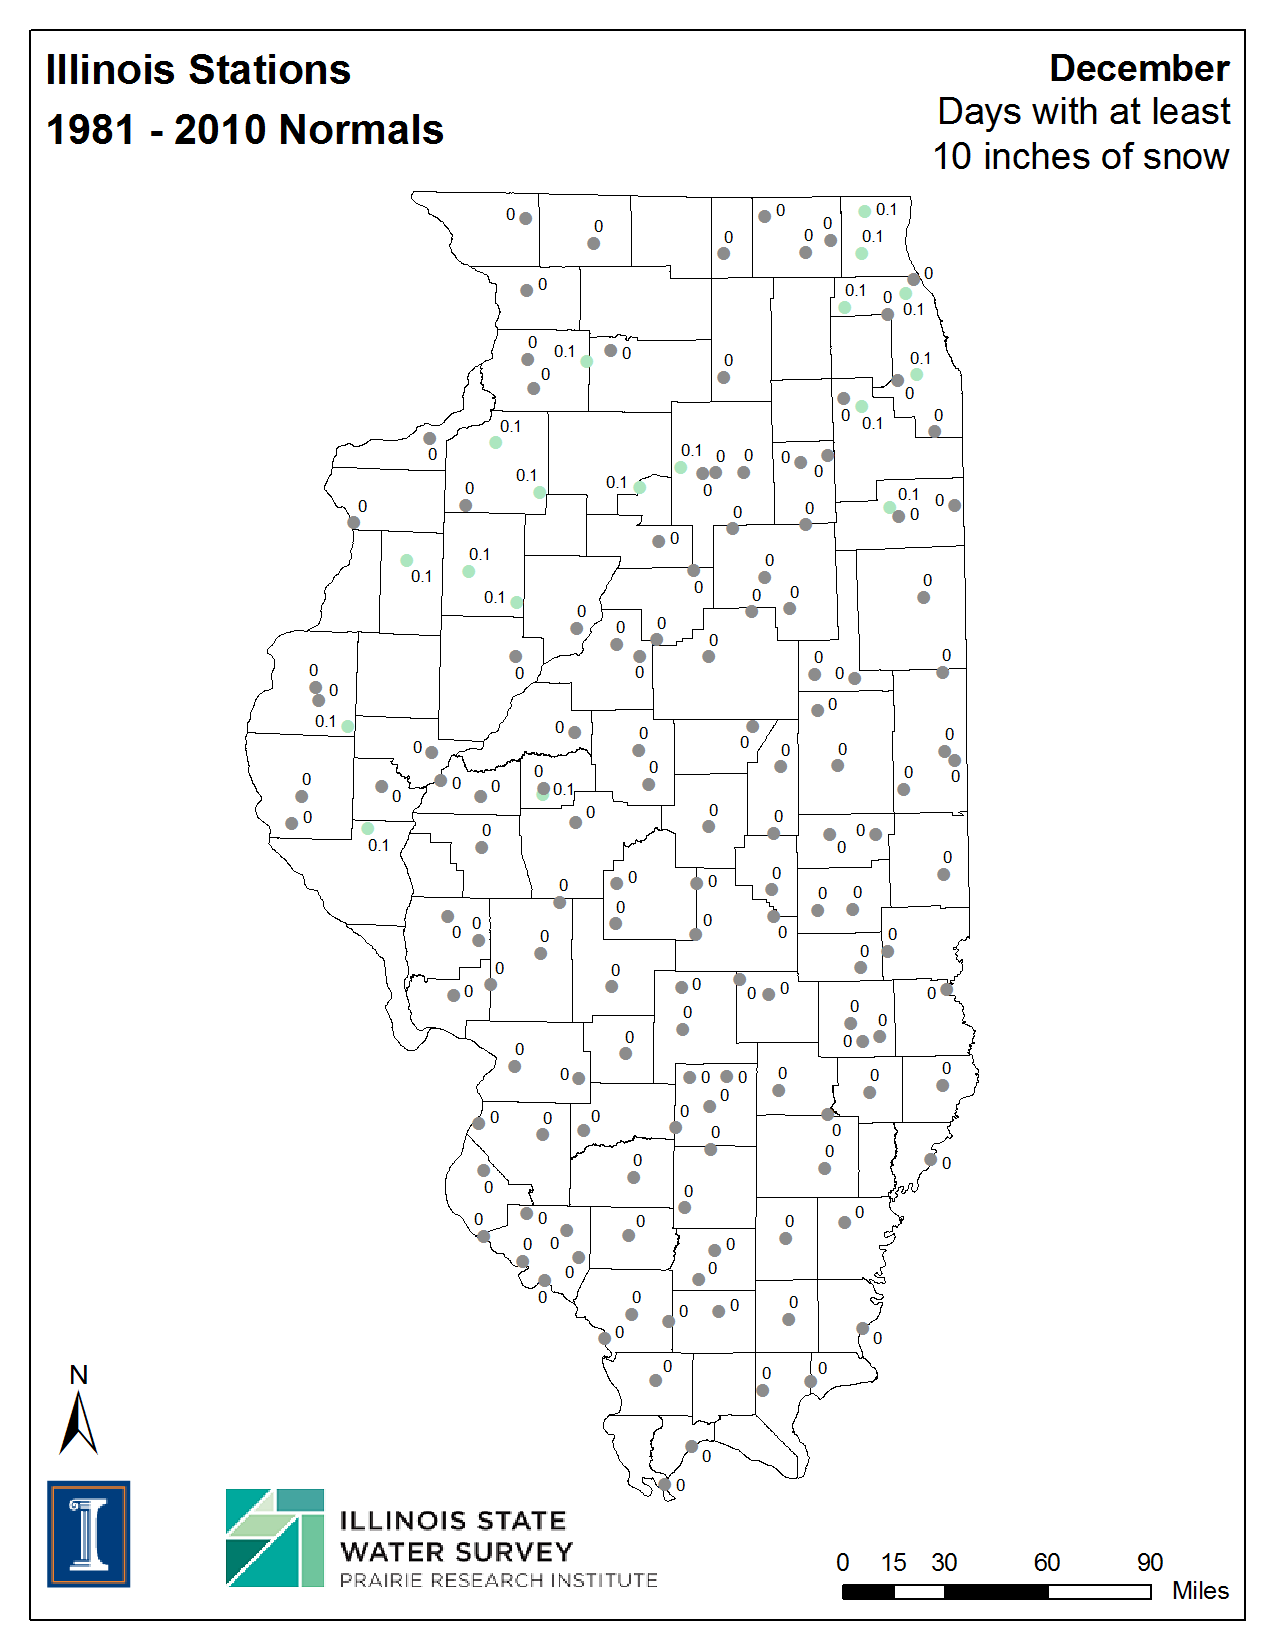
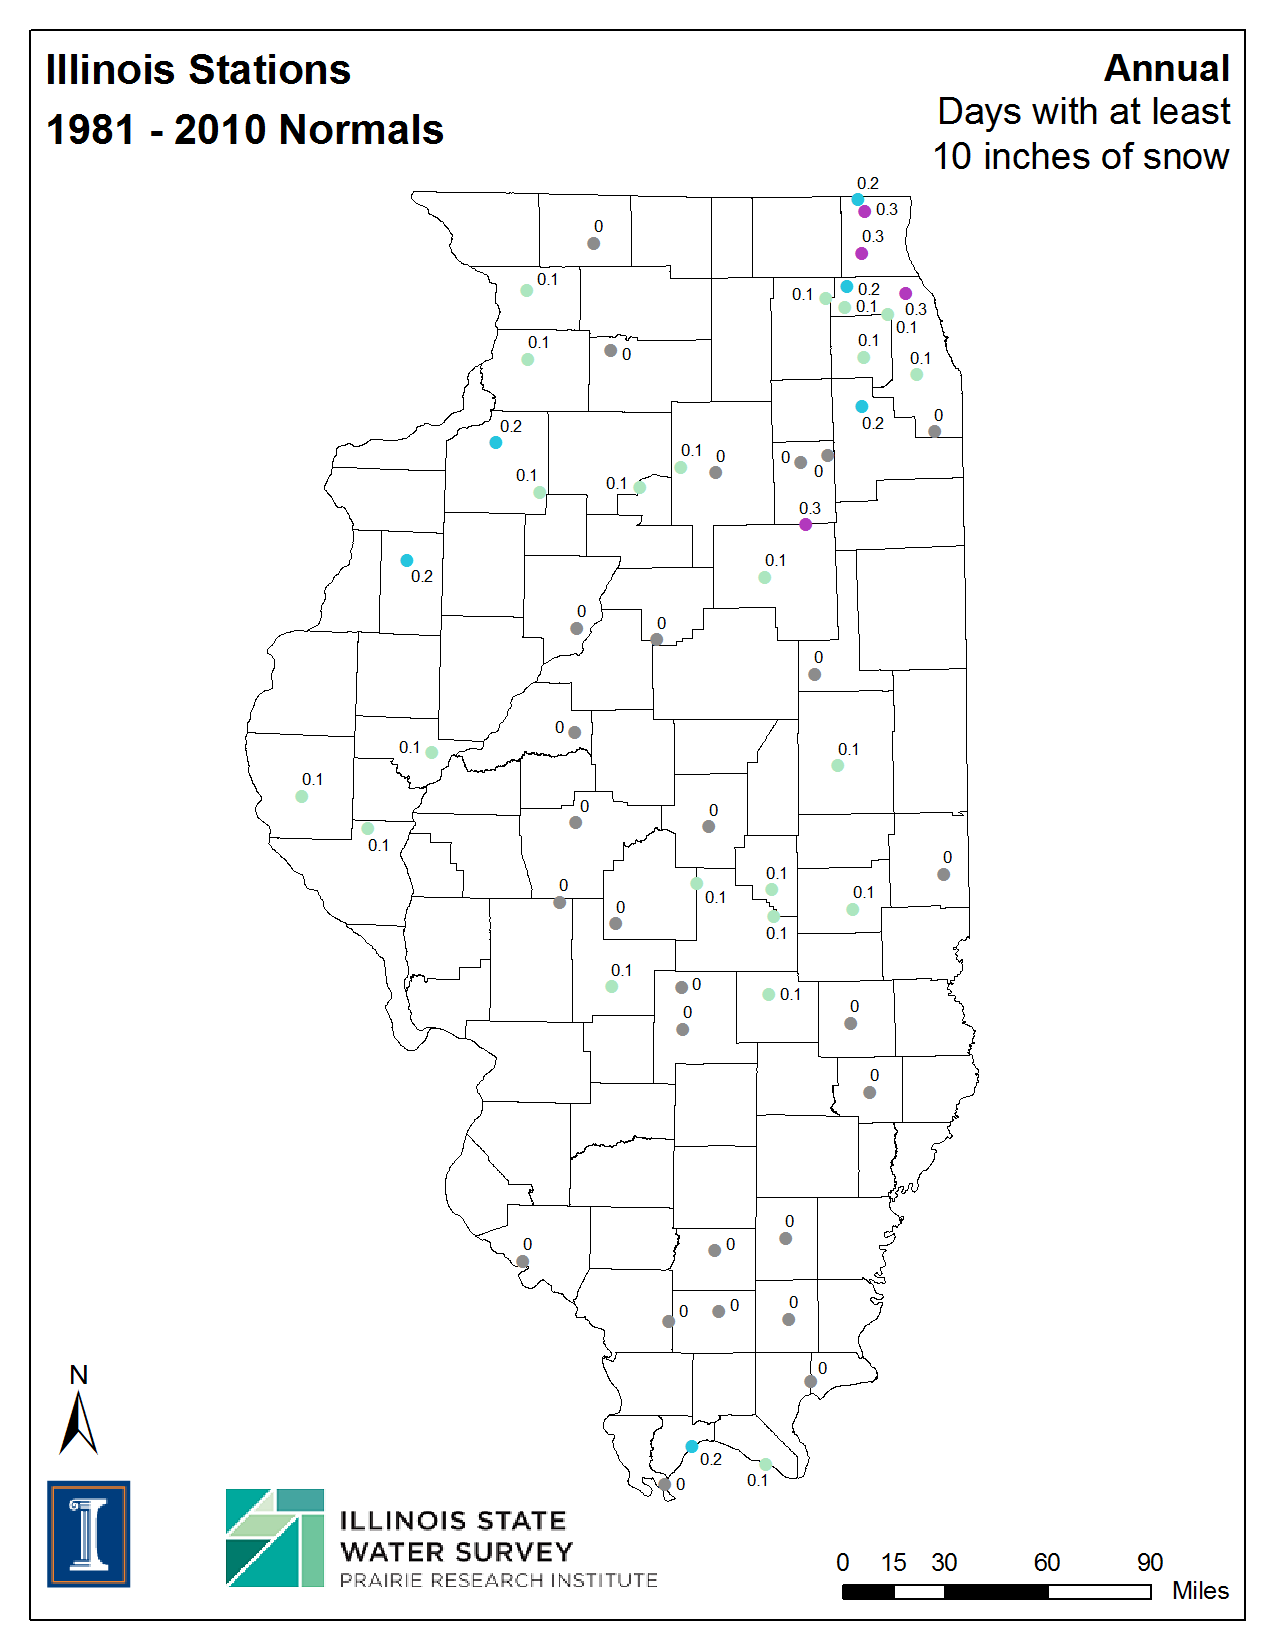
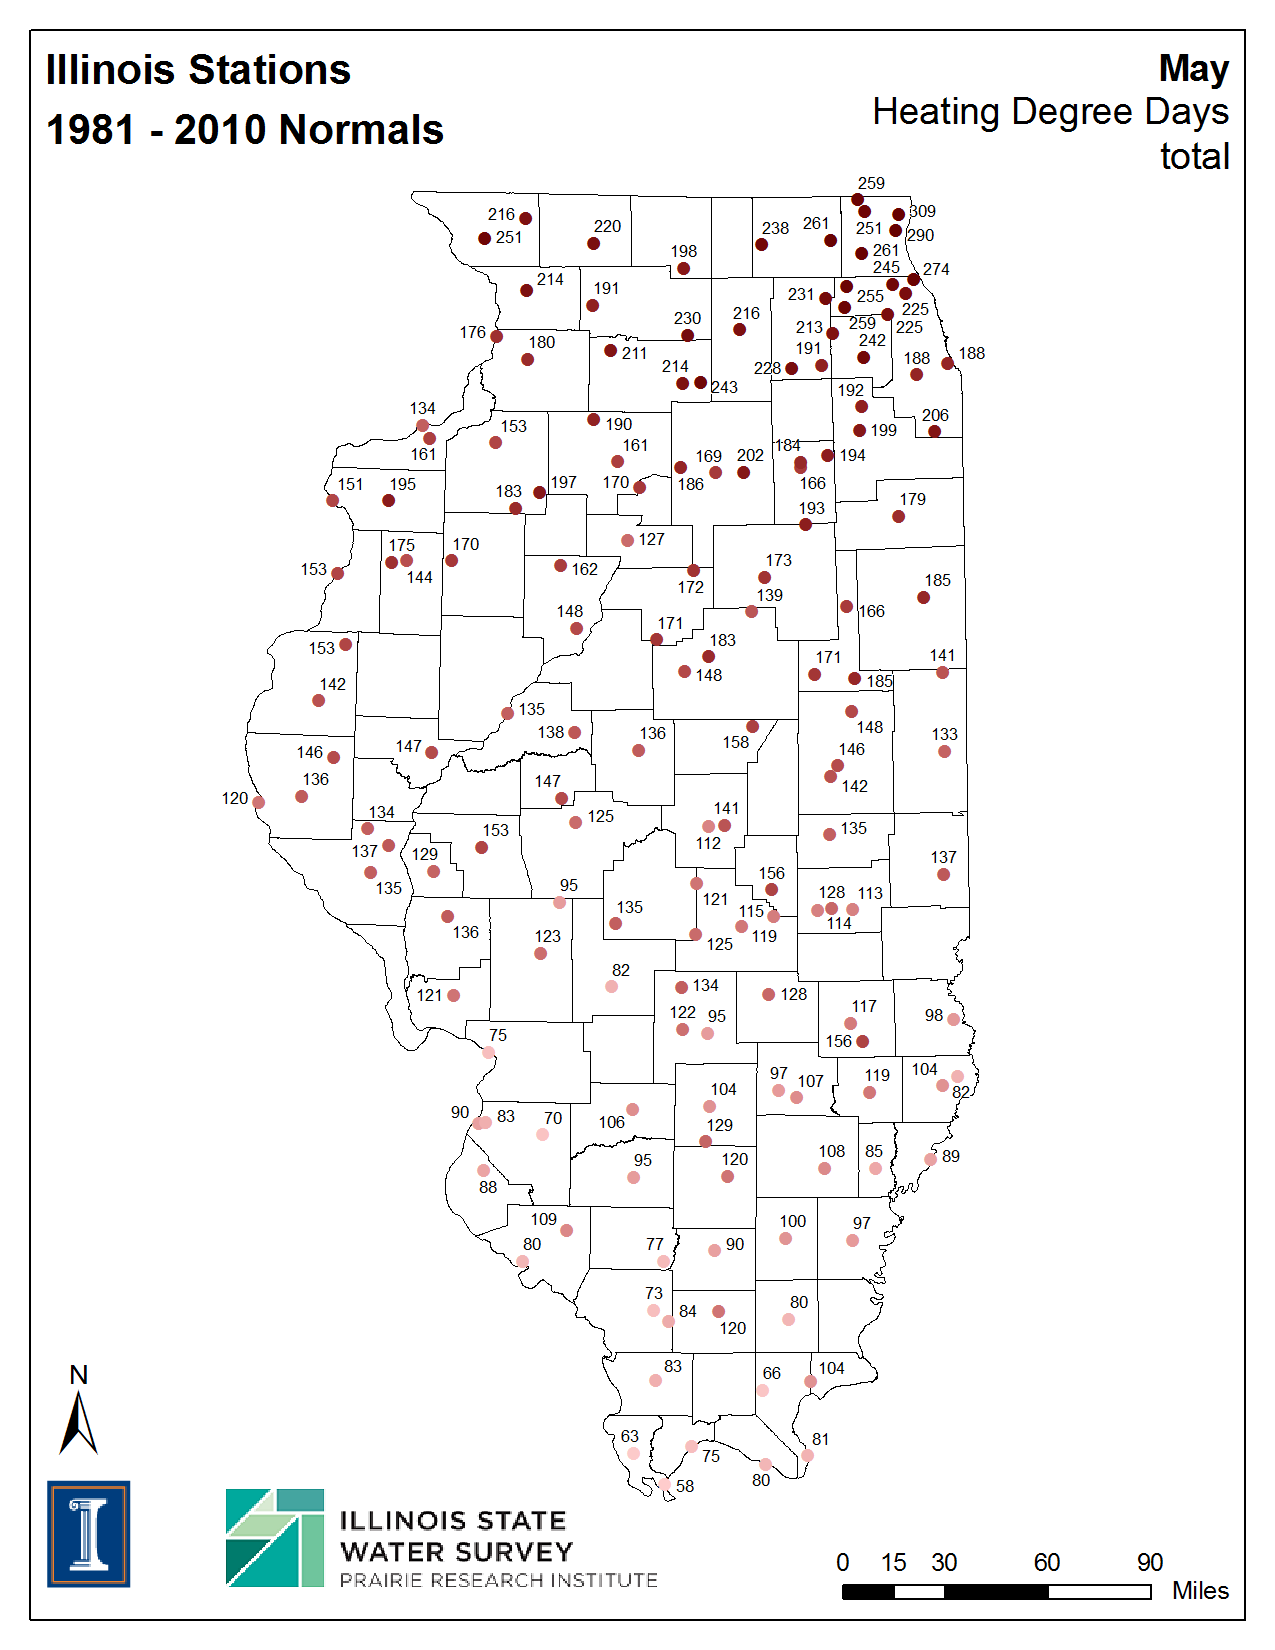
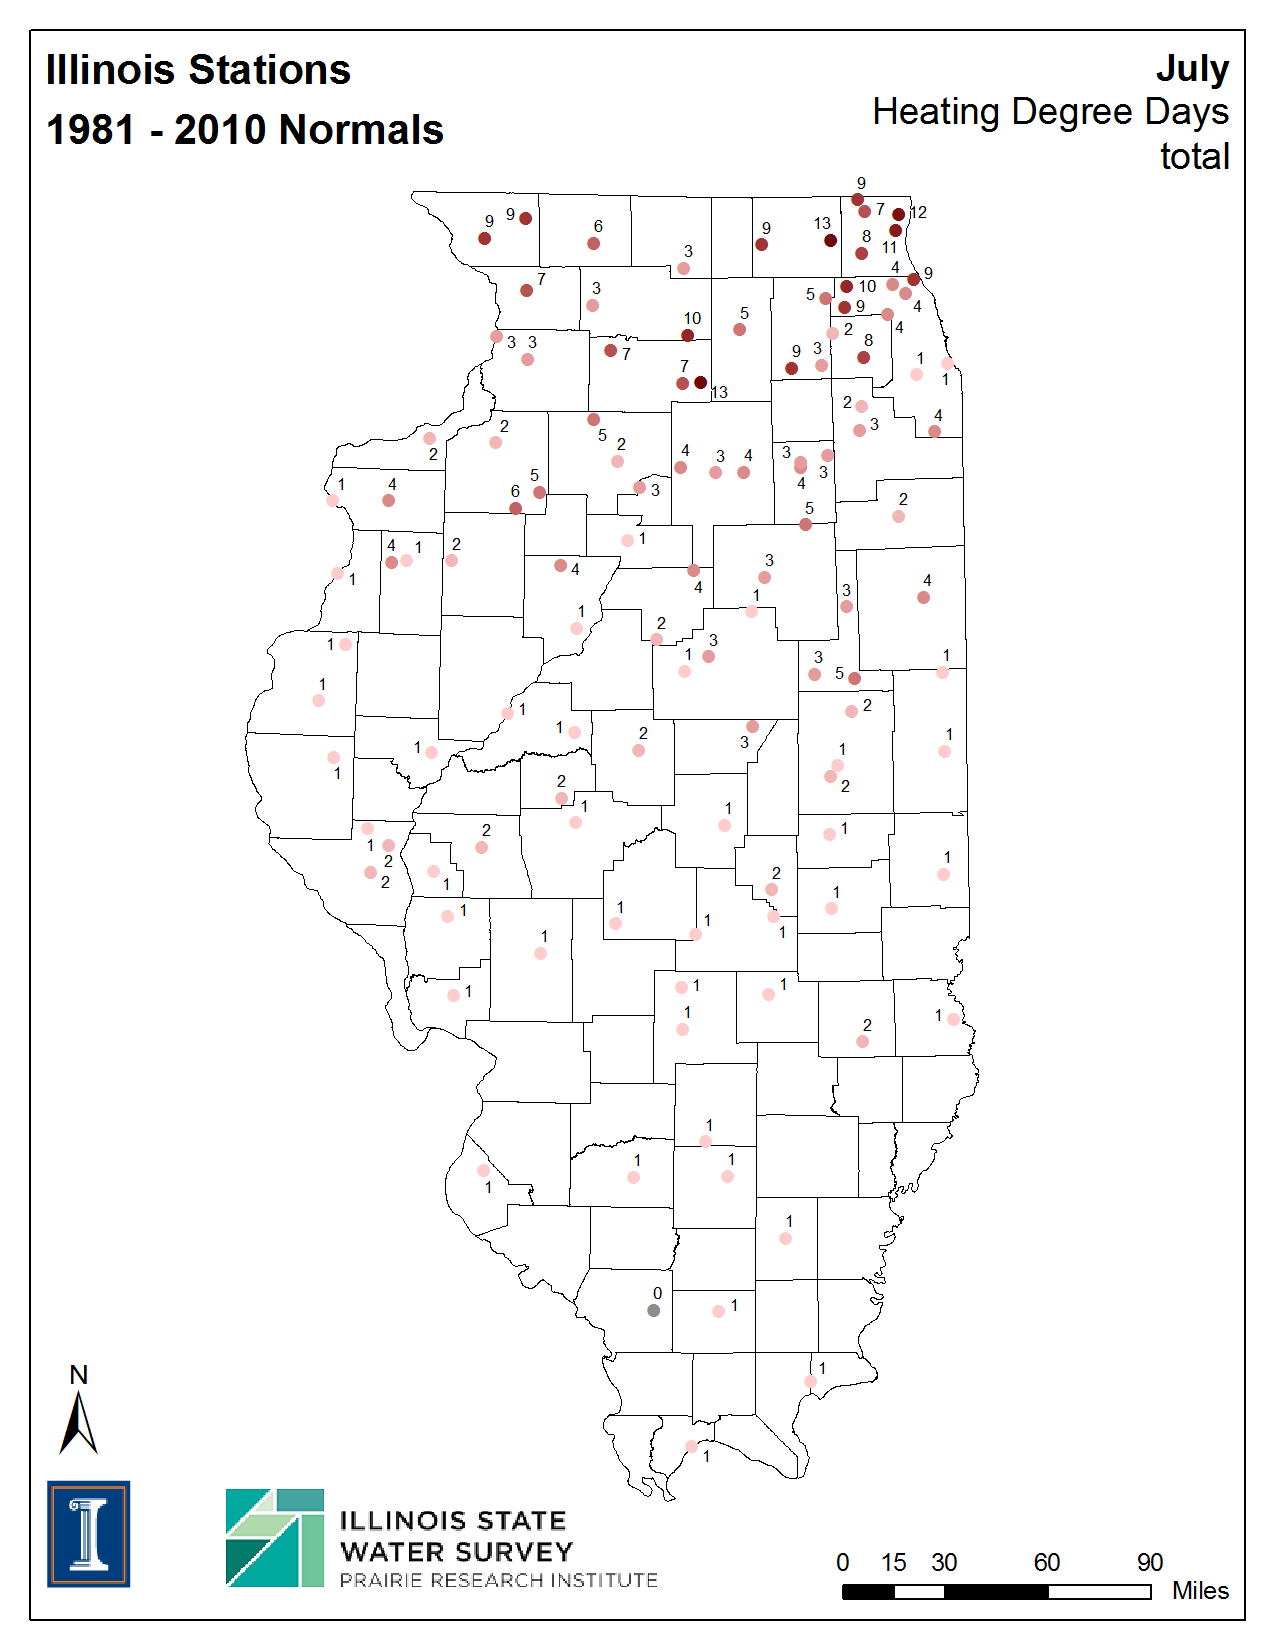
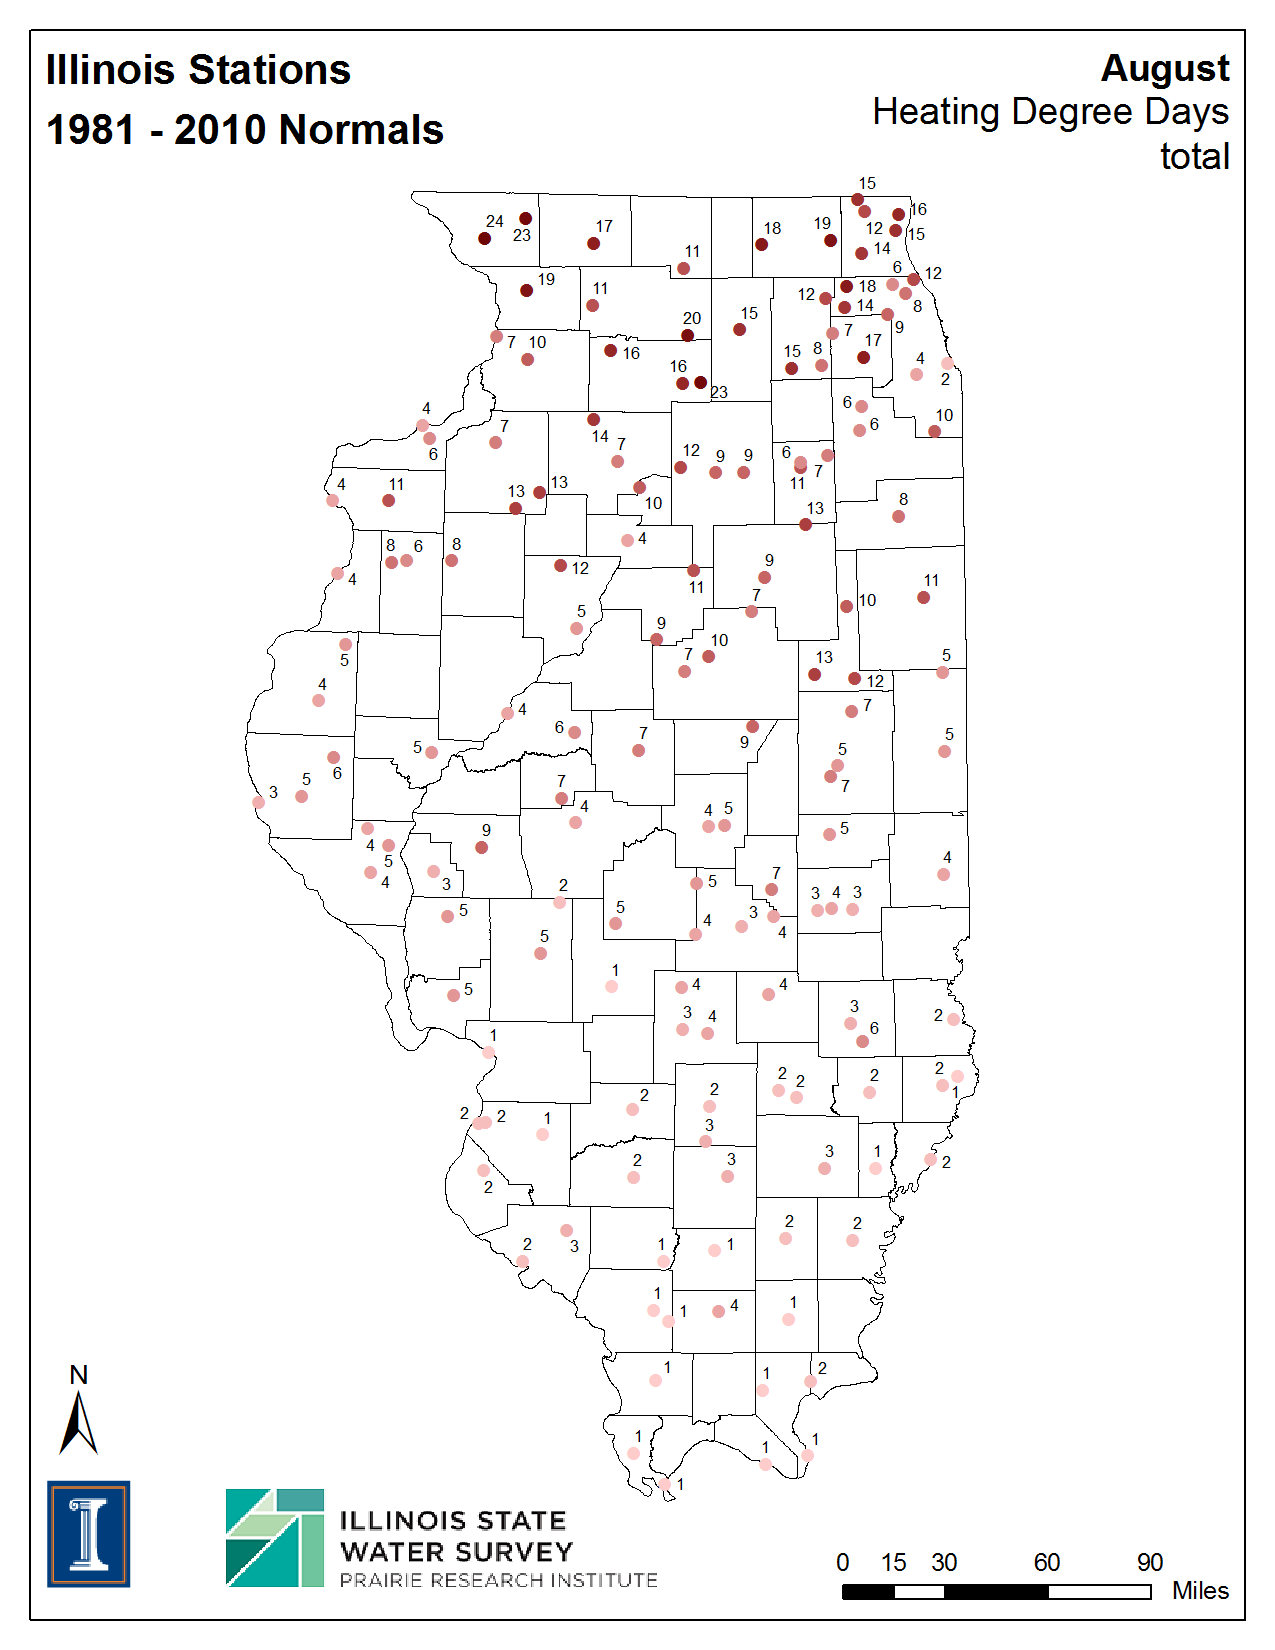
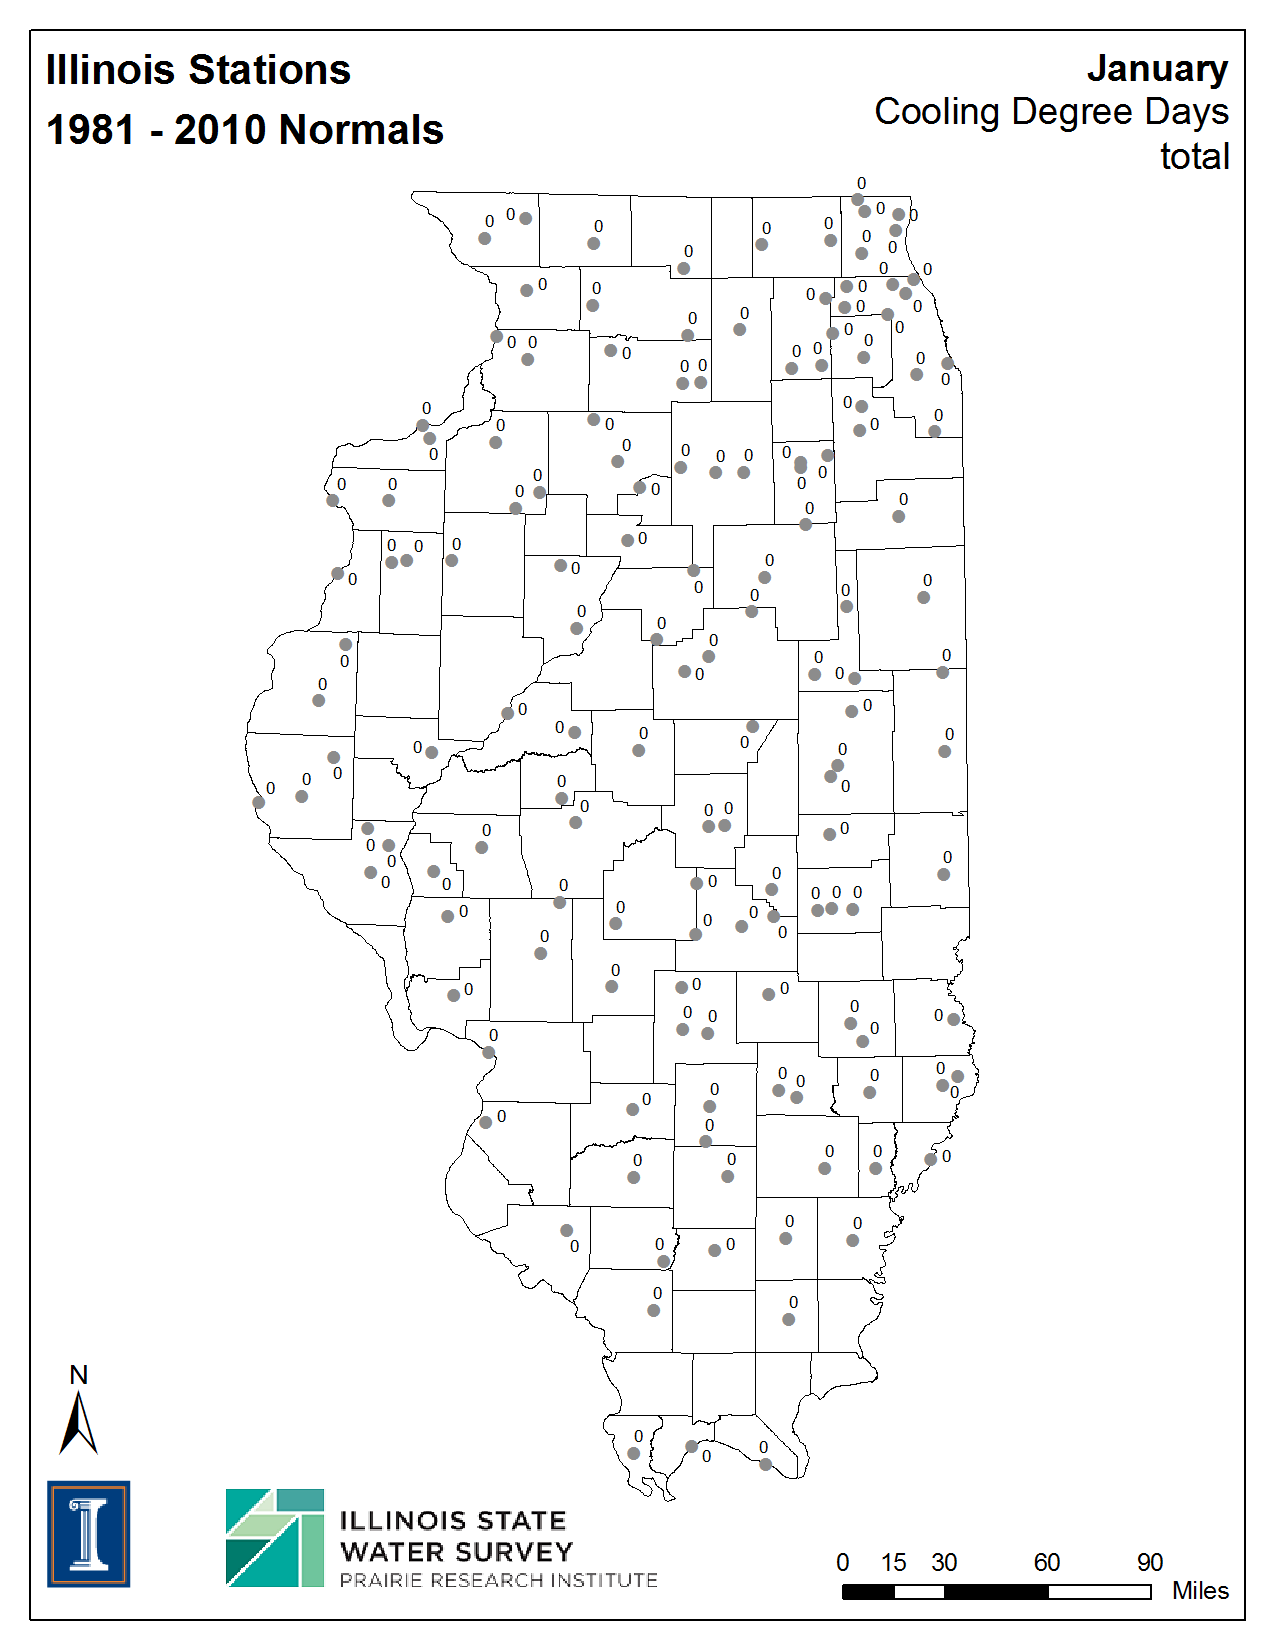
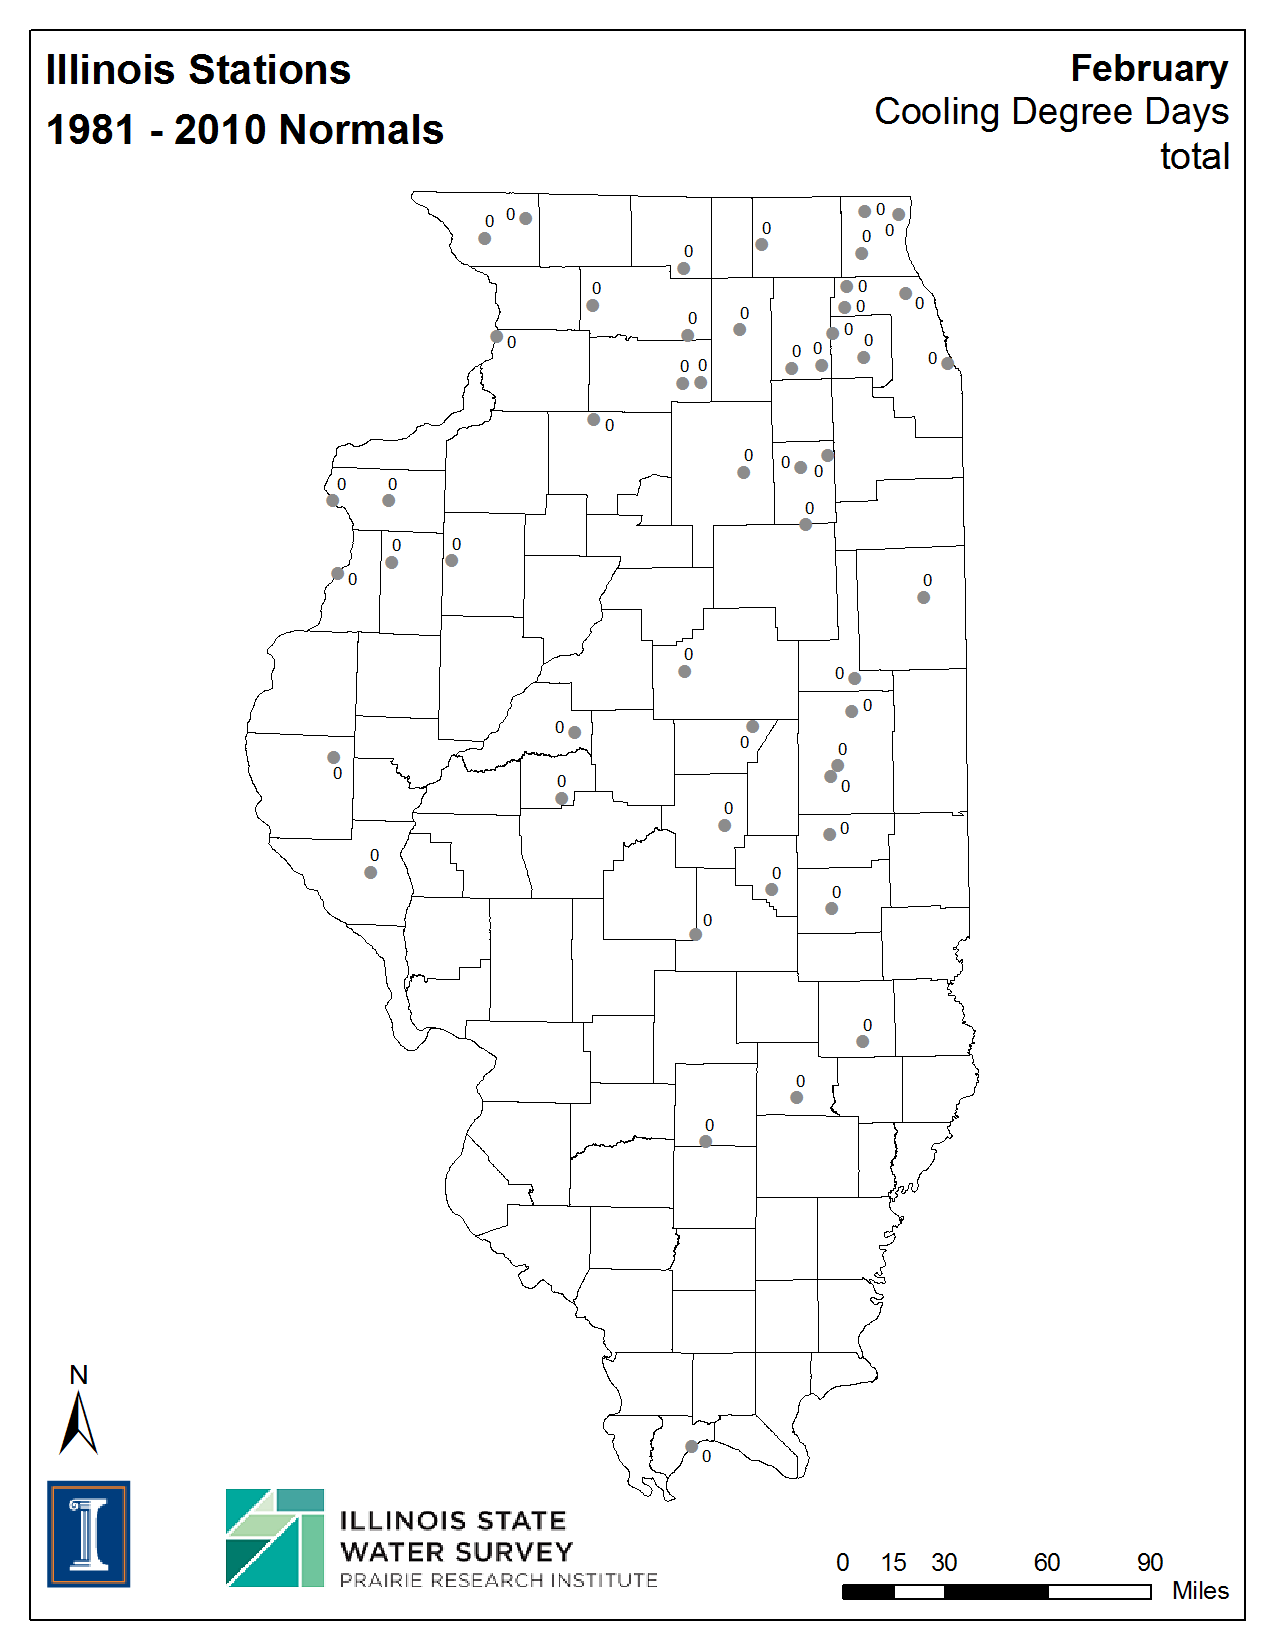
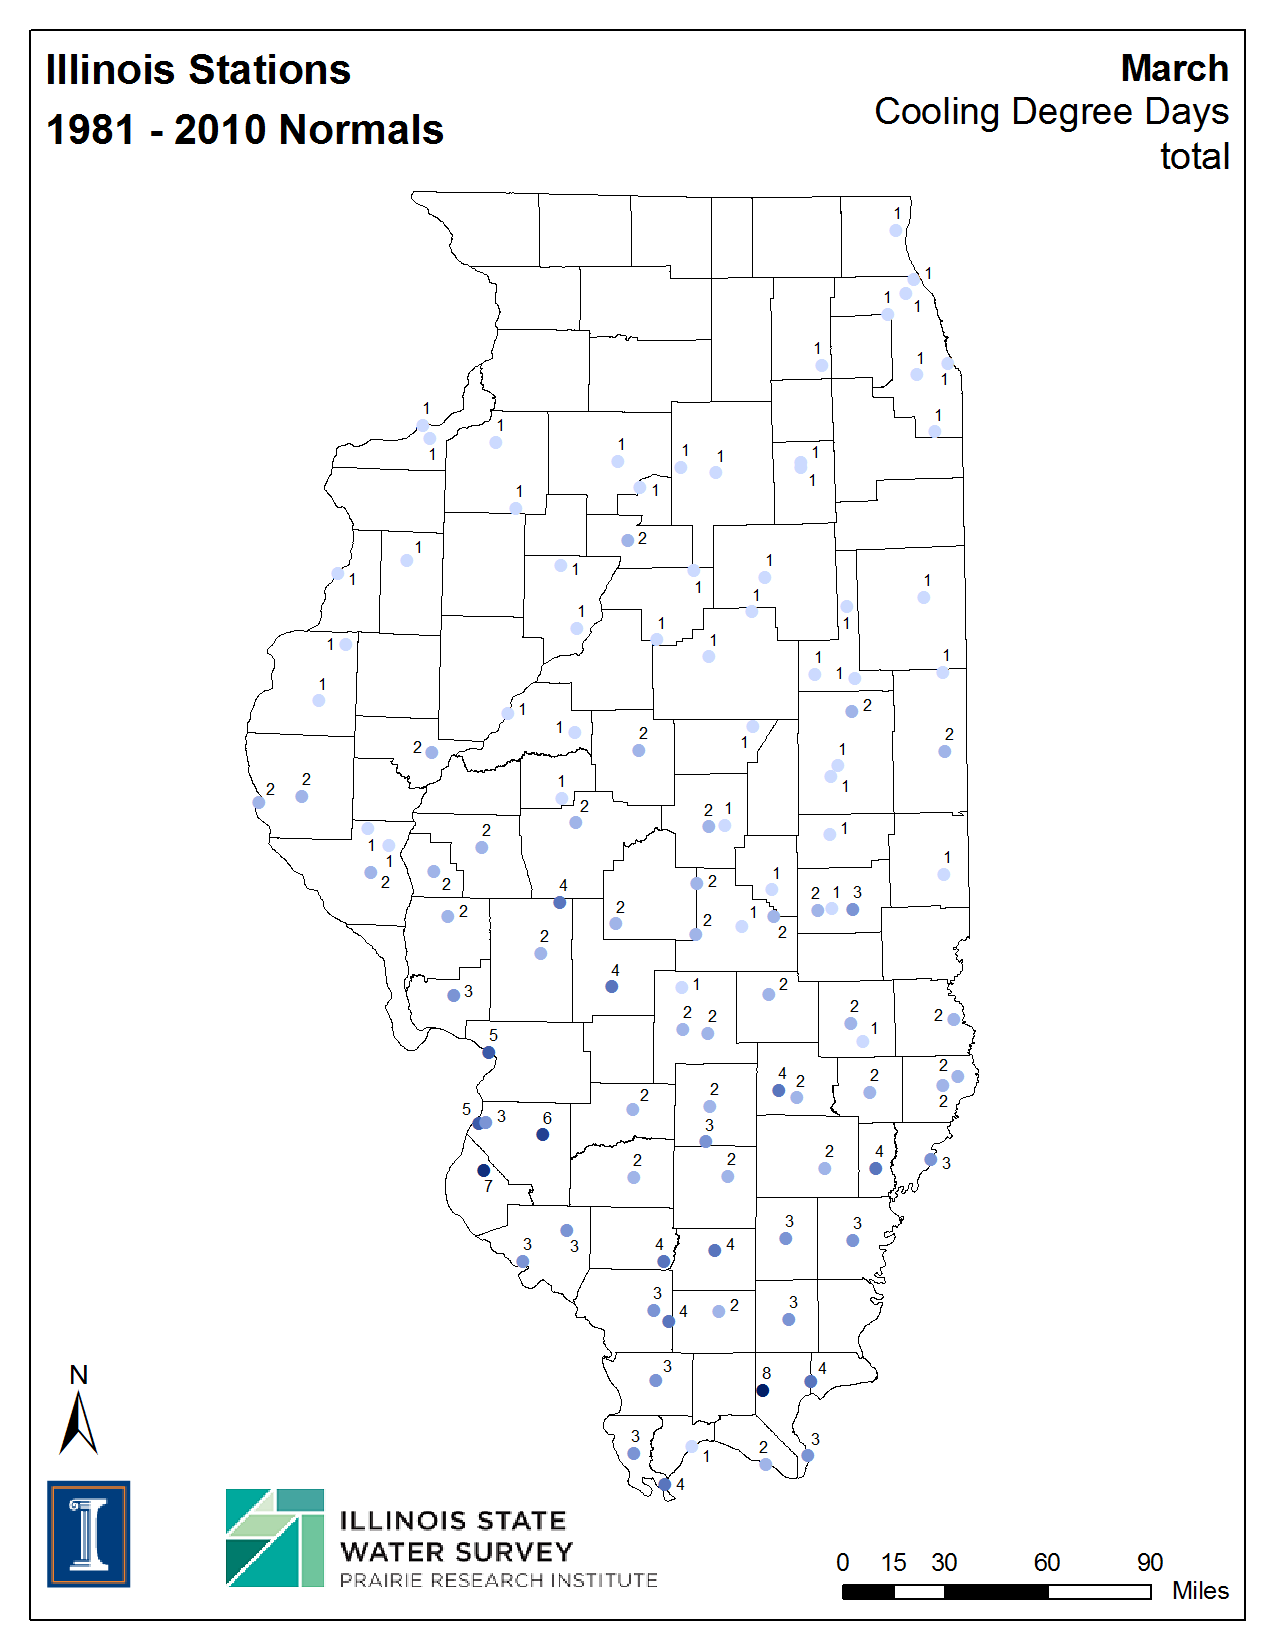
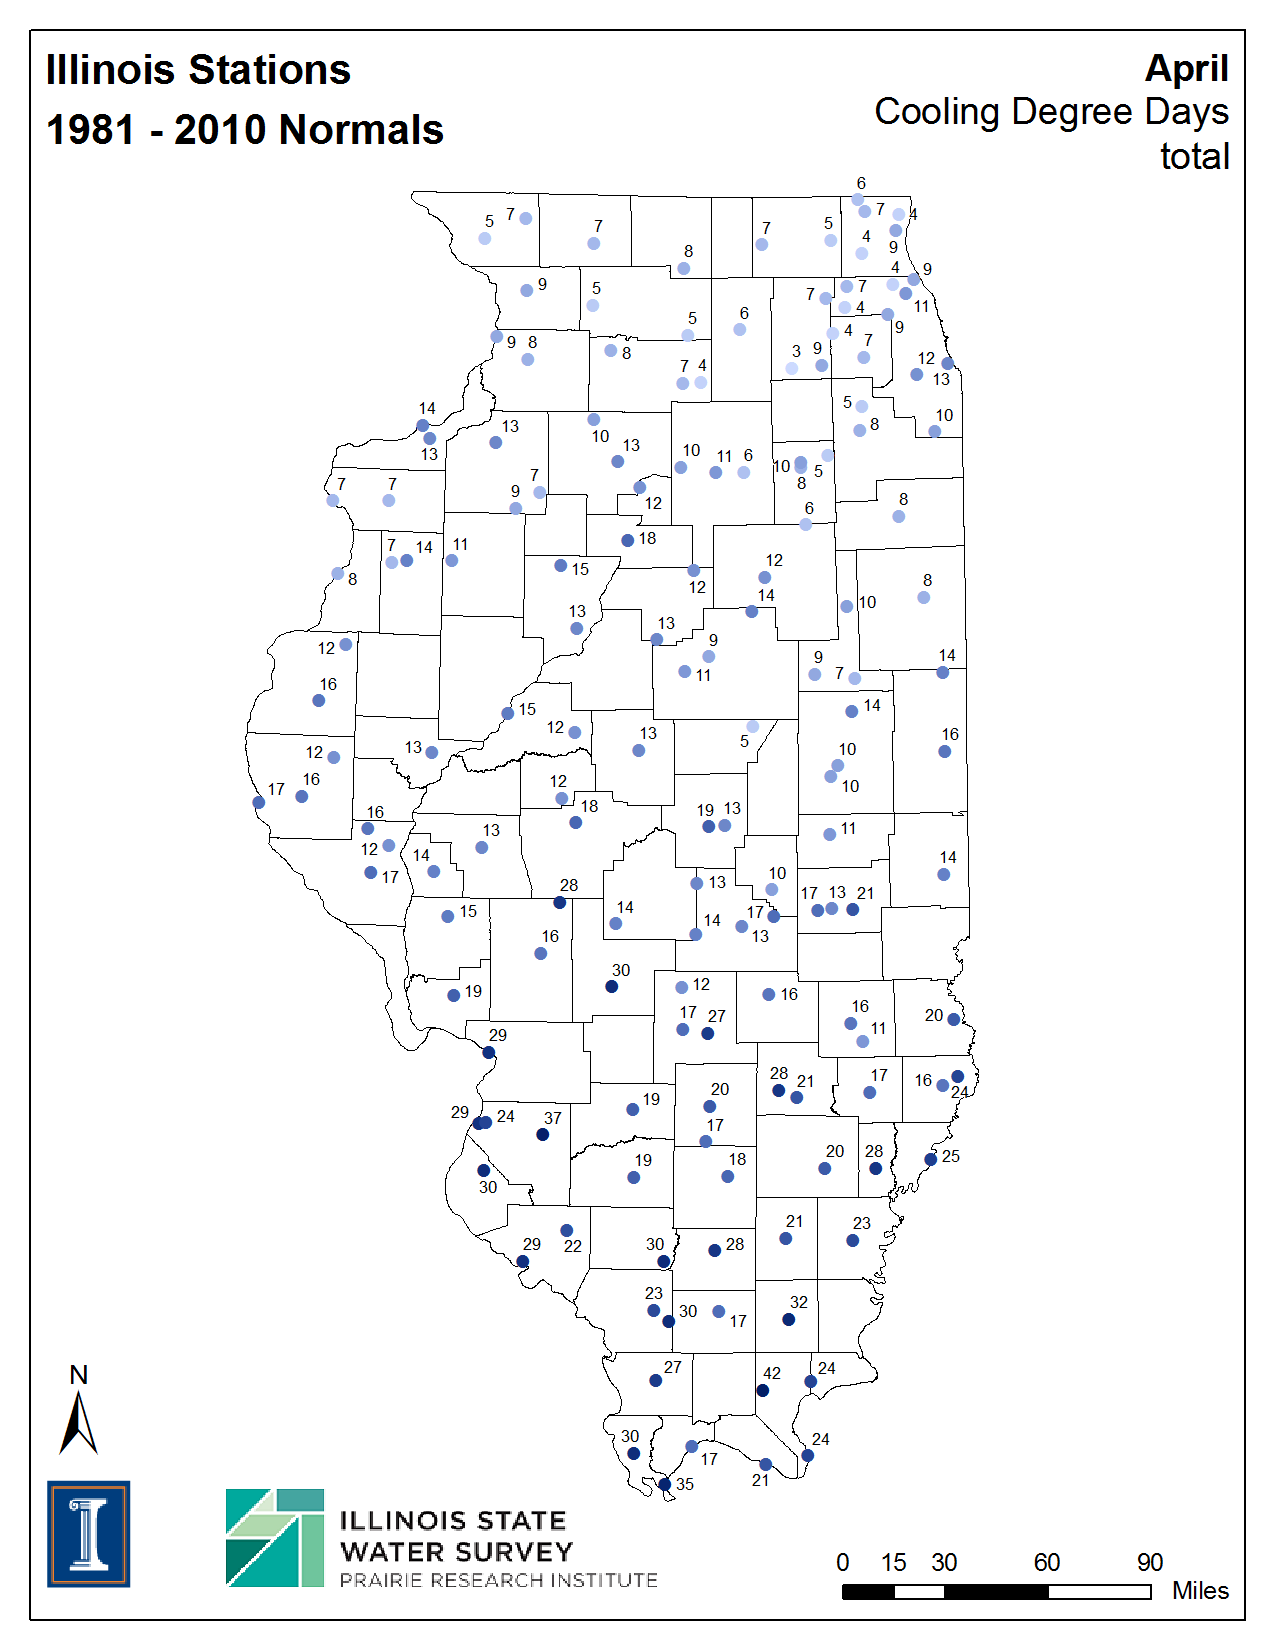
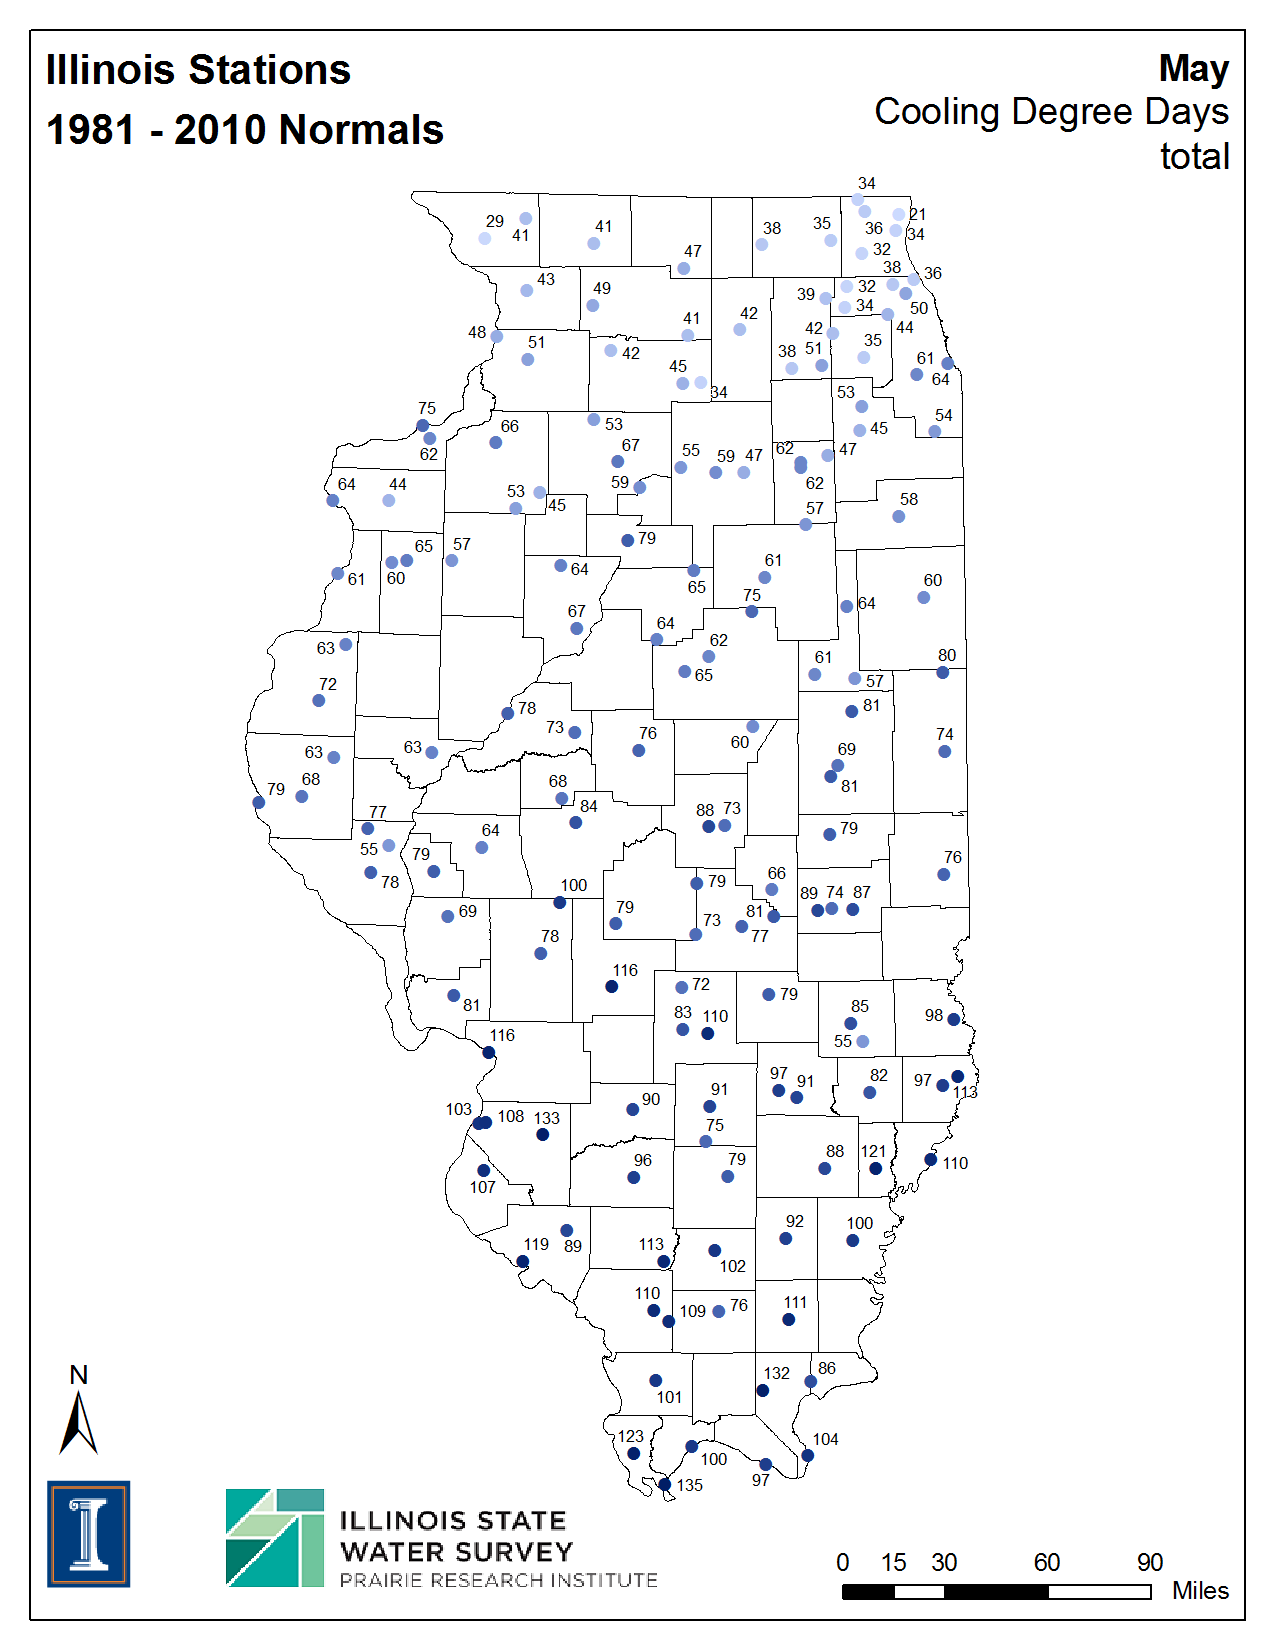
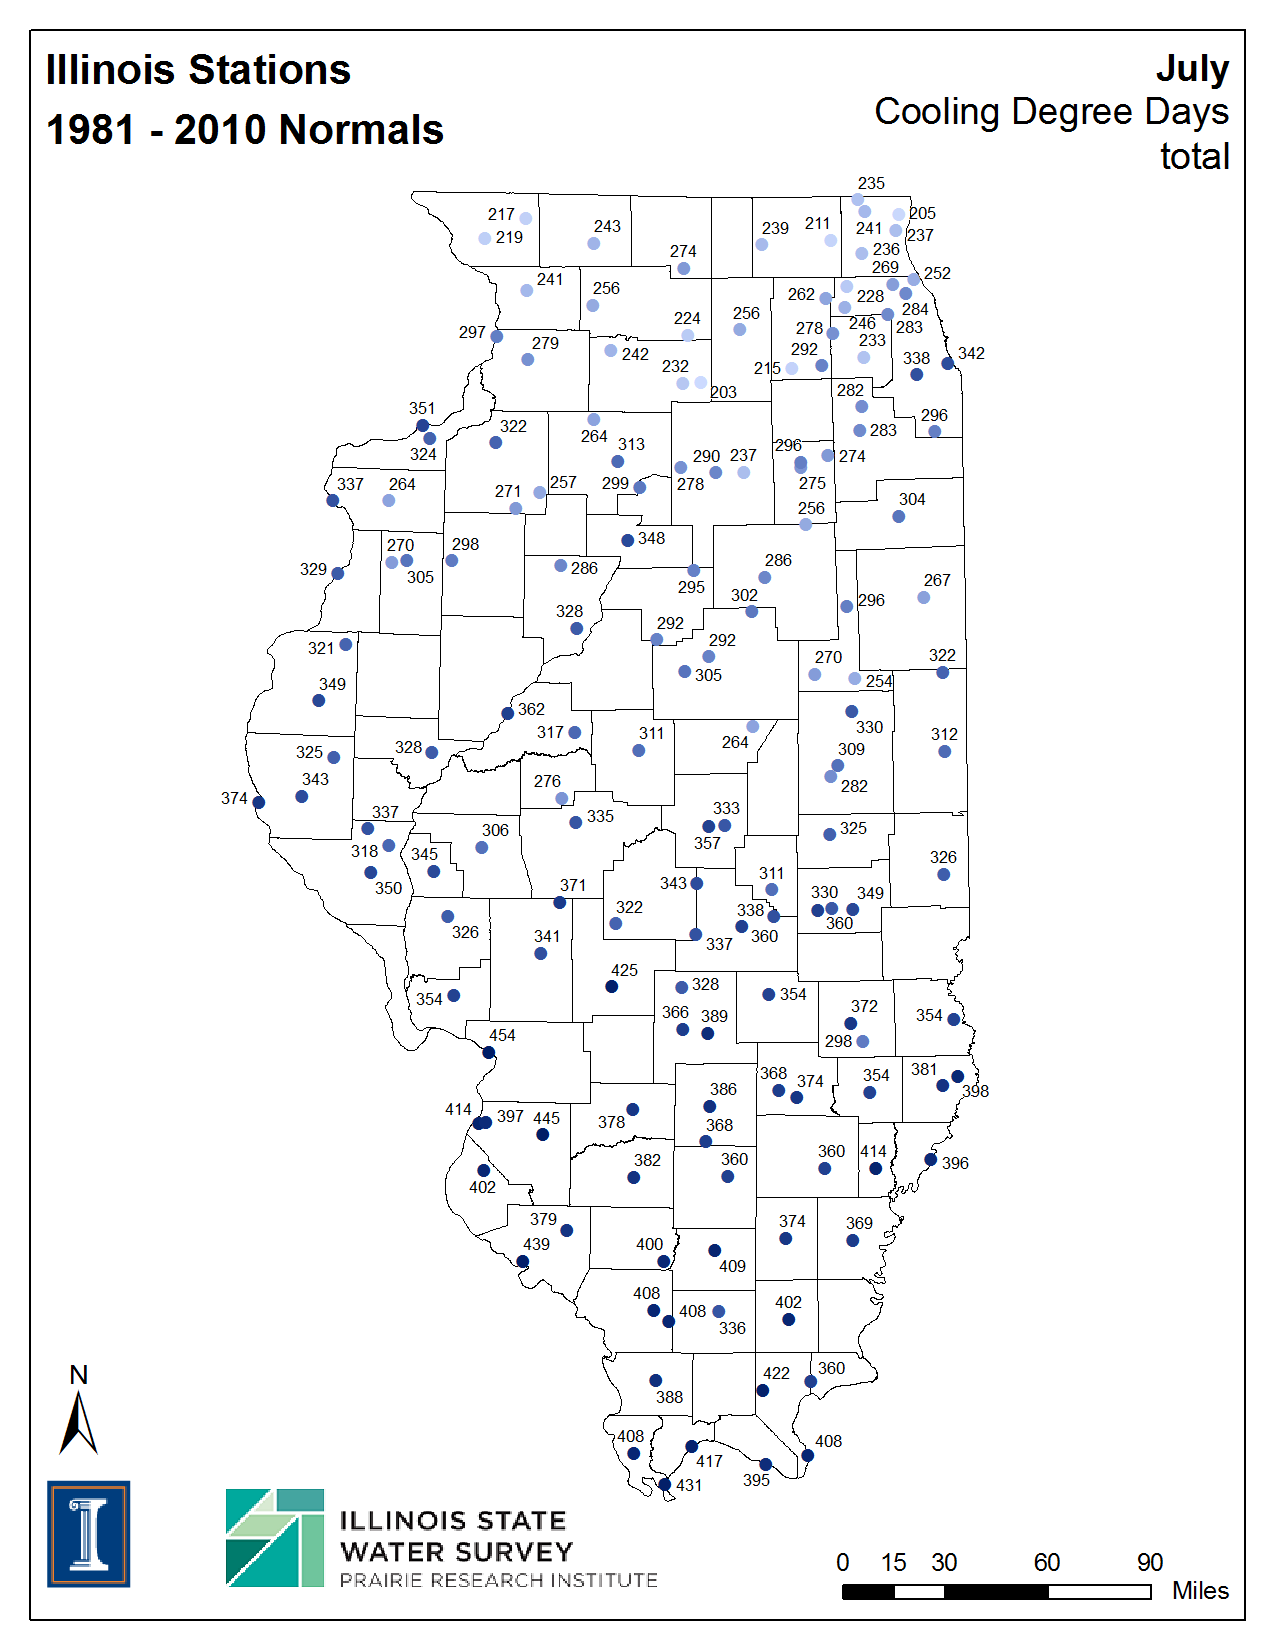
The Illinois normals available on NCEI’s website and shown in the maps below based on data from 1991 through 2020. Available maps include precipitation, temperature, snowfall, heating degree days, and cooling degree days, as well as number of days above or below selected thresholds of precipitation, temperature, and snowfall. The data used in these products come from the National Weather Service (NWS) Cooperative Observer Program (COOP). The data are archived at the National Centers for Environmental Information (NCEI).
These maps may be reproduced and redistributed, crediting the Illinois State Water Survey (see data disclaimer). ISWS GIS specialist Zoe Zaloudek generated the maps using ArcGIS and Python scripts.