Dry and Mild Start to Fall

The preliminary statewide average September temperature was 66.8 degrees, 0.6 degrees above the 1991–2020 average and the 57th warmest on record going back to 1895. The preliminary statewide average total September precipitation was 2.66 inches, 0.53 inches below the 1991–2020 average and the 41st driest on record statewide.    

Data are provisional and may change slightly over time.

A Mostly Mild September

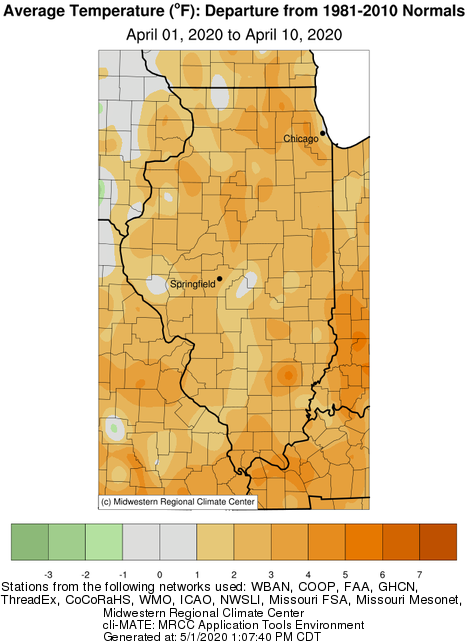
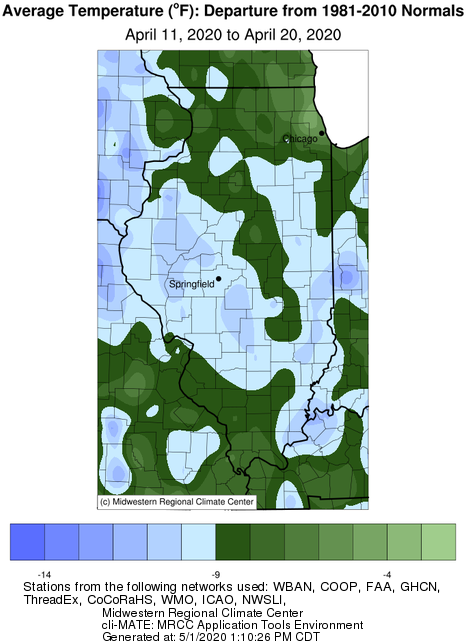
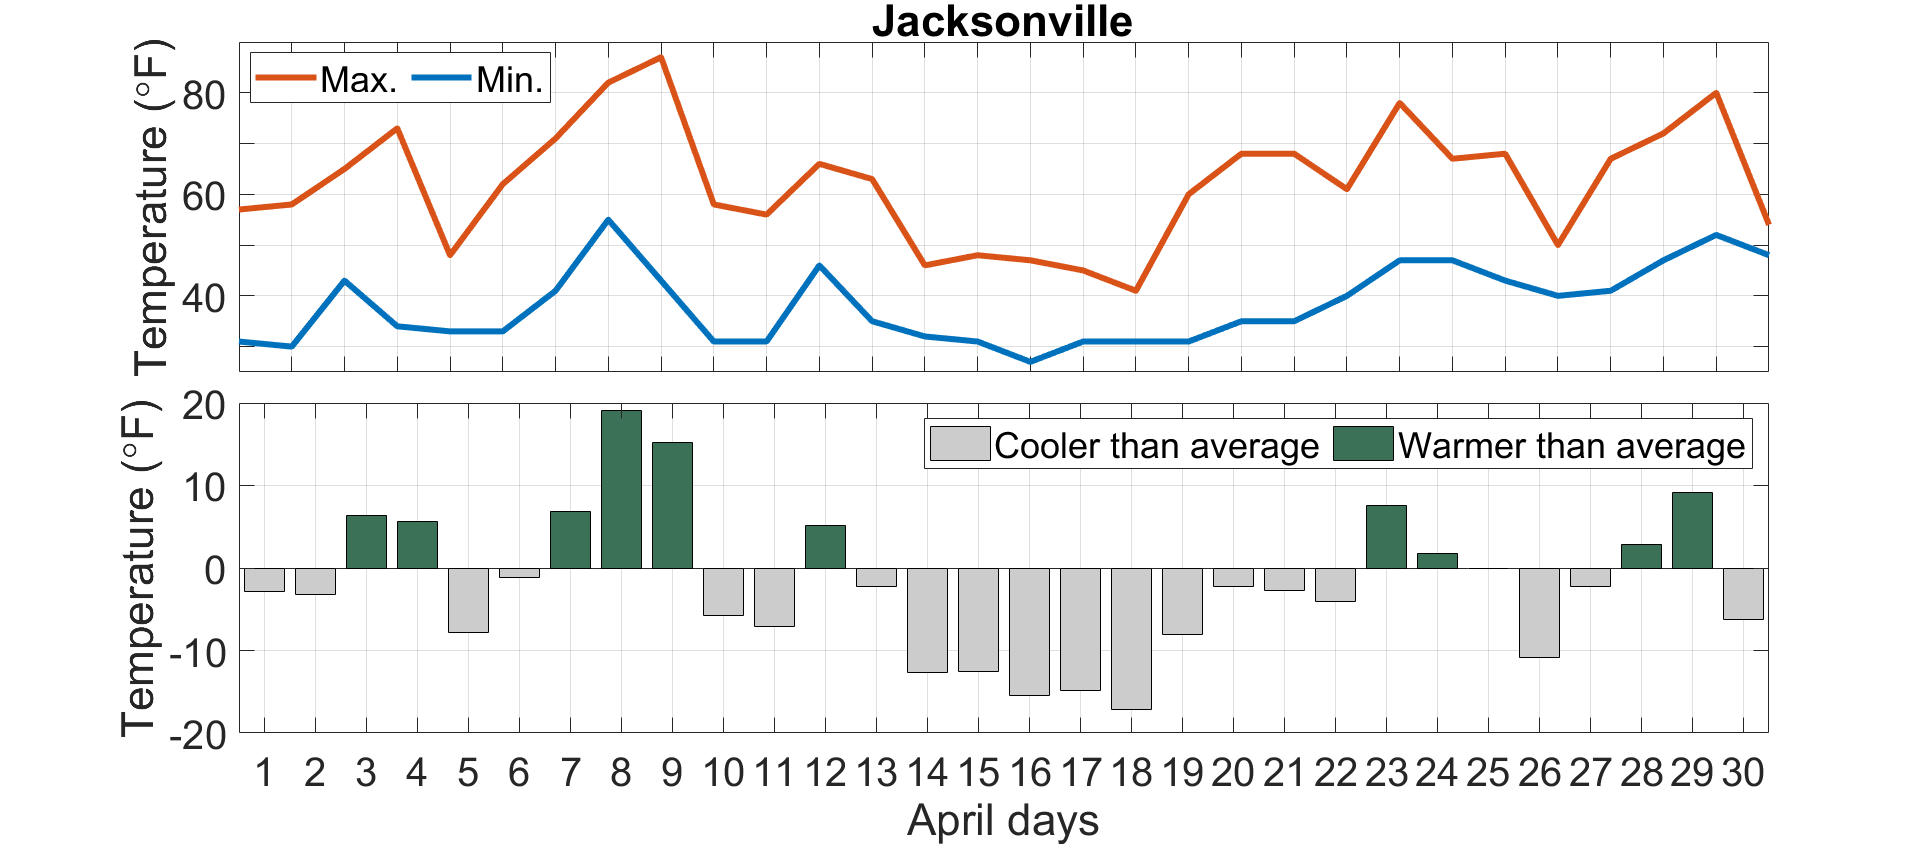
September followed August’s lead and brought mostly mild temperatures across the state. As the temperature departures from Jacksonville in Figure 1 show, the only prolonged warm period last month was in the third week, when temperatures were 5 to 15 degrees above normal. A cold front swept through Illinois around the fall equinox and brought much cooler, fall-like weather to wrap up the first month of climatological fall.

Figure 1. Daily September average temperature departures in Jacksonville.

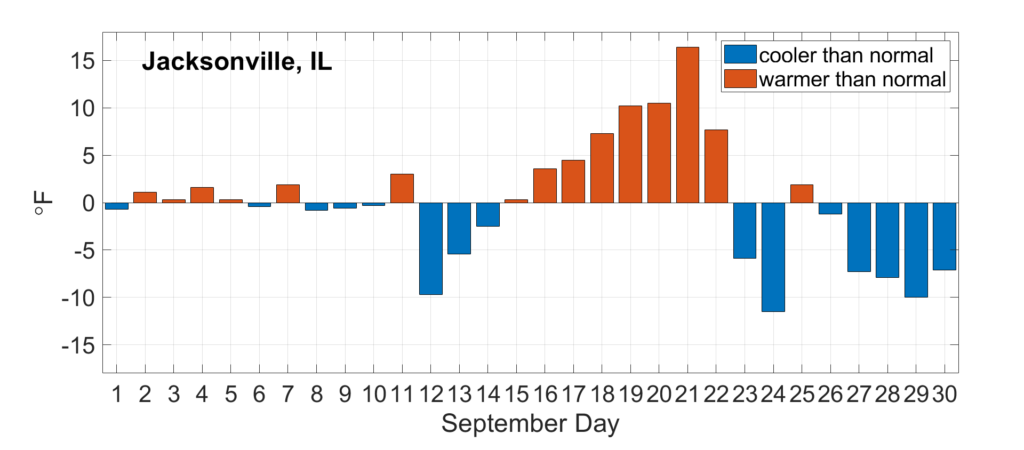
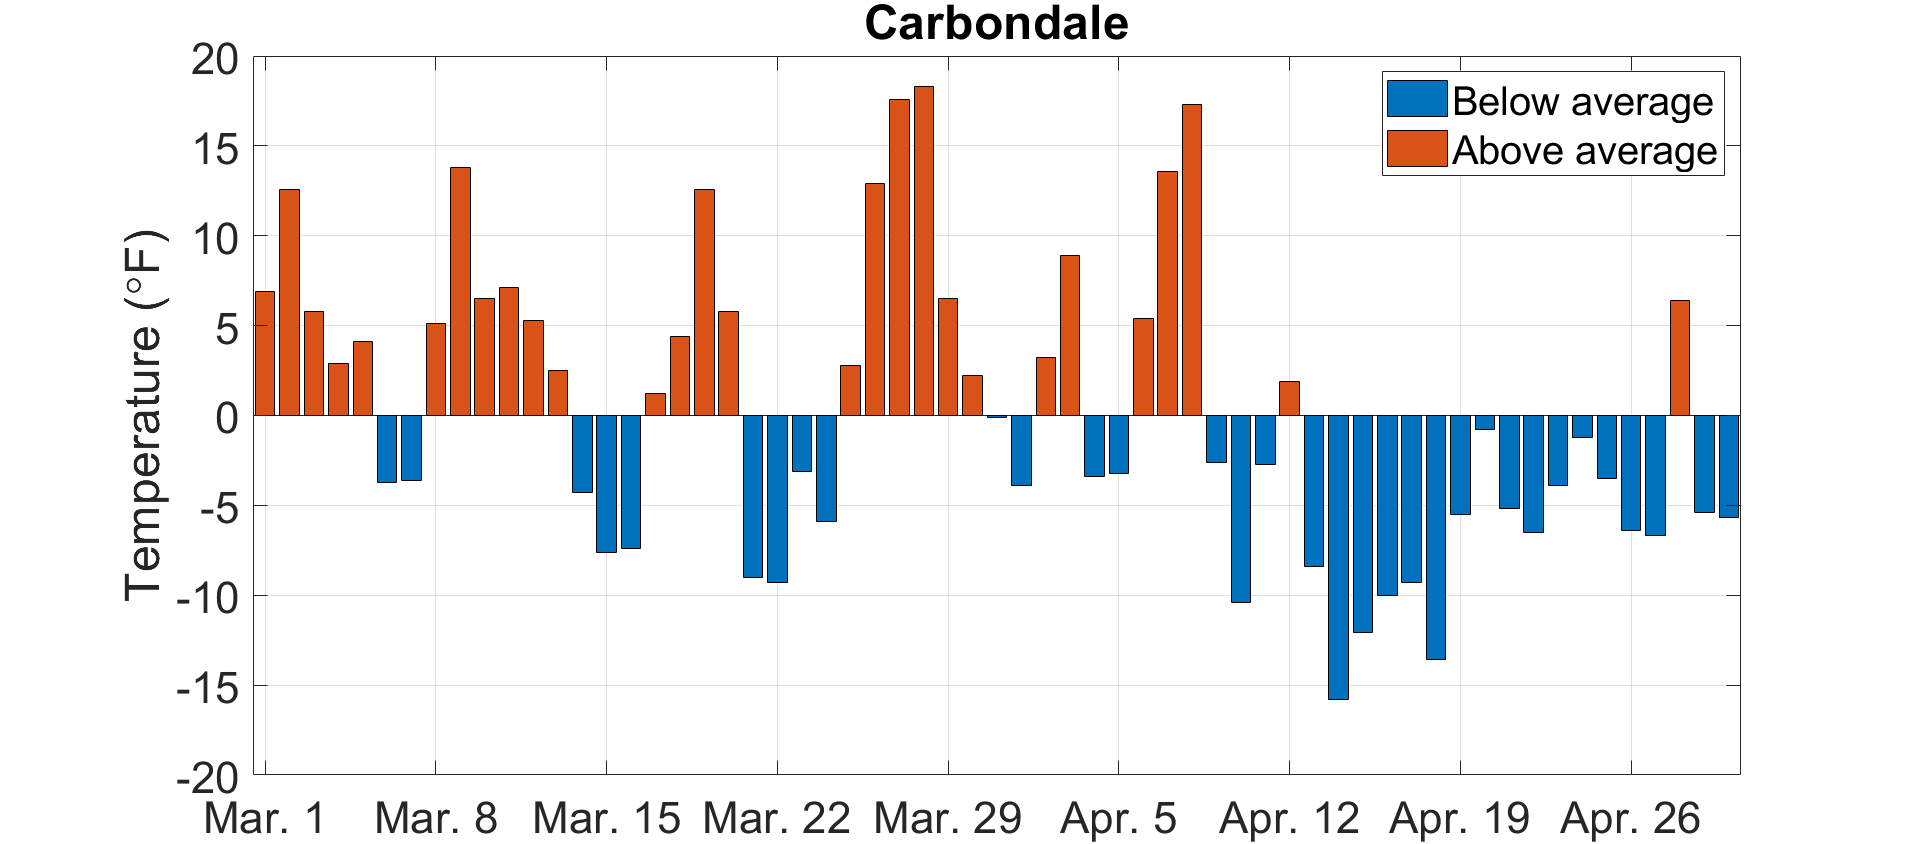
During the hot week in the third week of September, high temperatures reached into the mid- to upper 90s across the state. Among the very high temperatures was 99 degrees observed in Carbondale on Sept. 21, tied with 1940 and 1955 for the second latest 99+ degree temperature on record in Carbondale.

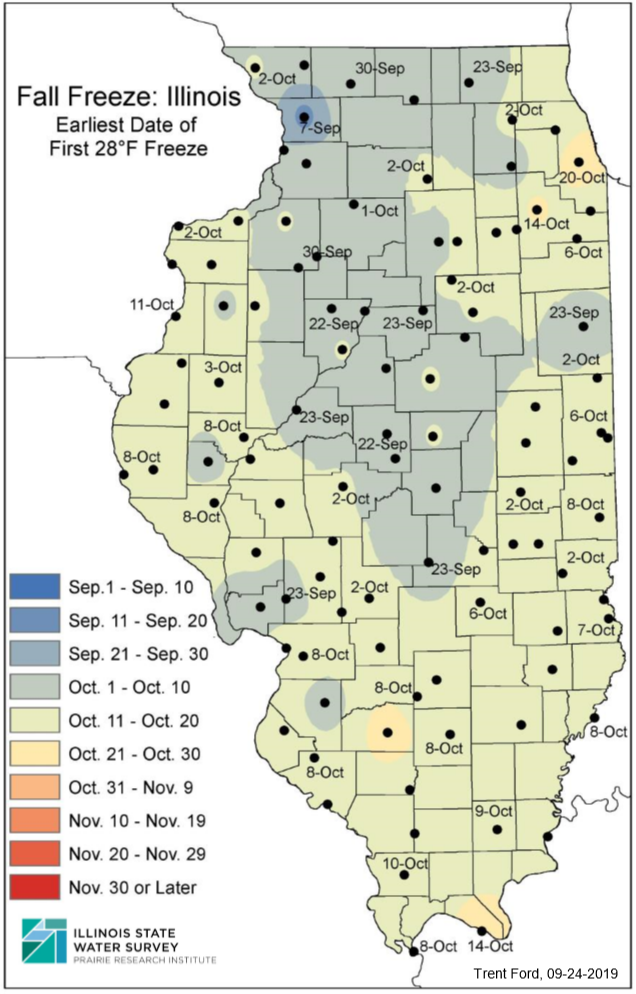
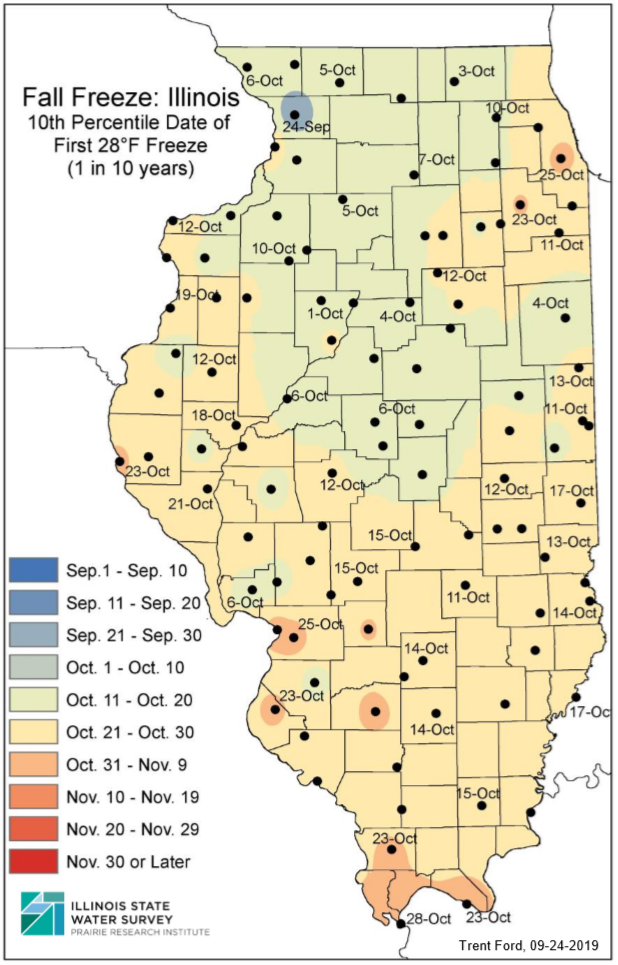
However, the cold front that moved through the state around Sept. 21 brought much cooler, drier air into the region. Nighttime low temperatures in the final week of the month regularly dipped into the upper 30s and low 40s. A few stations even reached the 32-degree mark in the last week of September, including the 19th earliest first fall freeze on record in Normal.

September average temperatures ranged from the low 60s in northern Illinois to the low 70s in southern, within 1 degree of normal statewide (Figure 2). The warmest place in the state last month was Bean Ridge in Alexander County with an average September temperature of 72.8 degrees. The coolest place was Stockton in Jo Daviess County with an average September temperature of 63.0 degrees.

Figure 2. Maps of (left) September average temperature and (right) September average temperature departures from normal.

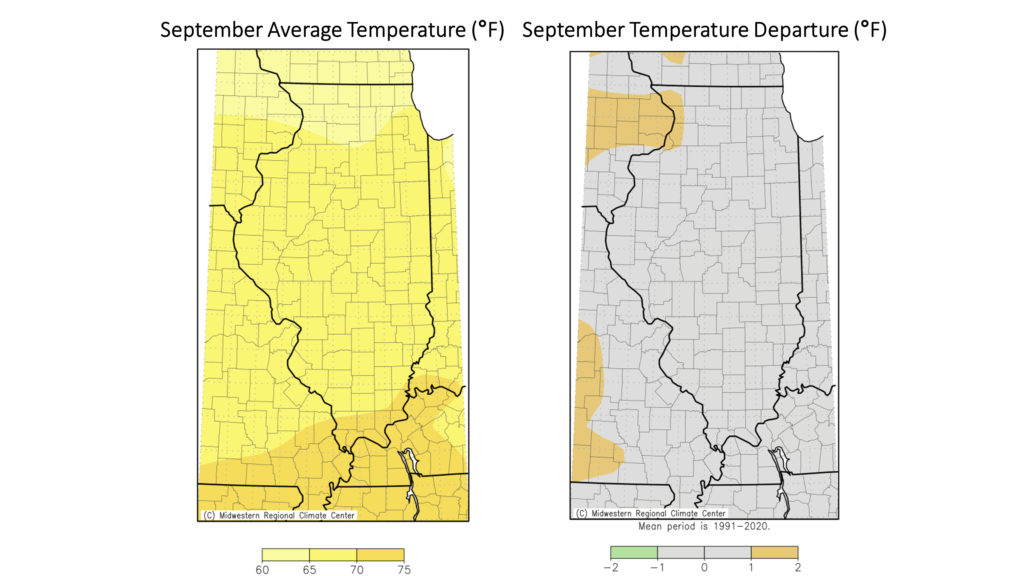
Daily high maximum temperature records were broken last month at 27 stations, and daily high minimum temperature records were broken at 5 stations. Daily low maximum temperature records were broken last month at 4 stations, and daily low minimum temperature records were also broken at 4 stations.  

Overall, the preliminary statewide average September temperature was 66.8 degrees, 0.6 degrees above the 1991–2020 average and the 57th warmest on record going back to 1895.

 Drier Start to Fall

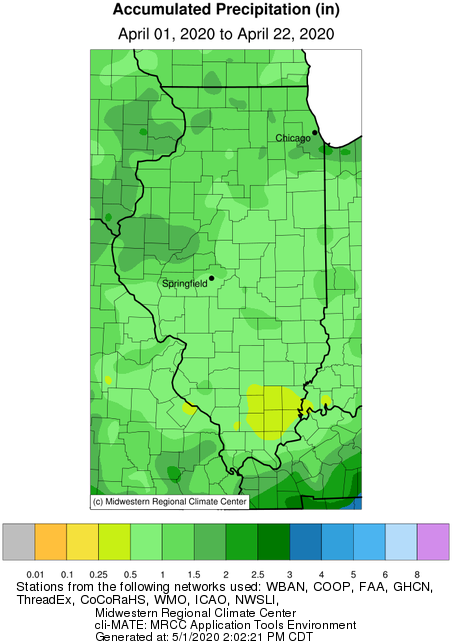
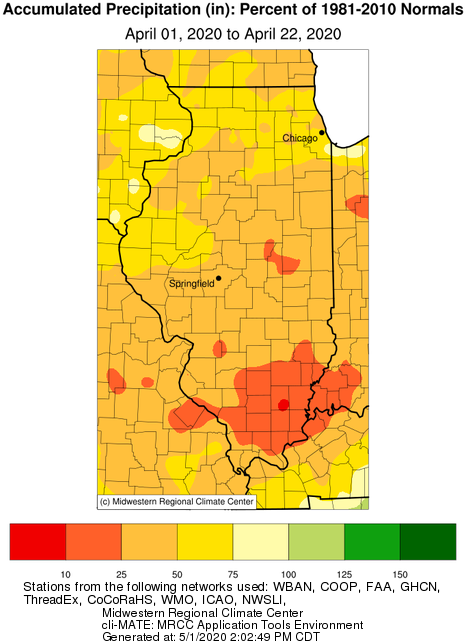
Early to mid-September brought multiple rounds of isolated, heavy precipitation to parts of northern, western, and east-central Illinois. However, significant rainfall eluded most of southern and northeastern Illinois in the first two-thirds of the month. Meanwhile, the final 10 days of the month were cooler and very dry statewide. The result was a much drier than normal September for most of southern and northeastern Illinois and near normal to slightly wetter than normal conditions in parts of northern and west-central Illinois (Figure 3). Specifically, total precipitation last month ranged from over 6 inches in parts of western and northern Illinois to less than 1 inch in far southern Illinois. Smithland Lock and Dam in Pope County recorded only 0.60 inches of rain last month, making it the fourth driest September since 1980 there.

Among the driest points in the state in September was Morton in Tazewell County, which only had 0.58 inches of rain. In contrast, the wettest point in the state in September was Warsaw in Hancock County, with 7.51 inches. One silver lining of the dry weather in the latter half of September was that it allowed a smooth start to fall harvest. However, deteriorating conditions in southern and central Illinois have resulted in an increased fire risk and concerns of low levels in the Mississippi and Illinois Rivers.     

Figure 3. Maps show (left) total September precipitation and (right) September precipitation departure from normal.                                                           

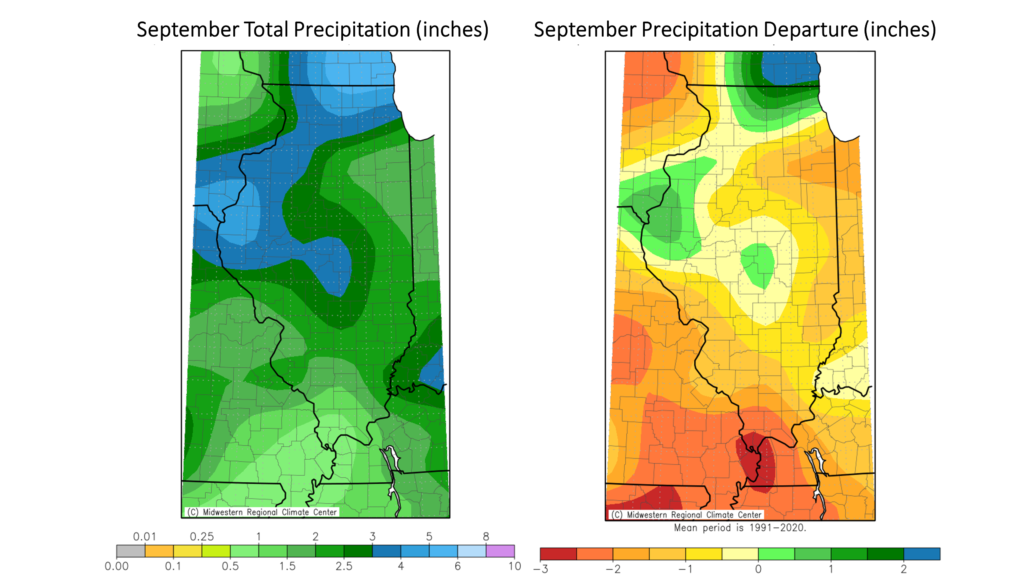
Overall, the preliminary statewide average total September precipitation was 2.66 inches, 0.53 inches below the 1991–2020 average and the 41st driest on record statewide.

The 2021-2022 Water Year

The transition from summer to fall is typically our hydrologically driest time of the year as a result of higher evaporative demand and human demand for water in summer. In contrast, the transition from winter to spring is typically our hydrologically wettest time of the year. Therefore, to best capture the seasonal variability of water availability and water balance, we denote a “water year,” which runs from October 1 to September 30. Figure 4 shows total precipitation and precipitation as a percent of normal for the 2021-2022 water year (October 1, 2021–September 30, 2022). Total water year precipitation ranged from nearly 60 inches in southern Illinois to less than 30 inches in far western Illinois. In all, water year precipitation was between 75 and 125 percent of normal statewide.

Figure 4. Maps show total precipitation and precipitation percent of normal for the 2021-2022 water year.

Outlooks

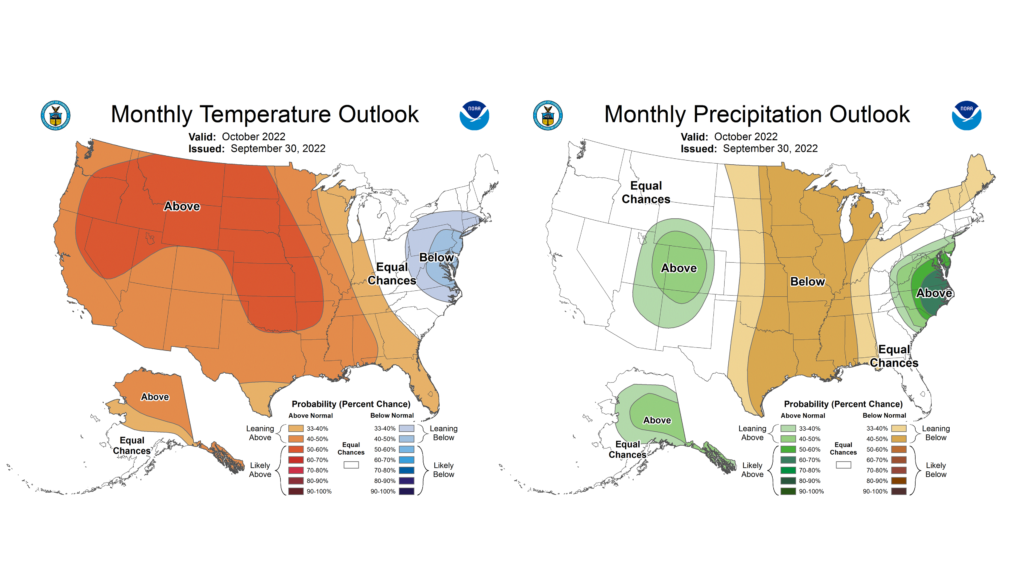
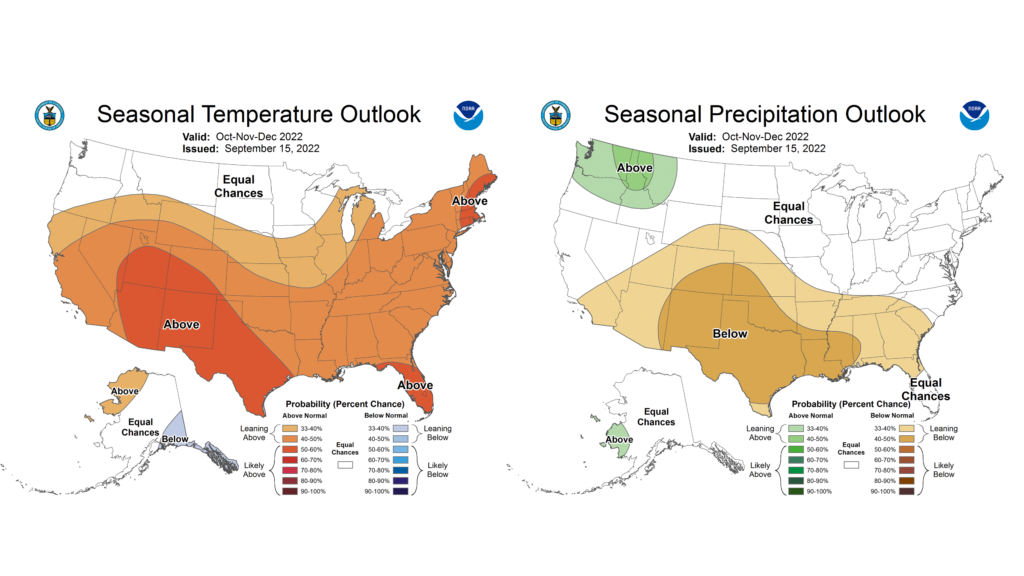
Climate Prediction Center outlooks for October lean toward warmer and drier than normal conditions statewide (Figure 5). Similarly, outlooks for the last three months of the year also lean toward warmer than normal conditions, with near normal rainfall (Figure 6).

Figure 5. Maps show (left) temperature and (right) precipitation outlooks for October.
Figure 6. Climate Prediction Center (left) temperature and (right) precipitation outlooks for October through December.

The Dry April That Wasn’t

April ended colder and wetter than average across the state. The preliminary statewide average April temperature was 49.2 degrees, 3.4 degrees below the 30-year normal and tied for the 27th coldest on record going back to 1895. The preliminary statewide average total April precipitation was 4.36 inches, 0.58 inches above than the 30-year normal and the 43rd wettest on record.

Data are provisional and may change slightly over time

April Temperature Rollercoaster

Warm weather spilled over from March into the beginning of April. Average temperatures between April 1 and April 10 ranged from 1 to 6 degrees above the 30-year normal across the state. A strong cold front moved through the region between April 9 and 11, with following unseasonably cold air that quickly decreased temperatures. Average temperatures between April 11 and 20 ranged from 5 to 15 degrees below normal (see maps below).

Many stations across the state recorded daily maximum temperatures in the mid- to high 80s during the first 10 days of April, only to record daily minimum temperatures in the mid- to low 20s in the second 10 days. For example, stations in McHenry and Woodford Counties recorded high temperatures of 82 degrees on April 9 and one week later recorded low temperatures of 20 degrees on April 16. Fourteen stations around the state broke daily April high maximum temperature records and three stations broke daily April high minimum temperature records between April 7 and 12. Subsequently, 20 stations broke the daily April low maximum temperature records and 30 stations broke the April low minimum temperature records between April 13 and 20.

The plots below show daily maximum and minimum temperatures, as well as daily average temperature departures from normal, for April in Jacksonville. The average temperature in Jacksonville on April 8 was nearly 20 degrees above the long-term average, and the average temperature 10 days later on April 18 was nearly 20 degrees below the long-term average.

Overall, April average temperatures ranged from the low 30s in northern Illinois to the mid-50s in southern Illinois. April was cooler than normal across the state. The preliminary statewide average April temperature was 49.2 degrees, 3.4 degrees cooler than normal and the 27th coldest on record back to 1895. April ended the consecutive four-month streak of warmer than normal months going back to December 2019.

Spring Freeze

As a result of the strong cold front that moved through the region in mid-April, minimum temperatures dipped below freezing as far south as Pope County. Stations in northwest Illinois recorded minimum temperatures in the teens on April 8. Late-season freeze events in early to mid-April are not uncommon; however, last month’s event followed a prolonged period of well above average temperatures. The plot below shows daily average temperature departures from the 30-year normal from March and April in Carbondale. Between March 1 and April 12, Carbondale experienced twice as many warmer than normal days than cooler than normal days. Furthermore, the minimum temperature in Carbondale last dipped below freezing on March 7 before reaching 30 degrees on April 14.

Flowering trees, shrubs, and tender perennials broke dormancy and began to green in response to prolonged warm conditions throughout March and early April. This increased the vulnerability of Illinois specialty crops such as peaches, strawberries, and asparagus to the late-season freeze. University of Illinois Extension reported some damage to specialty crops in most regions of the state as a result of the freeze event in mid-April. The extent of damage was likely curtailed by successful warming of the sub-freezing temperatures five to seven days prior to the event.

Heavy Late-April Rain

The first two-thirds of last month was somewhat to very dry across the state, with most areas experiencing less than 50 percent of normal precipitation by April 20 (see maps below). The station in Rosiclaire in Hardin County recorded less than one-half an inch of rainfall in the first 22 days in April, putting last month on track for one of the driest Aprils on record. Likewise, areas of east-central Illinois were experiencing a 2-inch precipitation deficit by April 22. The prolonged dry conditions caused soils to dry considerably. Both 4-inch and 8-inch soils at the Illinois Climate Network station in Bondville in Champaign County were at their driest April levels since 2012. The dryness was quite a contrast to April 2019 and was beneficial for farmers to make planting progress.

The dry weather was brought to an abrupt end by a series of storms that tracked across Illinois over the last week in April, generating very heavy rainfall and widespread 2- to 4-inch accumulations along the Interstate 55 corridor between the St. Louis Metro East and Chicagoland (see map below). The heaviest rainfall was in central Illinois between Mason and McLean Counties.

The Bloomington Waterworks station recorded 4.99 inches on April 26, which was the largest single-day April precipitation event on record at that station going back to 1949. The wettest point in the state last month was Havana in Mason County. The Havana station recorded just over 2 inches of precipitation in the first 22 days of April and was experiencing nearly a three-quarter-inch precipitation deficit at that time. Havana received nearly 6 inches of precipitation in the following seven days and ended the month with an all-time April record-breaking precipitation total of 7.8 inches (see plot below).

Heavy precipitation in late April caused flash flooding across central and northeastern Illinois as well as inundated fields and resultant planting delays. Additionally, many gauges along the Illinois River, Des Plaines River, and Mississippi River south of Hardin were pushed into the flood stage.

Total March precipitation ranged from just under 8 inches in central Illinois to less than 2 inches in southeastern and northwestern Illinois. These totals ranged from over 175 percent of average April precipitation in central to less than 50 percent of average April precipitation in southern Illinois.

Overall, the preliminary statewide average April precipitation was 4.36 inches, 0.58 inches above than the 30-year normal and the 43rd wettest on record. The April average does not reflect the 5- to 6-inch differences in precipitation between central and northern/southern Illinois.

Most of the northern half of the state experienced measurable snowfall last month. April totals ranged from over 8 inches in north central Illinois to just over one-tenth of an inch along Interstate 72. A single storm in mid-April produced widespread 24-hour snowfall totals between 1 and 3 inches in central and northern Illinois, with a few much larger isolated totals. Areas of Warren, Henry, Knox, and Mercer Counties received more than 6 inches of snowfall in a single day, including the third and fifth highest single day April snowfall totals in Kewanee and Galesburg, respectively. This event was also the latest 5-inch or larger snowfall event on record at nearly a dozen stations around the state.

With April on the books, the total 2019–2020 season snowfall ranged from over 50 inches in far northern Illinois to less than 1 inch in southeastern Illinois. Most areas of the state north of Interstate 70 experienced a snowier than average season (see maps below).

Outlooks

Short-term 8–14-day outlooks from the NOAA Climate Prediction Center show strongly elevated odds of below normal temperatures and slightly elevated odds of above normal precipitation across the state.

Longer-term 30-day outlooks are similar to the 8–14-day outlooks, with continued, albeit weaker, chances of cooler and drier conditions, especially for the northeastern half of the state for May. 


Illinois First Fall Freeze Climatology

Due to significant planting delays across most of the Midwest this year, I have heard many concerns about an early fall freeze and its potential effects on immature crops. Most plants experience damage from a hard freeze or “killing freeze”, which is typically designated by a daily minimum air temperature at or below 28°F. Even in normal growing seasons, an early fall freeze can cause considerable impacts and yield losses for crops. Delayed planting, as was the case this season, increases the risk of freeze damage because crops are less mature going into our normal fall freeze time.

The maps and summary below show first fall freeze dates across Illinois using temperature observations over the period 1979 to 2018. The maps show the earliest and latest fall freeze dates over this 40-year period, as well as the median date, which represents the middle value in the range of dates. The median is preferred over the mean or average, as it is less sensitive to very early or very late freeze dates. Also shown are the 10th (1 in 10 years) and 90th (9 in 10 years) fall freeze dates. All station temperature data were provided by the Midwest Regional Climate Center (https://mrcc.illinois.edu); the shaded areas between stations on the map were interpolated and do not represent actual observations.

The earliest fall freeze dates over the past 40 years range from late September in northwest and central Illinois, to early October in southern and eastern Illinois. An early freeze anomaly can be seen at the Mt. Carroll station (Carroll County), which experienced a minimum temperature of 27°F on September 7, 1988. Interestingly, the observed all-season Illinois minimum temperature record was broken earlier this year at the Mt. Carroll station (-38°F).

Tenth percentile first fall freeze dates (i.e., 1 in 10 years) range from early October in northwest and central Illinois to mid- to late October in southern and eastern Illinois.

Median first fall freeze dates range from mid- to late October in northwest and central Illinois to late October/early November in southern and northeastern Illinois. Approximately half the years between 1979 and 2018 experienced the first fall freeze before the median dates. Also, the median dates map clearly shows the effects of the developed Chicagoland area on nighttime minimum temperatures. The median first fall freeze date at Chicago Midway is 10 to 15 days later than in some of the collar counties.

Ninetieth percentile first fall freeze dates (i.e., 9 in 10 years) range from early November in northwest and central Illinois to mid- to late November in southern Illinois. Based on the 40-year climatology, one could say that there is a 90% chance that the first fall freeze on any given year will occur on or before the dates in the 90th percentile map.

Finally, the latest first fall freeze dates across the state range from mid- to late November in northwest Illinois to early to mid-December in southern Illinois.

Note that air temperatures can vary considerably on smaller or micro-scales. For example, plants near heated buildings or other development can be spared when minimum temperatures dip below the 28°F threshold in the countryside. More information and useful freeze products are provided by the Midwestern Regional Climate Center as part of their Vegetation Impact Program (https://mrcc.illinois.edu/VIP/indexFFG.html).  Higher quality, full-page maps can be accessed by clicking the following links:

10th_Percentile 90th_Percentile Earliest Latest Median

Frost in Illinois – Not Quite Yet

While cold air moved in behind the low-pressure system that passed through the Midwest this week, it looks like Illinois will likely dodge the freezing temperatures for now. But someday they will come. Here are the median dates for when we see the temperatures drop to 32 or below in fall, as well as the earliest date in 1 out of 10 years.

In general, we hit 32 degrees in early October for northern Illinois and mid October for central and southern Illinois. In 1 year in 10, we have seen 32 degrees in the last week of September (second map) or the first few days of October. See more maps and discussion of frost on the State Climatologist web site.

fall-freeze-32-median

Continue reading “Frost in Illinois – Not Quite Yet”