

High-resolution precipitation maps based on National Weather Service radar-estimated precipitation, adjusted using available rain gauge data. This results in 4 km (or 2.5 mile) resolution maps of precipitation. These are typically updated by 4:15 p.m. each day for conditions through this morning. It takes a lot of behind-the-scenes processing to make this happen. Note, some changes were made to the links on May 2, 2018.
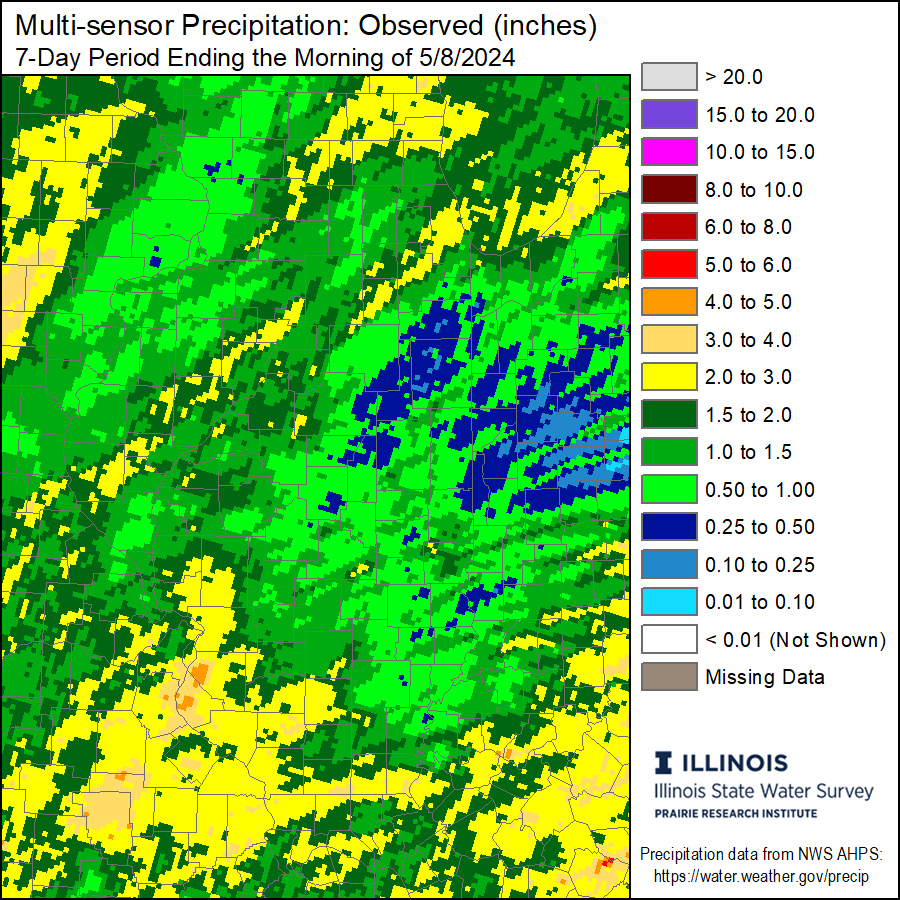
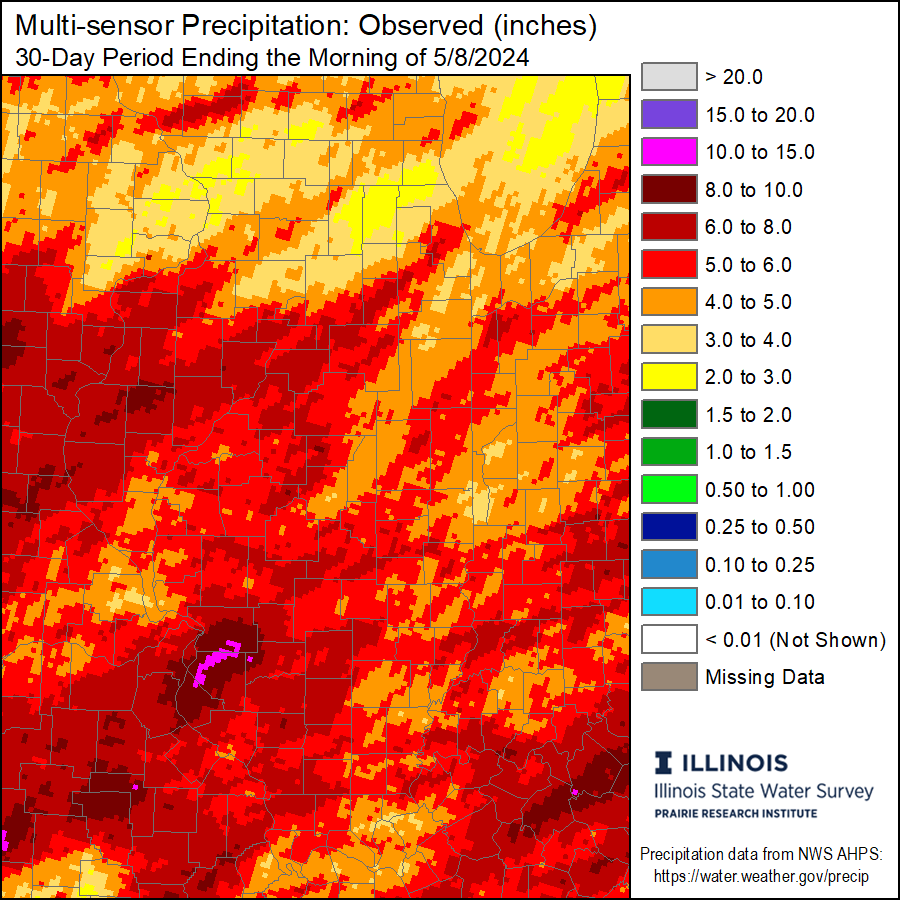
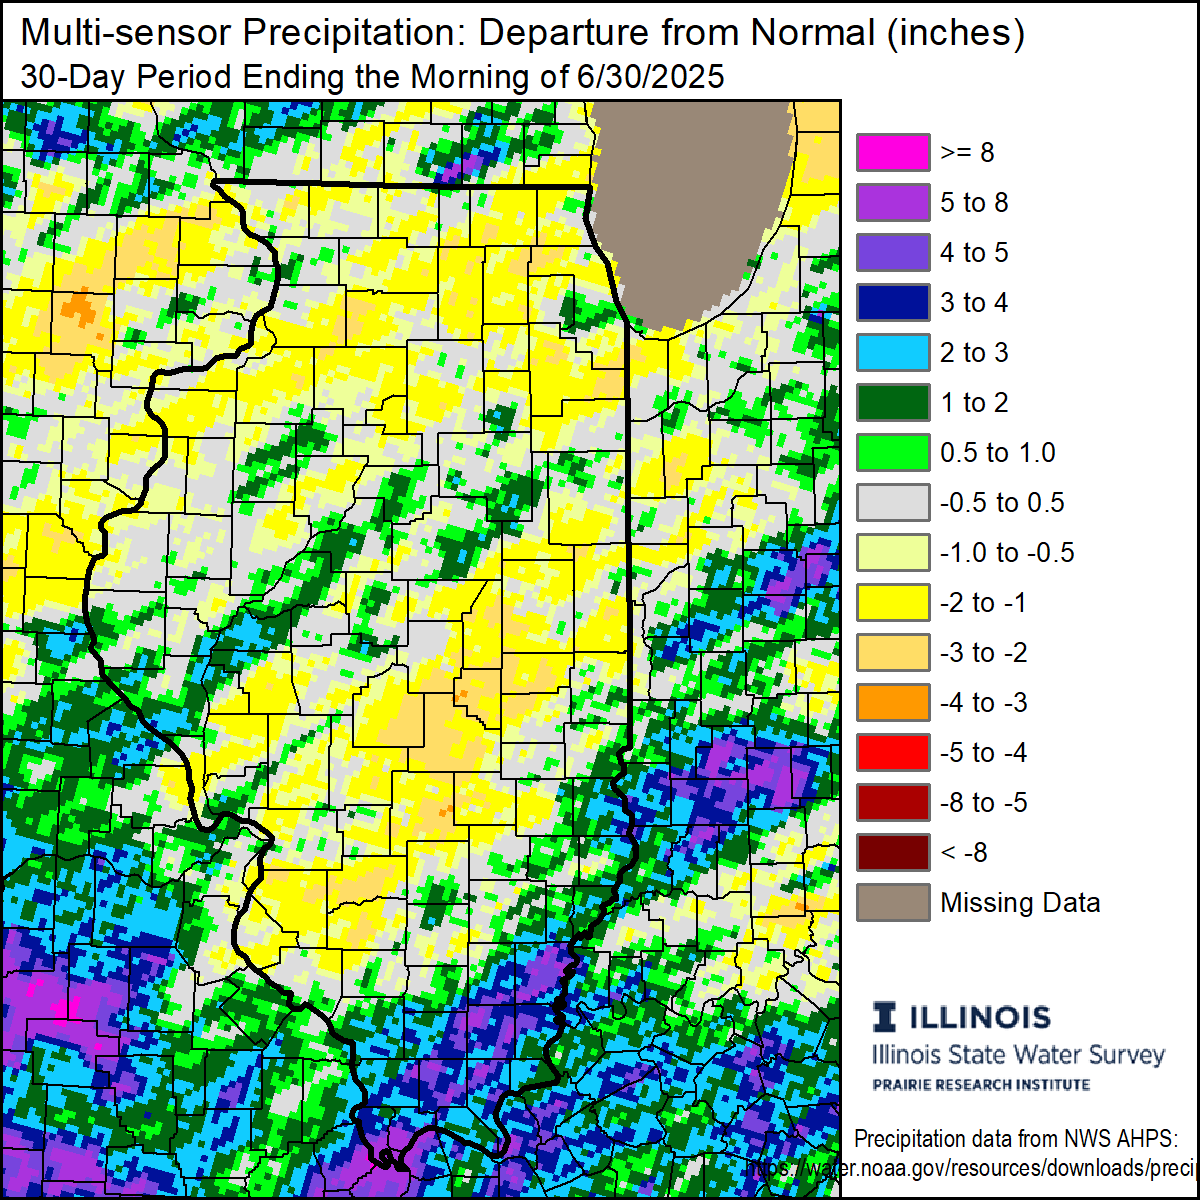
Total – Last 24 Hours
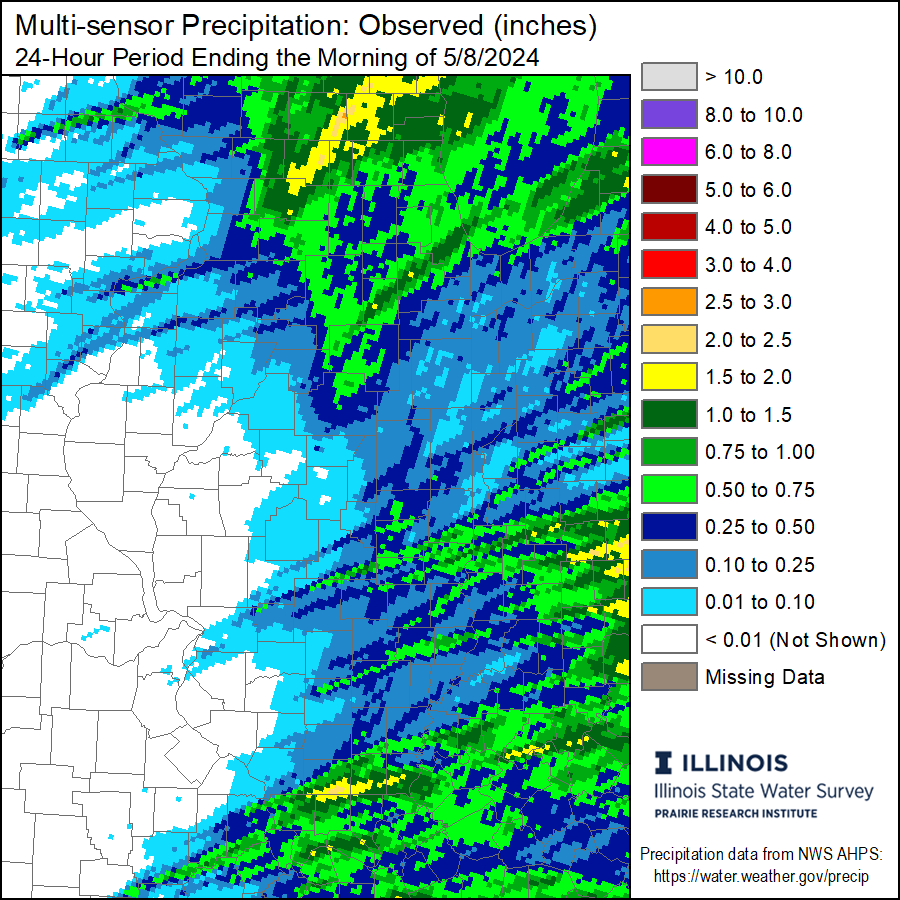
Precipitation
 |  |  |
|
 |  |  |
|
 |  |  |
|
 |  |  |
|
 |  |  |