April ended colder and wetter than average across the state. The preliminary statewide average April temperature was 49.2 degrees, 3.4 degrees below the 30-year normal and tied for the 27th coldest on record going back to 1895. The preliminary statewide average total April precipitation was 4.36 inches, 0.58 inches above than the 30-year normal and the 43rd wettest on record.
Data are provisional and may change slightly over time
April Temperature Rollercoaster
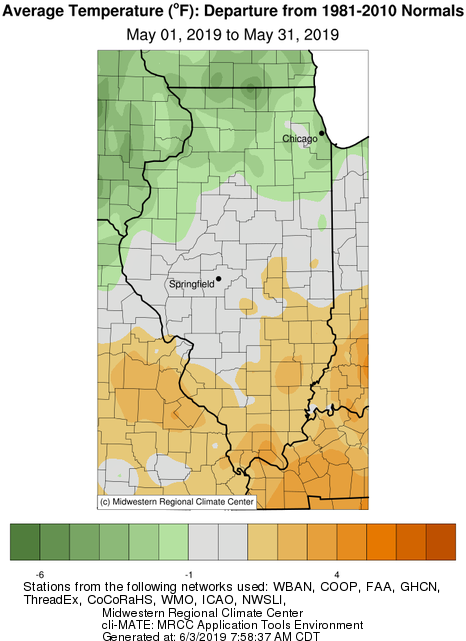
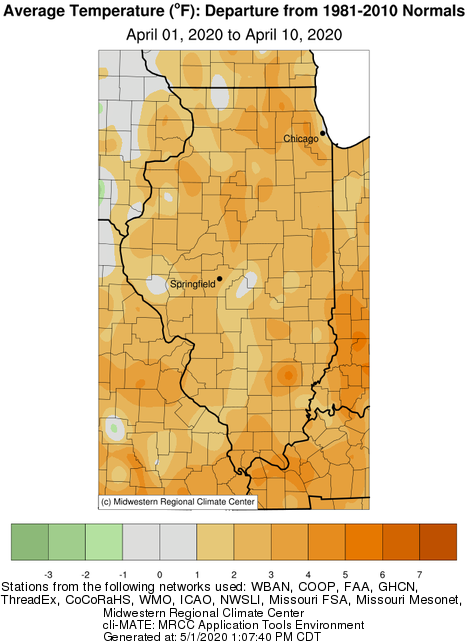
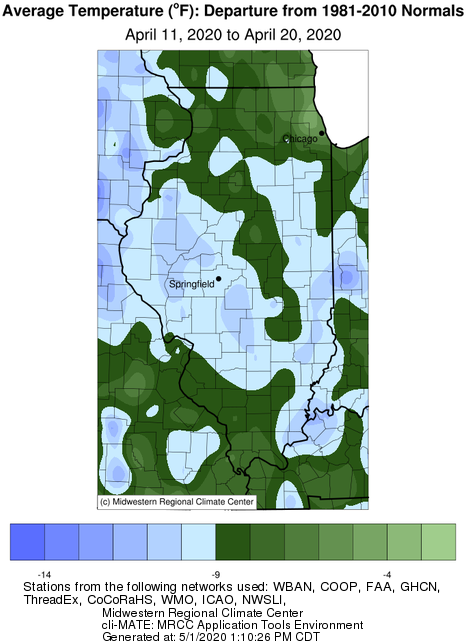
Warm weather spilled over from March into the beginning of April. Average temperatures between April 1 and April 10 ranged from 1 to 6 degrees above the 30-year normal across the state. A strong cold front moved through the region between April 9 and 11, with following unseasonably cold air that quickly decreased temperatures. Average temperatures between April 11 and 20 ranged from 5 to 15 degrees below normal (see maps below).
Many stations across the state recorded daily maximum temperatures in the mid- to high 80s during the first 10 days of April, only to record daily minimum temperatures in the mid- to low 20s in the second 10 days. For example, stations in McHenry and Woodford Counties recorded high temperatures of 82 degrees on April 9 and one week later recorded low temperatures of 20 degrees on April 16. Fourteen stations around the state broke daily April high maximum temperature records and three stations broke daily April high minimum temperature records between April 7 and 12. Subsequently, 20 stations broke the daily April low maximum temperature records and 30 stations broke the April low minimum temperature records between April 13 and 20.
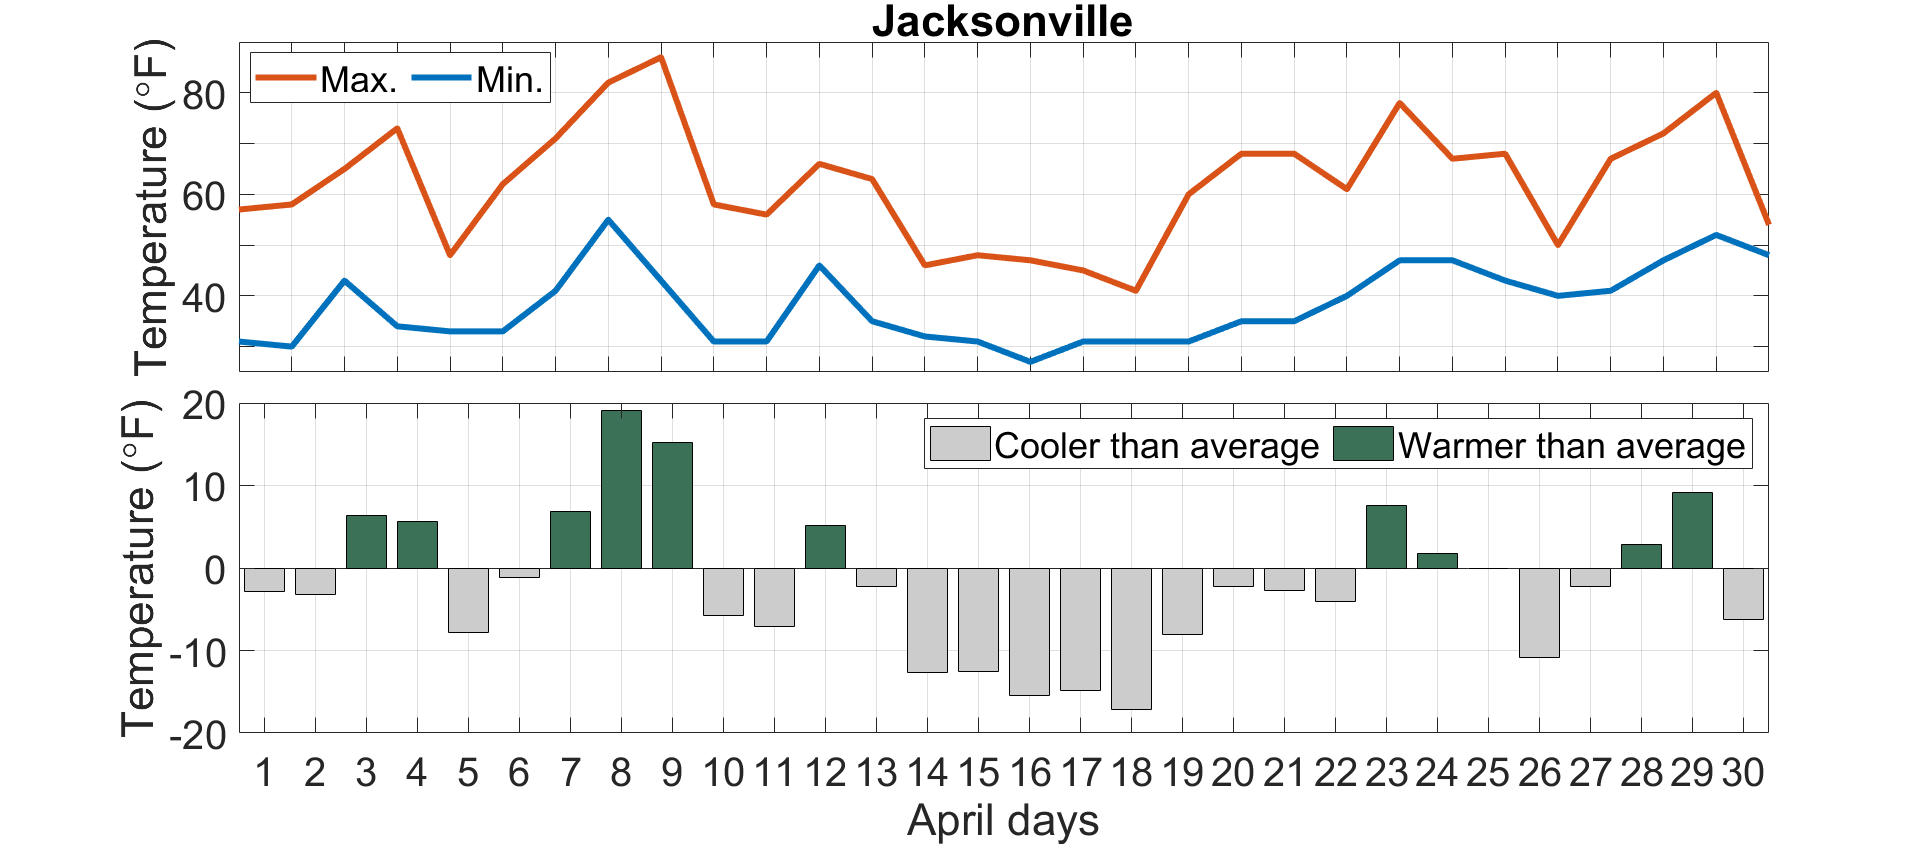
The plots below show daily maximum and minimum temperatures, as well as daily average temperature departures from normal, for April in Jacksonville. The average temperature in Jacksonville on April 8 was nearly 20 degrees above the long-term average, and the average temperature 10 days later on April 18 was nearly 20 degrees below the long-term average.
Overall, April average temperatures ranged from the low 30s in northern Illinois to the mid-50s in southern Illinois. April was cooler than normal across the state. The preliminary statewide average April temperature was 49.2 degrees, 3.4 degrees cooler than normal and the 27th coldest on record back to 1895. April ended the consecutive four-month streak of warmer than normal months going back to December 2019.
Spring Freeze
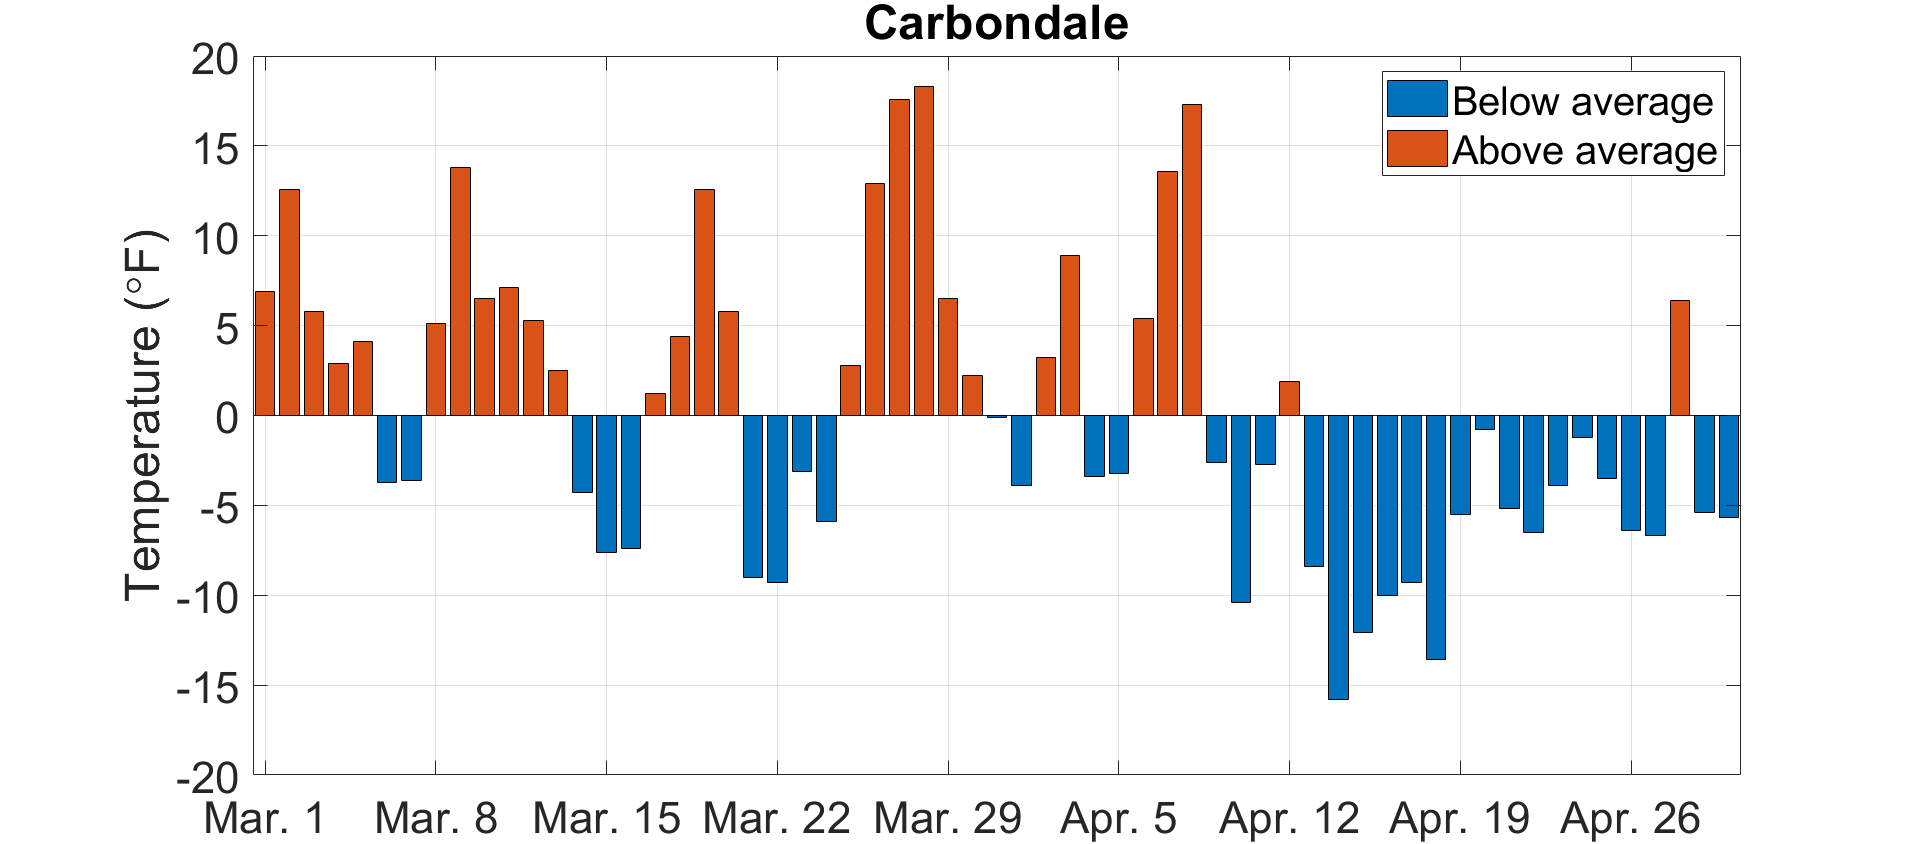
As a result of the strong cold front that moved through the region in mid-April, minimum temperatures dipped below freezing as far south as Pope County. Stations in northwest Illinois recorded minimum temperatures in the teens on April 8. Late-season freeze events in early to mid-April are not uncommon; however, last month’s event followed a prolonged period of well above average temperatures. The plot below shows daily average temperature departures from the 30-year normal from March and April in Carbondale. Between March 1 and April 12, Carbondale experienced twice as many warmer than normal days than cooler than normal days. Furthermore, the minimum temperature in Carbondale last dipped below freezing on March 7 before reaching 30 degrees on April 14.
Flowering trees, shrubs, and tender perennials broke dormancy and began to green in response to prolonged warm conditions throughout March and early April. This increased the vulnerability of Illinois specialty crops such as peaches, strawberries, and asparagus to the late-season freeze. University of Illinois Extension reported some damage to specialty crops in most regions of the state as a result of the freeze event in mid-April. The extent of damage was likely curtailed by successful warming of the sub-freezing temperatures five to seven days prior to the event.
Heavy Late-April Rain
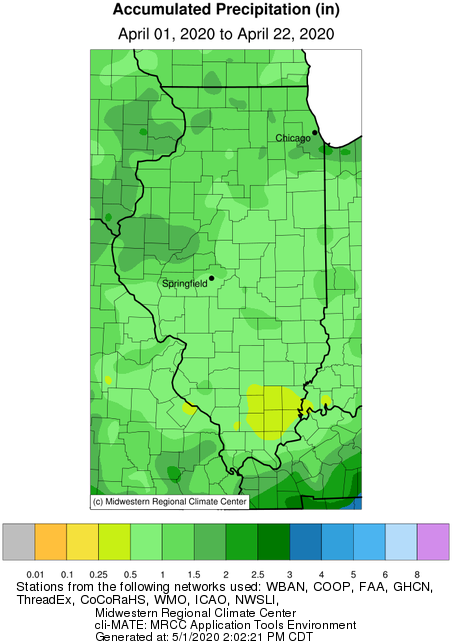
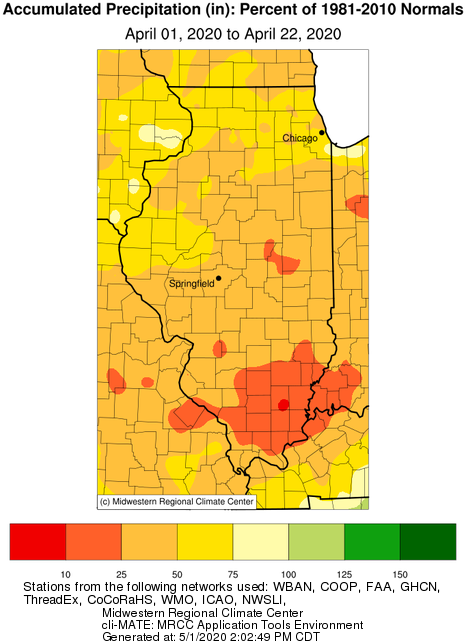
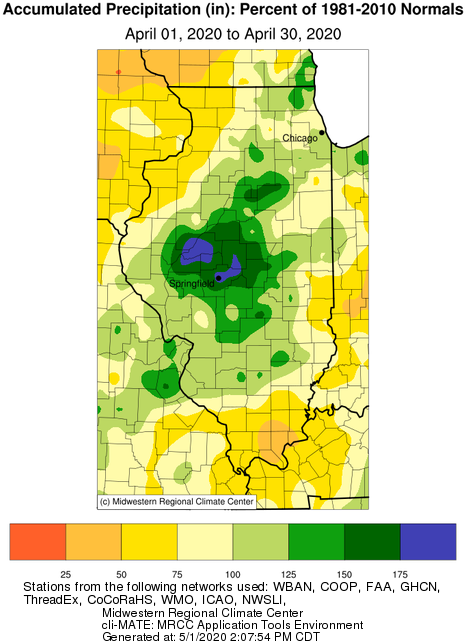
The first two-thirds of last month was somewhat to very dry across the state, with most areas experiencing less than 50 percent of normal precipitation by April 20 (see maps below). The station in Rosiclaire in Hardin County recorded less than one-half an inch of rainfall in the first 22 days in April, putting last month on track for one of the driest Aprils on record. Likewise, areas of east-central Illinois were experiencing a 2-inch precipitation deficit by April 22. The prolonged dry conditions caused soils to dry considerably. Both 4-inch and 8-inch soils at the Illinois Climate Network station in Bondville in Champaign County were at their driest April levels since 2012. The dryness was quite a contrast to April 2019 and was beneficial for farmers to make planting progress.
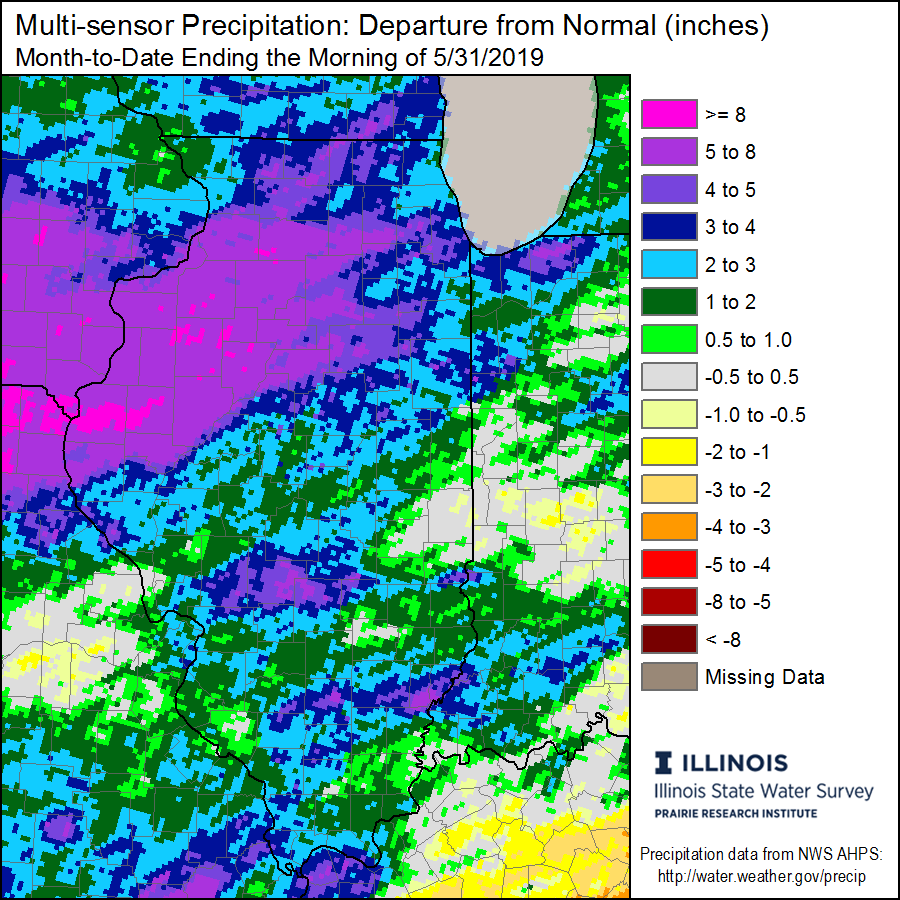
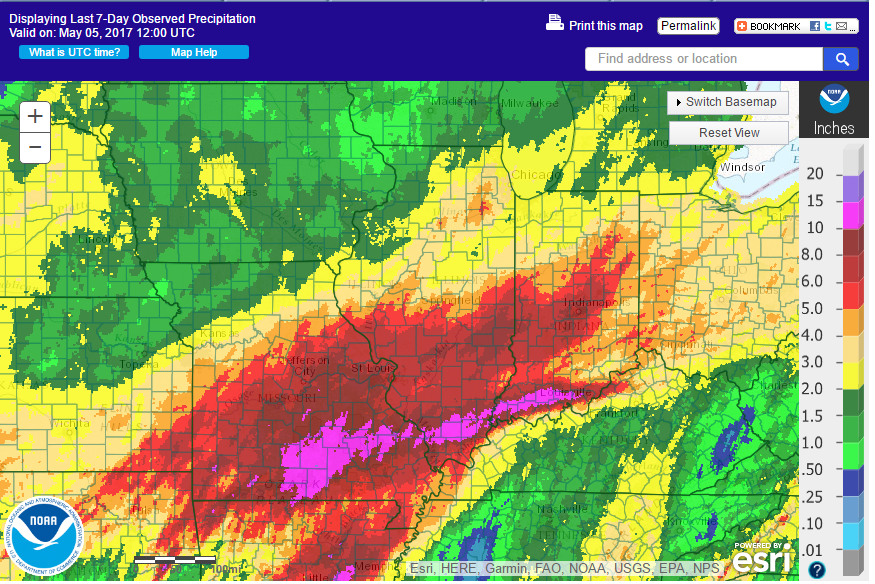
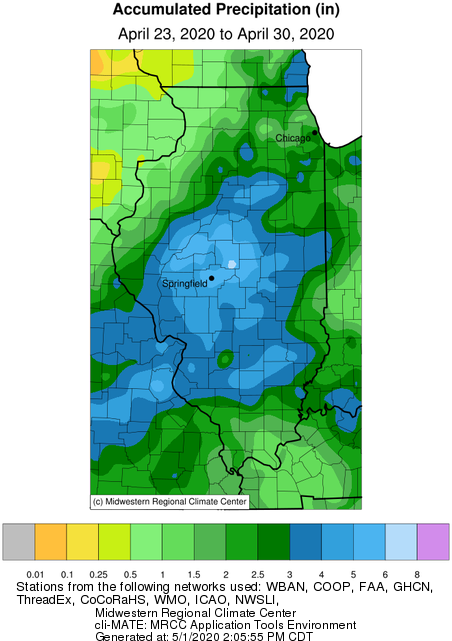
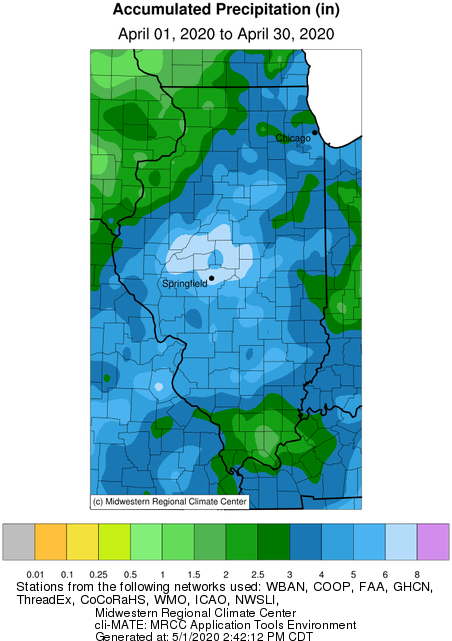
The dry weather was brought to an abrupt end by a series of storms that tracked across Illinois over the last week in April, generating very heavy rainfall and widespread 2- to 4-inch accumulations along the Interstate 55 corridor between the St. Louis Metro East and Chicagoland (see map below). The heaviest rainfall was in central Illinois between Mason and McLean Counties.
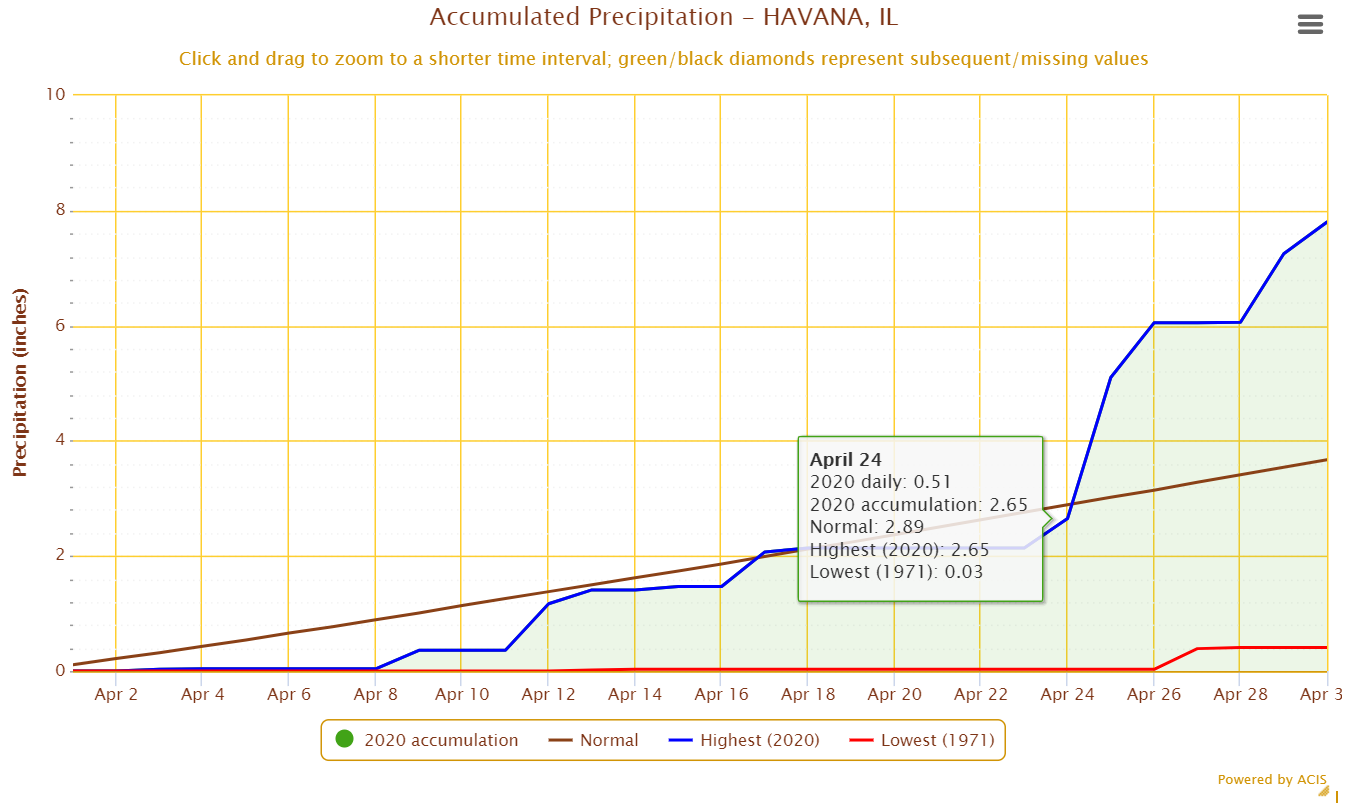
The Bloomington Waterworks station recorded 4.99 inches on April 26, which was the largest single-day April precipitation event on record at that station going back to 1949. The wettest point in the state last month was Havana in Mason County. The Havana station recorded just over 2 inches of precipitation in the first 22 days of April and was experiencing nearly a three-quarter-inch precipitation deficit at that time. Havana received nearly 6 inches of precipitation in the following seven days and ended the month with an all-time April record-breaking precipitation total of 7.8 inches (see plot below).
Heavy precipitation in late April caused flash flooding across central and northeastern Illinois as well as inundated fields and resultant planting delays. Additionally, many gauges along the Illinois River, Des Plaines River, and Mississippi River south of Hardin were pushed into the flood stage.
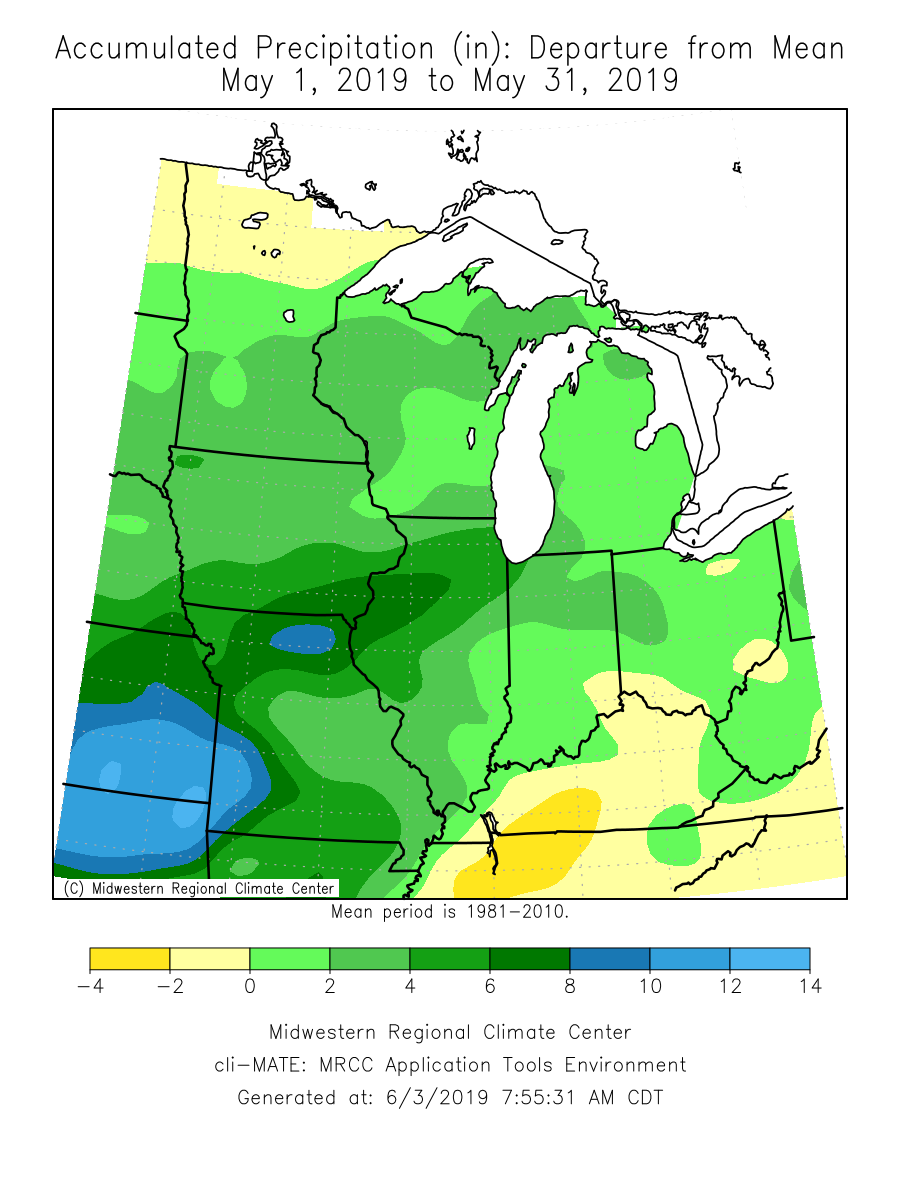
Total March precipitation ranged from just under 8 inches in central Illinois to less than 2 inches in southeastern and northwestern Illinois. These totals ranged from over 175 percent of average April precipitation in central to less than 50 percent of average April precipitation in southern Illinois.
Overall, the preliminary statewide average April precipitation was 4.36 inches, 0.58 inches above than the 30-year normal and the 43rd wettest on record. The April average does not reflect the 5- to 6-inch differences in precipitation between central and northern/southern Illinois.
Most of the northern half of the state experienced measurable snowfall last month. April totals ranged from over 8 inches in north central Illinois to just over one-tenth of an inch along Interstate 72. A single storm in mid-April produced widespread 24-hour snowfall totals between 1 and 3 inches in central and northern Illinois, with a few much larger isolated totals. Areas of Warren, Henry, Knox, and Mercer Counties received more than 6 inches of snowfall in a single day, including the third and fifth highest single day April snowfall totals in Kewanee and Galesburg, respectively. This event was also the latest 5-inch or larger snowfall event on record at nearly a dozen stations around the state.
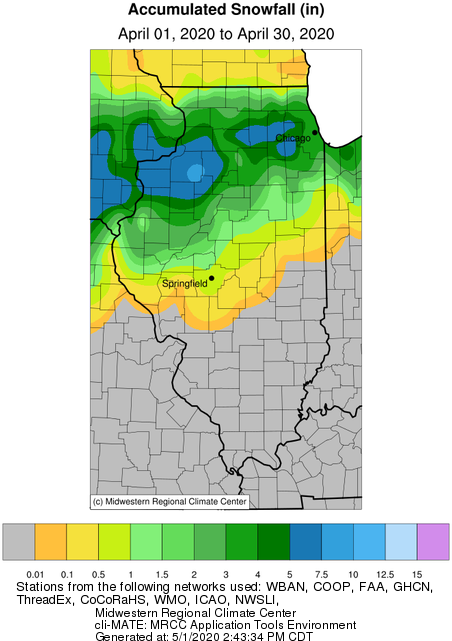
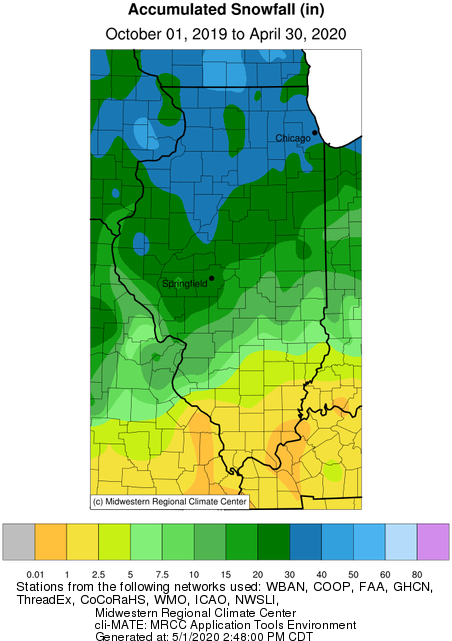
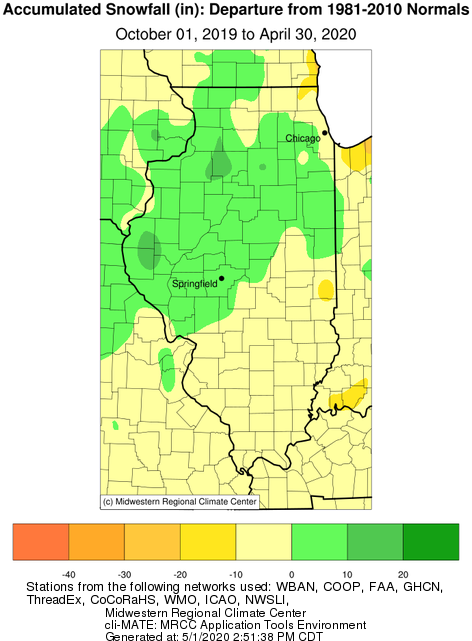
With April on the books, the total 2019–2020 season snowfall ranged from over 50 inches in far northern Illinois to less than 1 inch in southeastern Illinois. Most areas of the state north of Interstate 70 experienced a snowier than average season (see maps below).
Outlooks
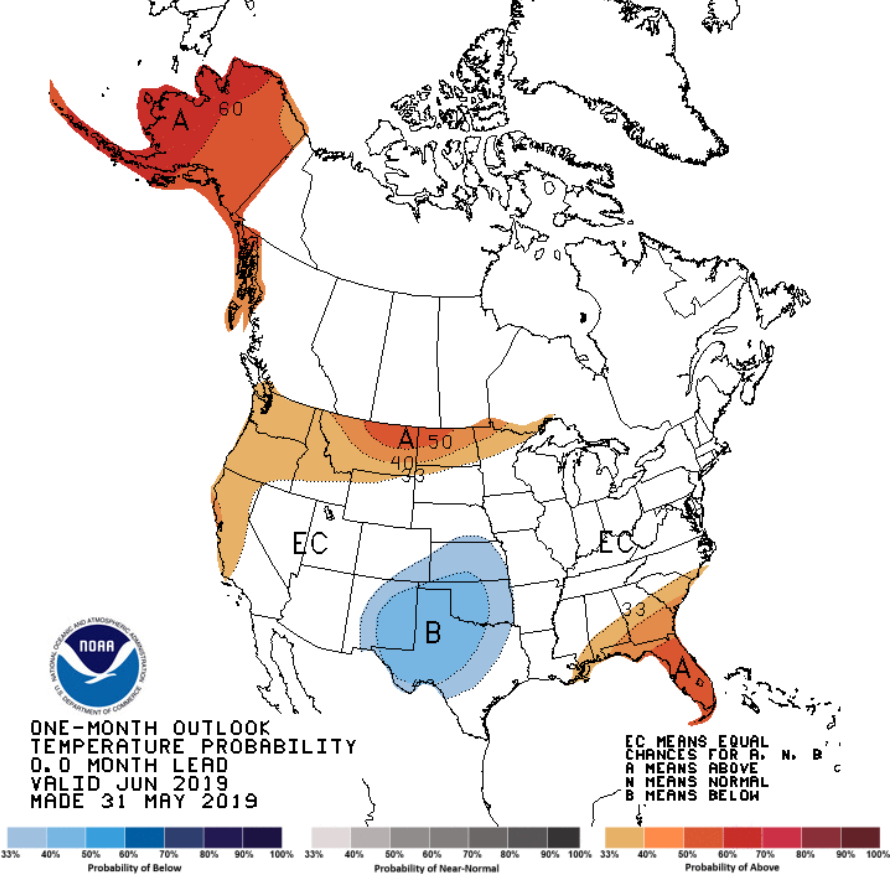
Short-term 8–14-day outlooks from the NOAA Climate Prediction Center show strongly elevated odds of below normal temperatures and slightly elevated odds of above normal precipitation across the state.
Longer-term 30-day outlooks are similar to the 8–14-day outlooks, with continued, albeit weaker, chances of cooler and drier conditions, especially for the northeastern half of the state for May.