The preliminary statewide average February temperature was 27.2 degrees, 3.0 degrees below the 1991–2020 average and tied for 42nd coldest on record going back to 1895. The preliminary statewide average total February precipitation was 3.41 inches, 1.48 inches above the 1991–2020 average and the 9th wettest on record statewide.
Data are provisional and may change slightly over time
Variable, But Cold February
Climatologically, February is the second coldest month statewide after January. Much like January, February temperatures also tend to be quite variable day to day.
Figure 1 shows daily temperature departures from normal in Chicago over the course of the climatological winter (December–February). Following a very warm December–the fourth warmest on record in Chicago–temperatures since the beginning of the new year have been variable, but mainly colder than normal. About two-thirds of January and February days were colder than normal in Chicago.
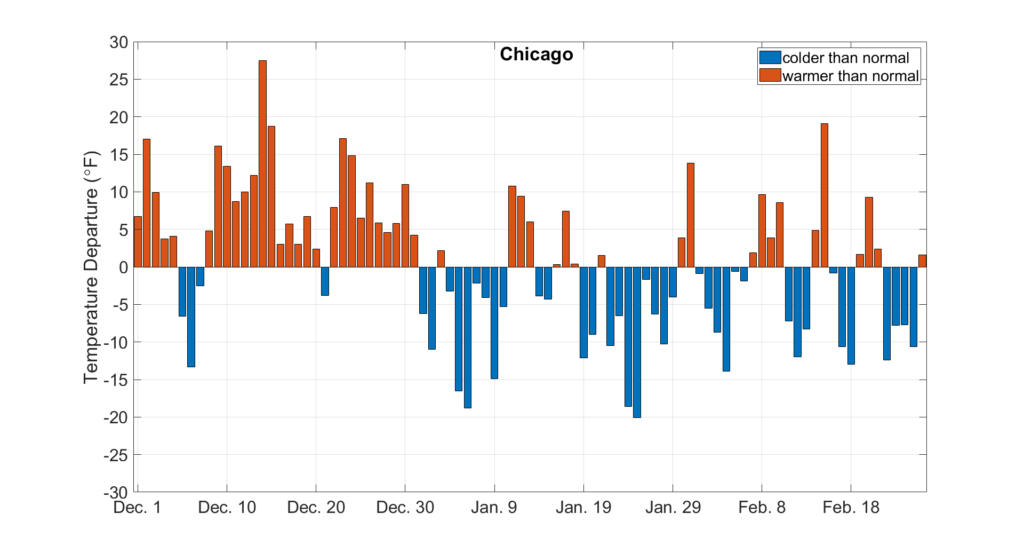
Figure 1. Daily February average temperature departures in Chicago.
February average temperatures ranged from the low 20s in northern and north-central Illinois to the high 30s in far southern Illinois, between 1 and 6 degrees below the 1991–2020 normal. Several stations saw daily high temperatures in the high 60s in mid-February, including 67 degrees in Alexander and Pope Counties. Meanwhile, stations in northern and central Illinois saw nighttime low temperatures well below 0, including -9 degrees in Knox County and -8 degrees in Woodford County.
Altogether, daily high maximum temperature records were broken at seven stations in February, and daily high minimum temperature records were broken at five stations. Despite the persistently below normal temperatures last month, no daily low minimum or low maximum temperature records were broken.
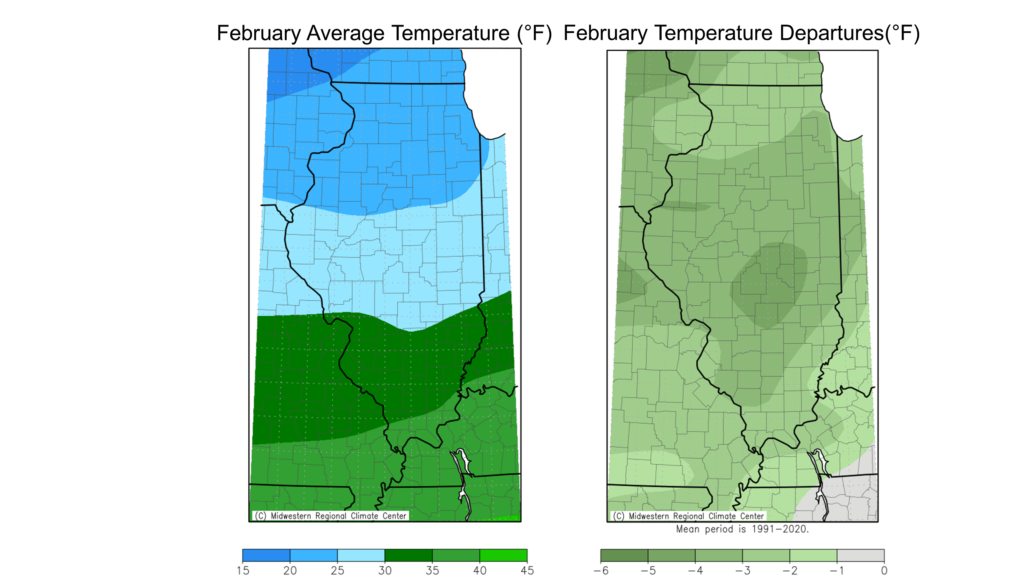
Figure 2. Maps of (left) February average temperature and (right) February average temperature departures from normal.
Overall, the preliminary statewide average February temperature was 27.2 degrees, 3.0 degrees below the 1991–2020 average and tied for the 42nd coldest on record going back to 1895.
Tale of Two Winters
February wrapped up a climatological winter season that, even more than other winters, cannot be summarized by seasonal averages and totals alone. As Figure 3 shows, winter started with extremely mild weather in December statewide, followed by a cold but dry January. February was really the only month that brought both winter-like temperatures and the active weather we expect from Illinois winter.
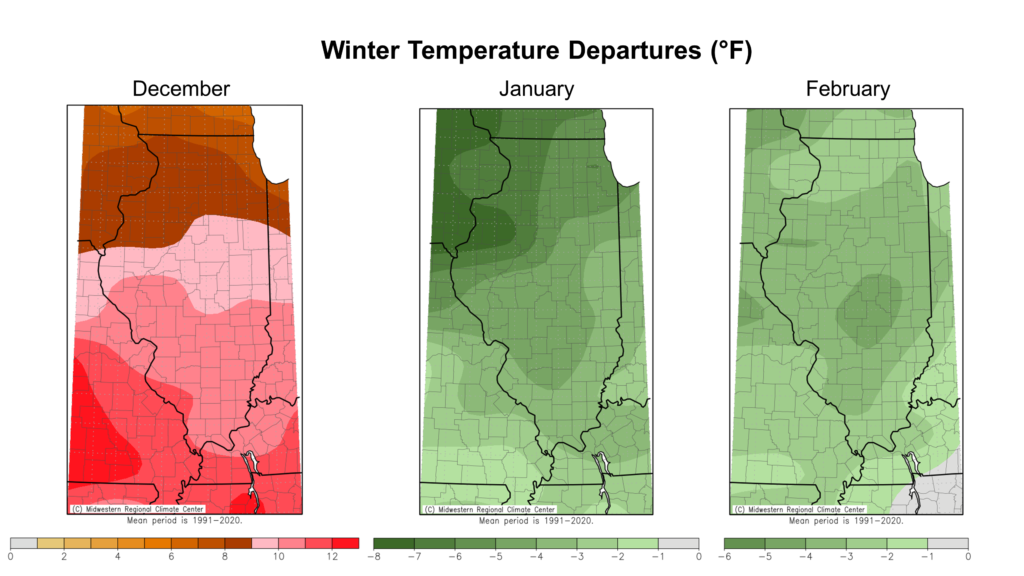
Figure 3. Winter average temperature departures from normal by month. Maps show (left) December, (middle) January, and (right) February.
The 2021-2022 climatological winter average temperatures ranged from the low 20s in northern Illinois to the high 30s in southern Illinois, within 1 degree of normal statewide (Figure 4). Overall, the preliminary statewide average winter temperature was 29.5 degrees, 1.3 degrees above the 1991–2020 normal and tied for the 41st warmest on record.
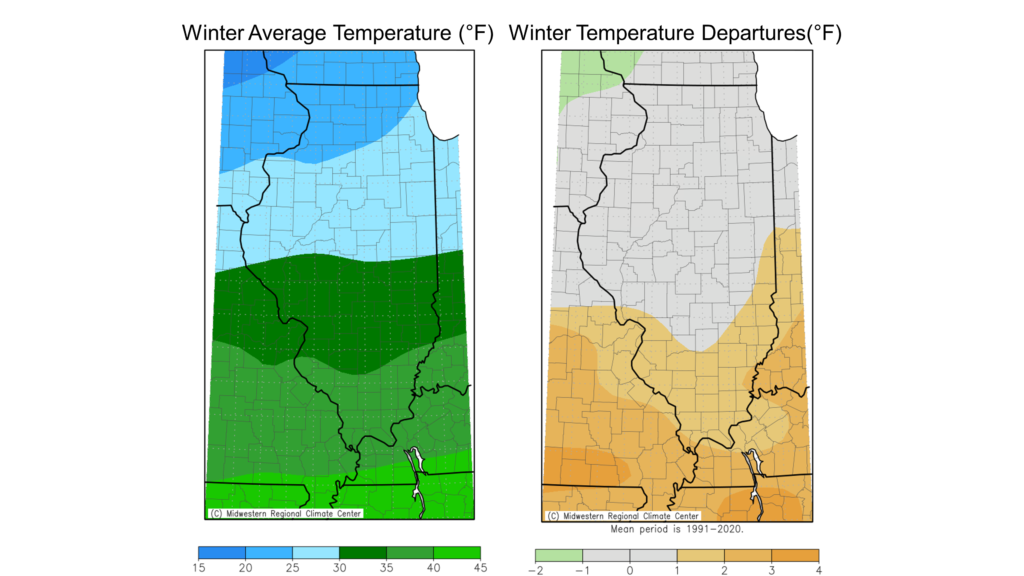
Figure 4. Maps of (left) winter average temperature and (right) winter average temperature departures from normal.
Wet February
After a very dry January, February brought more active weather to most of the state. Total February precipitation ranged from less than 1 inch in far northwest Illinois to over 9 inches in parts of southern Illinois. Last month was about 1 inch drier than normal in northwest Illinois, 1 to 2 inches wetter than normal in central Illinois, and 4 to 7 inches wetter than normal in southern Illinois. Two observers near Cobden in Union County measured more than 9 inches of rain in February, one of the top 20 highest February totals on record statewide. Meanwhile, several stations in northwest Illinois recorded less than three-quarters of an inch of precipitation for February, including 0.63 inches in Freeport and 0.57 inches in Stockton. It was a top 10 driest February on record in Dubuque, Iowa.
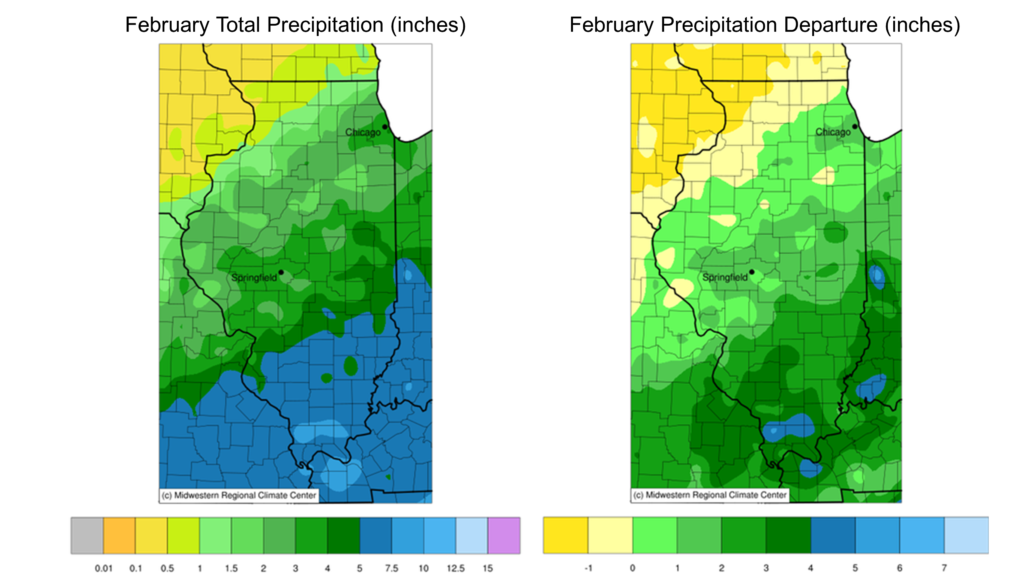
Figure 5. February total precipitation (left) and February precipitation departure from normal (right).
Unfortunately, February precipitation patterns reinforced a dry north-to-wet south pattern in Illinois, present since the fall. The heavy February rain and snow melt in southern Illinois has caused several spots along the Wabash and Ohio Rivers and tributaries to reach or exceed moderate flood stage. Excessively wet soils in southern Illinois also raise concerns of continued flooding risks and possible fieldwork issues as we approach the start of the growing season. Concurrently, the dry winter has not helped alleviate drought conditions across northern Illinois, as the U.S. Drought Monitor expanded or continued moderate to severe drought from Lake County to Rock Island County.
The preliminary statewide average total February precipitation was 3.41 inches, 1.48 inches above the 1991–2020 average and the 9th wettest on record statewide.
The climatological winter total precipitation ranged from just around 3 inches in far northwest Illinois to nearly 20 inches in southern Illinois. Winter was between 2 and 3 inches drier than normal in western and northwest Illinois, within 1 inch of normal in central Illinois, and 5 to 7 inches wetter than normal in far southern Illinois. The preliminary statewide total winter precipitation was 7.26 inches, 0.72 inches above the 1991–2020 normal, and the 41st wettest on record.
Finally, Some Snow!
After a very slow start to winter, much of the state finally saw considerable snowfall in February. A series of winter storms in early to mid-February brought several rounds of moderate to heavy snowfall, with the highest totals along and around the Interstate 55 corridor from St. Louis to Chicago.
Overall, February total snowfall ranged from less than 4 inches in southern and far northwest Illinois to over 20 inches in parts of central and northeast Illinois. February snowfall was 2 to 4 inches below normal in drought-stricken northwest Illinois, within 2 inches of normal in northeast and southern Illinois, and 6 to 12 inches above normal from the St. Louis Metro East through central Illinois into the southern Chicagoland area.
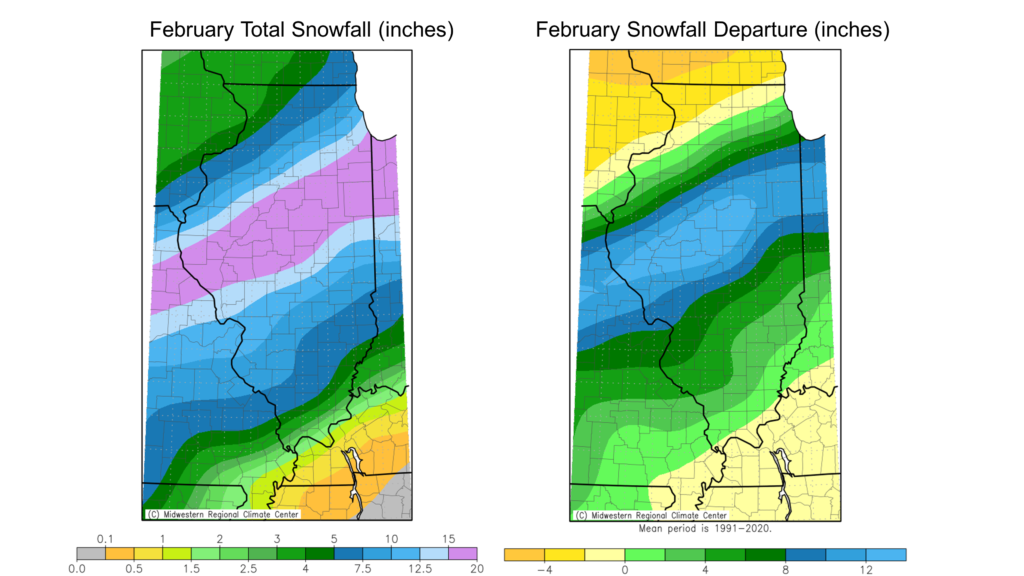
Heavy February snowfall broke daily snowfall records at 53 stations in Illinois, and the 8.33 inches observed on February 3 in Jerseyville broke their all-time February daily snowfall record. Some of the most impressive single-day snowfall totals from last month include 14 inches in Woodford County on February 2, 11.8 inches in Cook County on February 2, and 10.5 inches in Vermilion County on February 3.
The heavy snowfall caused significant transportation impacts throughout February, including closures along Interstates 38, 55, 57, and 74 in central and north-central Illinois due to poor road conditions and traffic accidents. The mid-February winter storm caused a 100+ vehicle pileup on Interstate 39 north of Bloomington-Normal (Figure 7), shutting down the Interstate for several days.
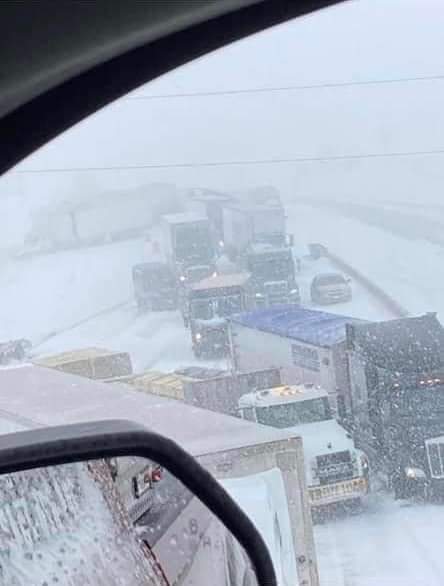
Figure 7. Multiple-vehicle pileup along Interstate-39 north of Bloomington-Normal, taken on February 17. Photo Source: Illinois Department of Transportation.
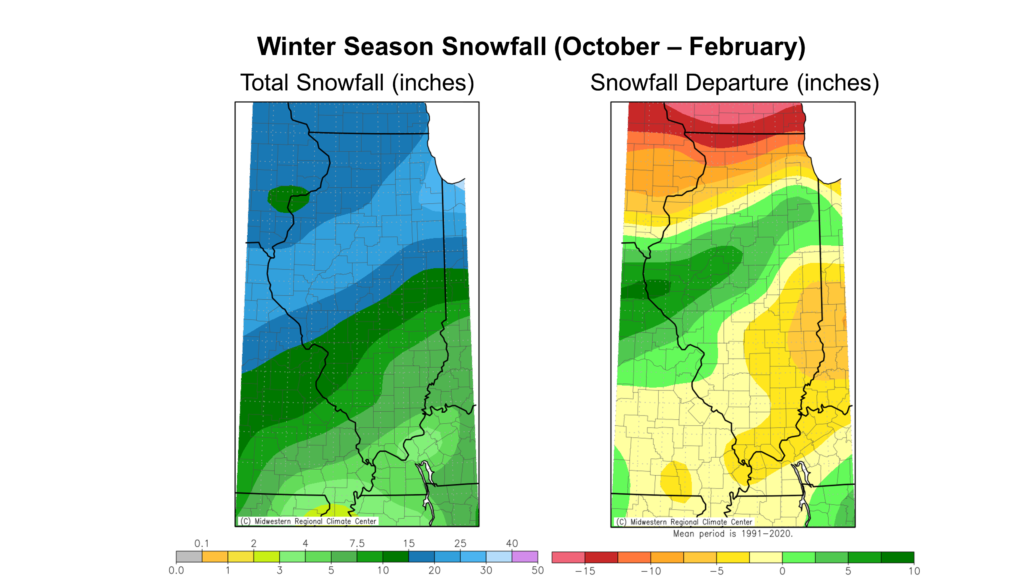
The technical climatological winter season is from December through February; however, as we all know, the snowfall season can begin much earlier and end much later. A good estimate of the full winter snowfall season in Illinois is from October 1 through May 1. Figure 8 shows the winter season to date total snowfall and departures from normal. Since October 1, snowfall totals have ranged from just under 5 inches in southern Illinois to over 20 inches in northeast Illinois.
The area of the highest February snowfall from the northern edge of the St. Louis Metro East area to the southern edge of Chicagoland has been 1 to 10 inches snowier than normal since October 1, while snowfall in much of the rest of the state has been 2 to 7 inches below normal. The season total deficits are highest north of Interstate 80, with much of northern Illinois having 10 to 15 inches less snow than normal by the end of February.
March & Spring Outlooks
March is a celebratory month in many ways, but one of the most significant is the start of climatological spring. The most recent March outlooks from the Climate Prediction Center are leaning toward a warmer than normal start to spring and show strongly elevated odds of a wetter than normal March (Figure 9).
This is good news for parts of northern Illinois that have not had enough precipitation in winter to make up for drought and deficits in summer and fall. However, the news of a potentially wetter than normal start to spring is less welcome in southern Illinois. A wet start to an already typically wet season increases the risk of excessively wet soil issues and flooding in southern Illinois this spring.
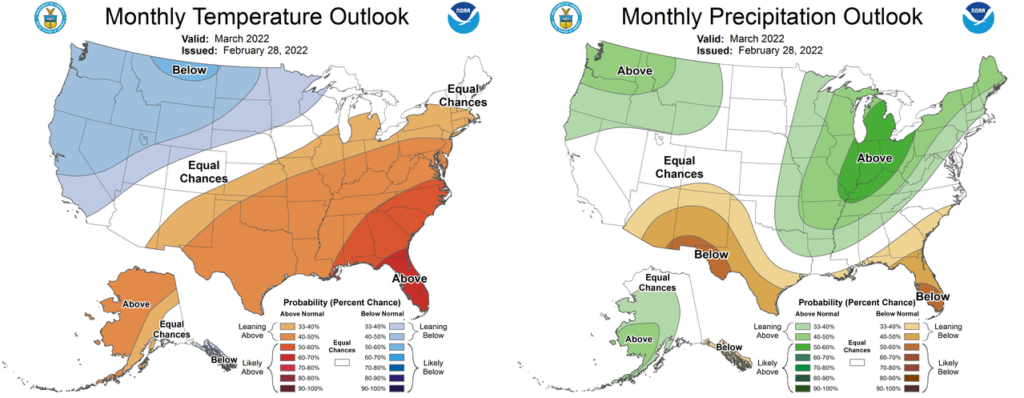
Figure 8. Climate Prediction Center (left) temperature and (right) precipitation outlooks for March.
The spring seasonal outlooks (March–May) are very similar to those for March, leaning toward warmer and wetter weather for most of the state.
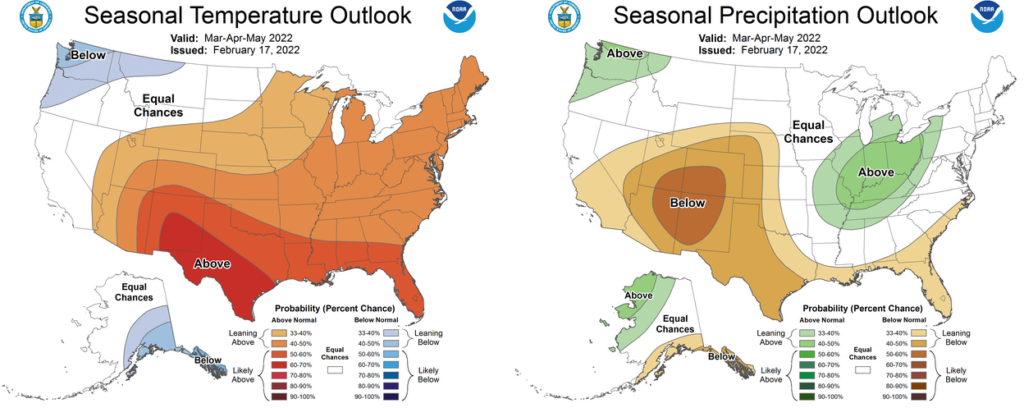
Figure 9. Climate Prediction Center (left) temperature and (right) precipitation outlooks for March through May.

