A typical February ends an otherwise atypical winter

February was slightly warmer and wetter than average across Illinois, bringing an end to a very warm climatological winter season. The preliminary statewide average February temperature was 31.2 degrees, 0.30 degrees above the 30-year normal and tied for 42nd warmest on record. Preliminary statewide average total precipitation for February was 2.13 inches, 0.07 inches wetter than the 30-year normal and tied for 46th wettest on record.

Data are provisional and may change slightly over time

Mostly Warm, Briefly Cold in February

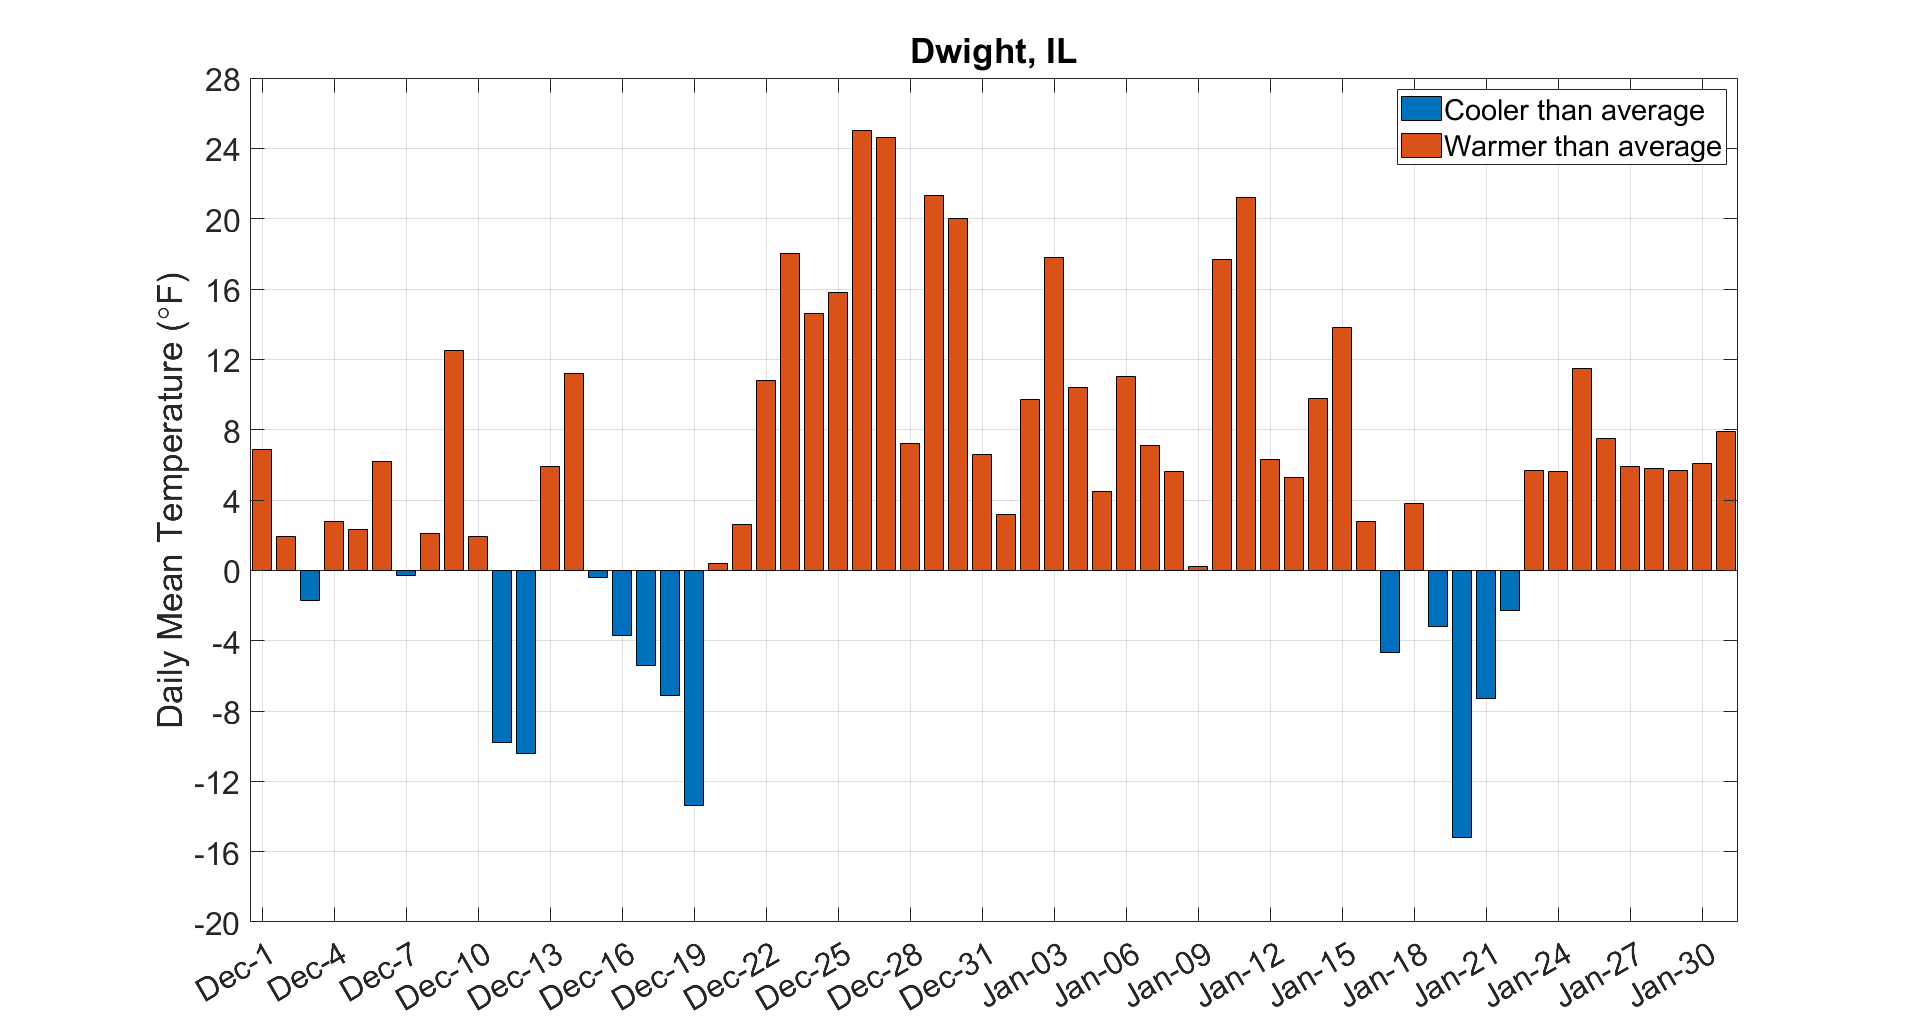
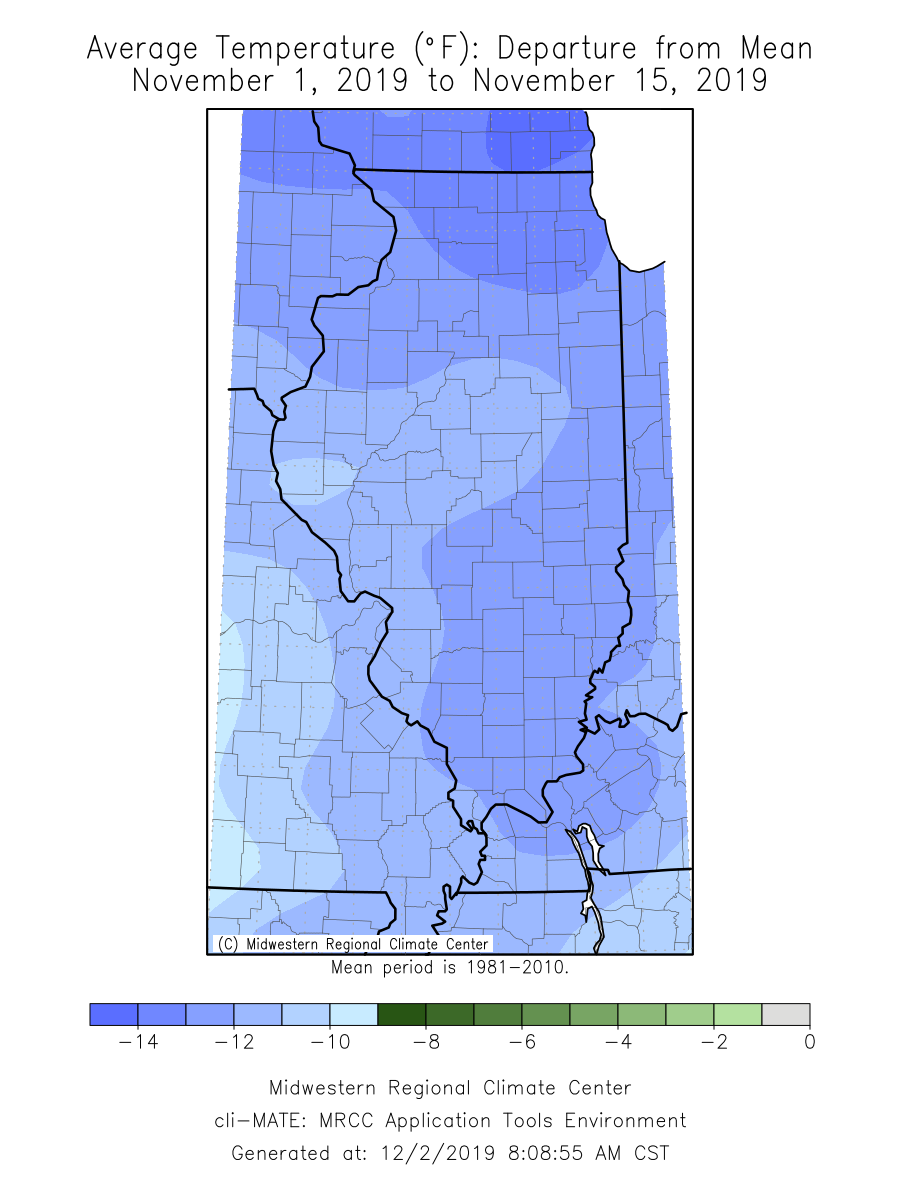
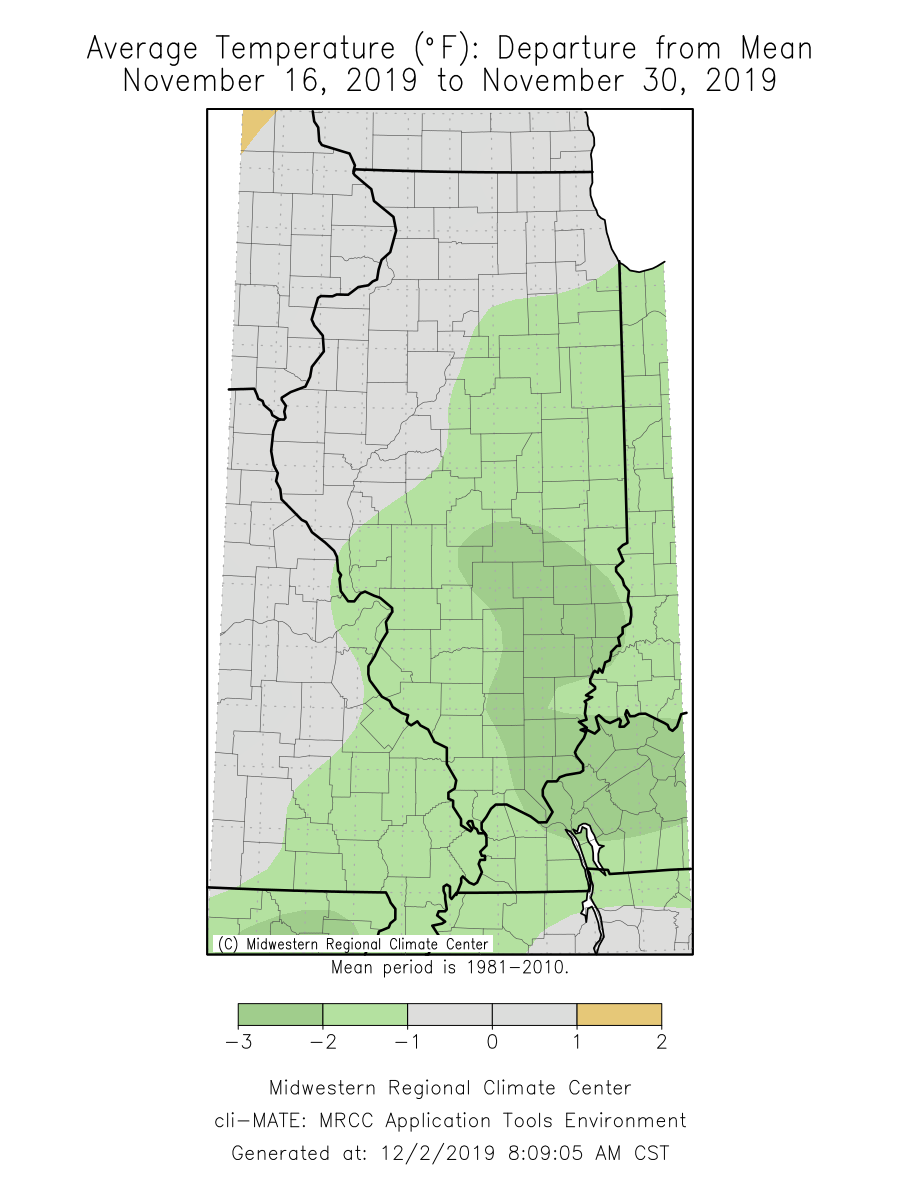
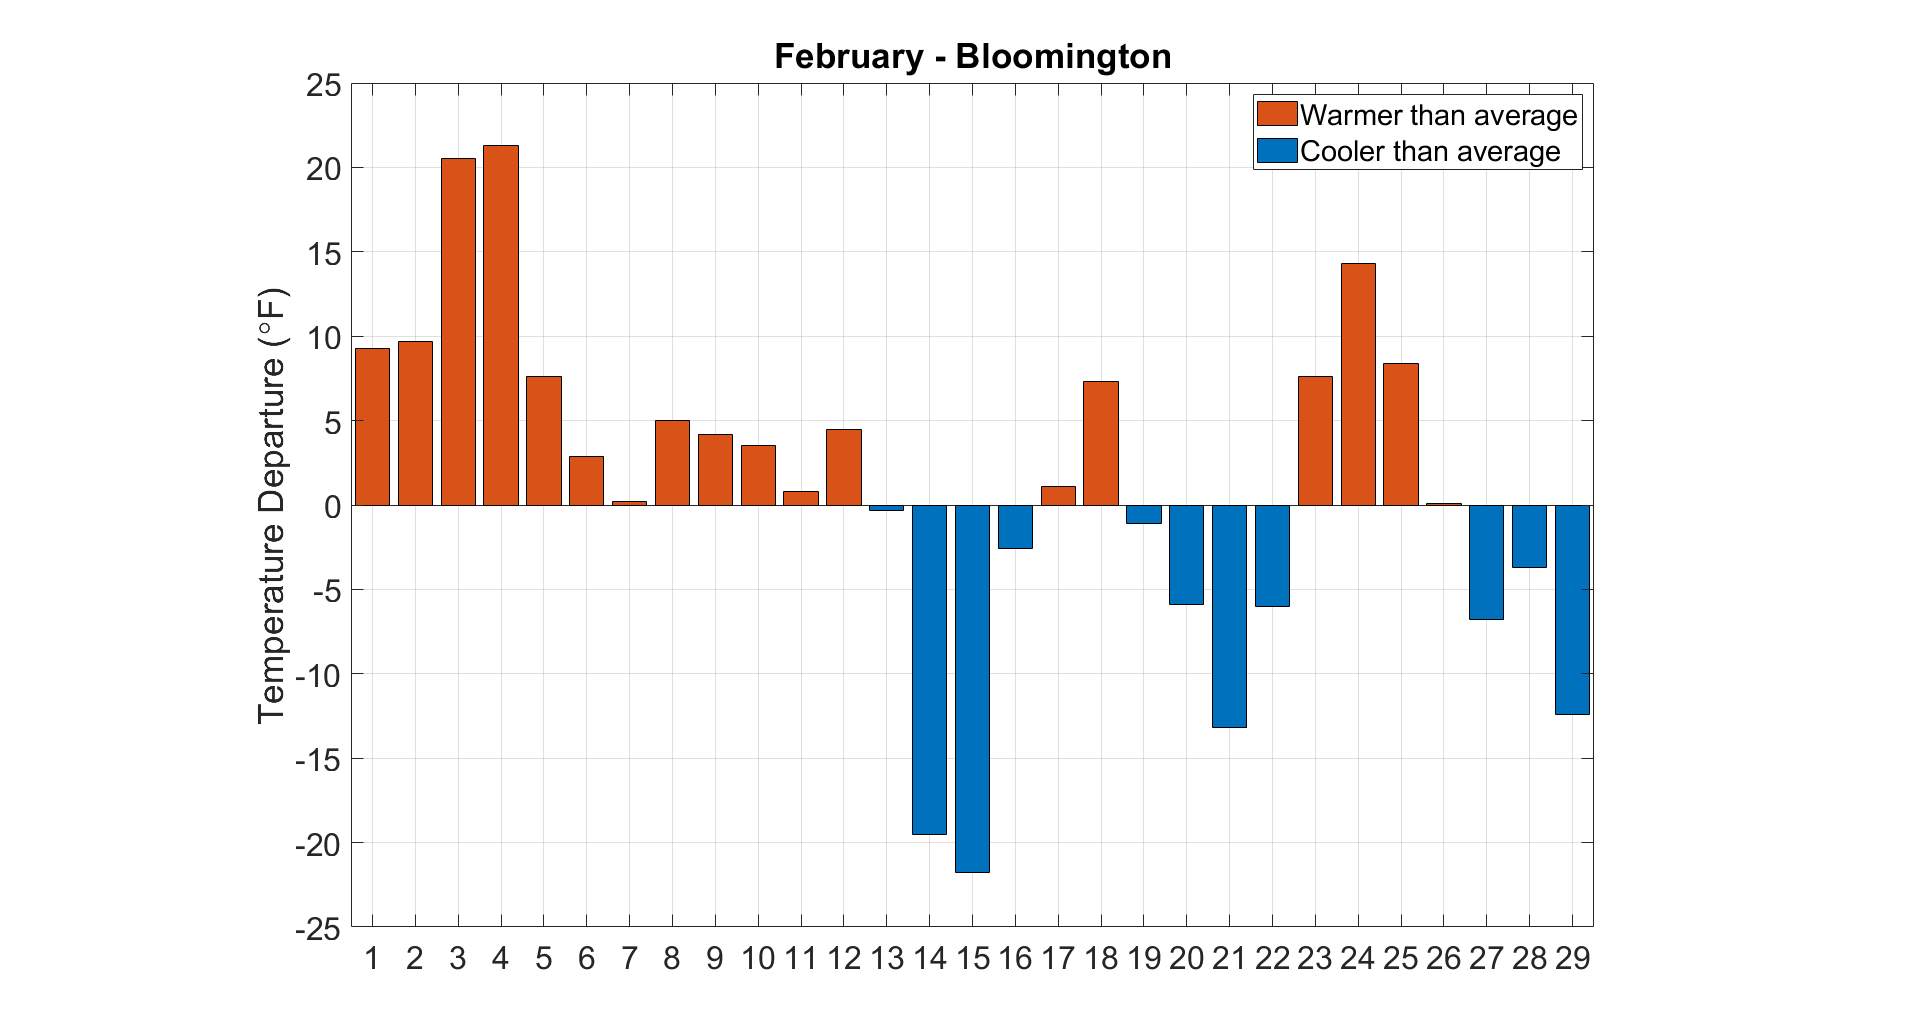
The first two months of the climatological winter season were much warmer than average, with very few cold air incursions. As the temperature plot from Bloomington shows (below), February started consistently warmer than average, but multiple cold air incursions in the latter half of the month led to an overall near-normal temperature month.

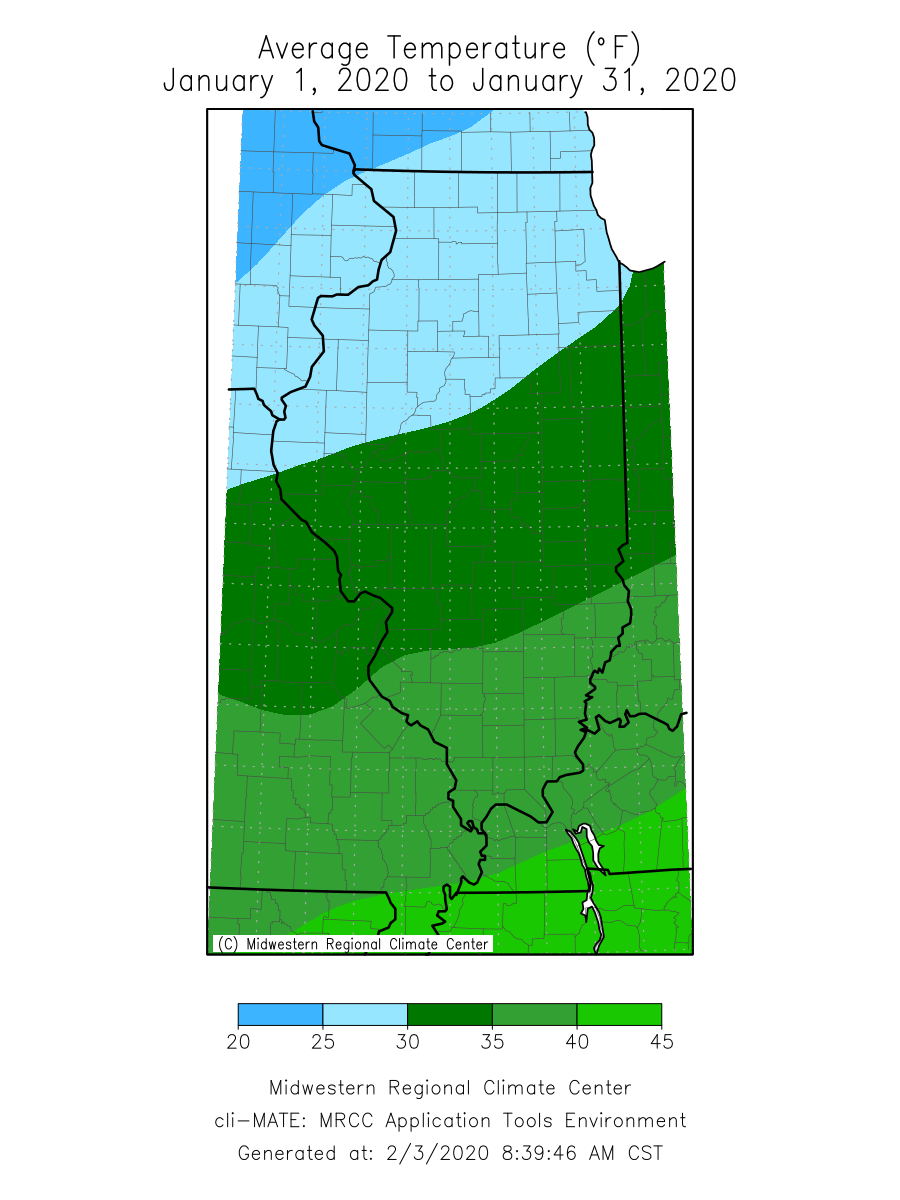
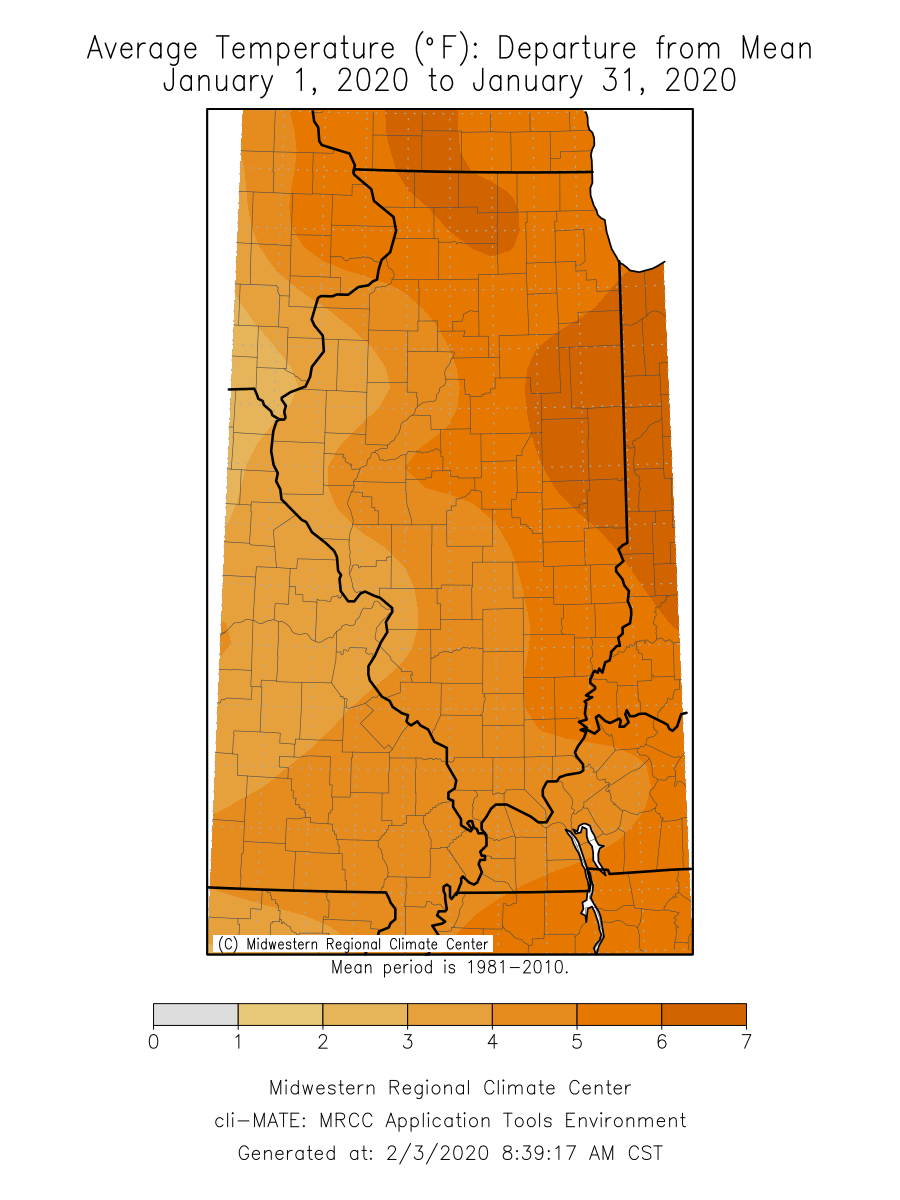
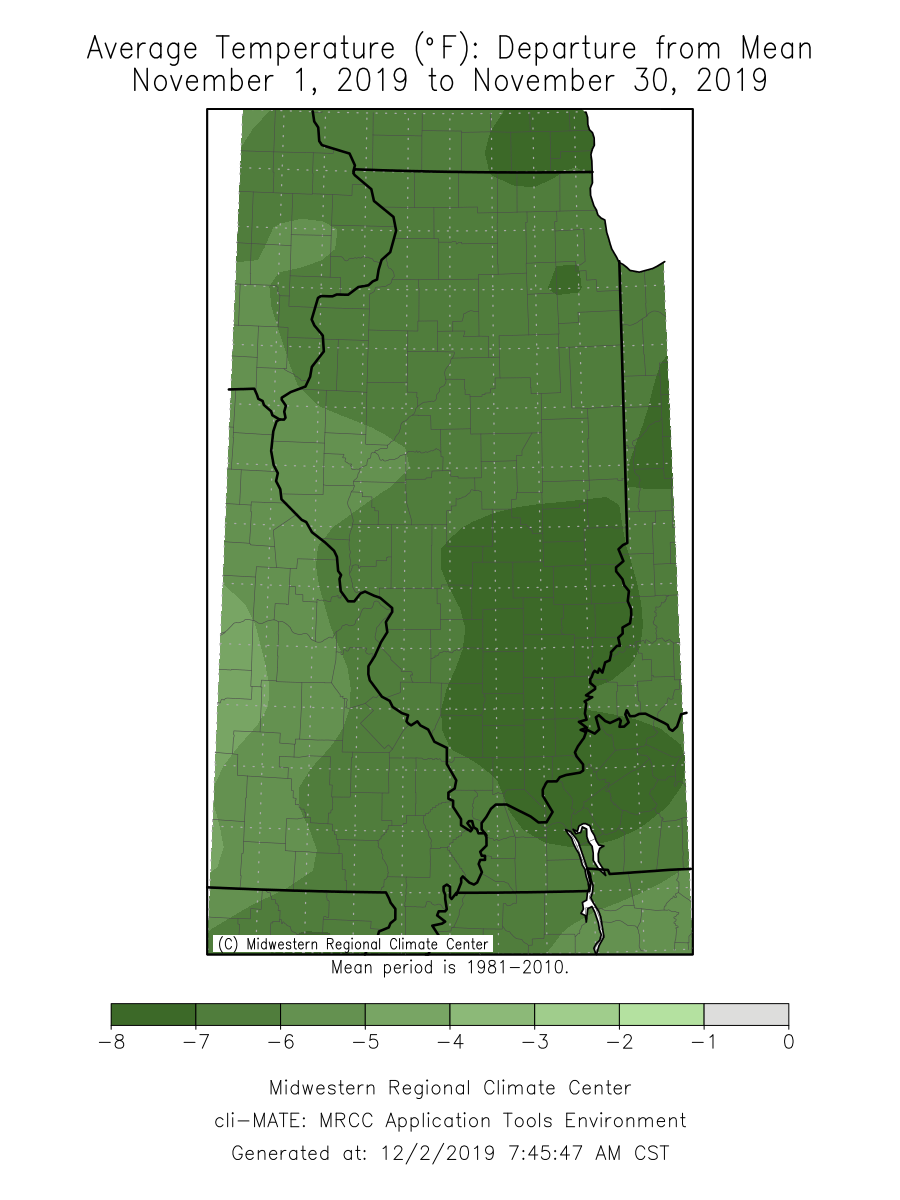
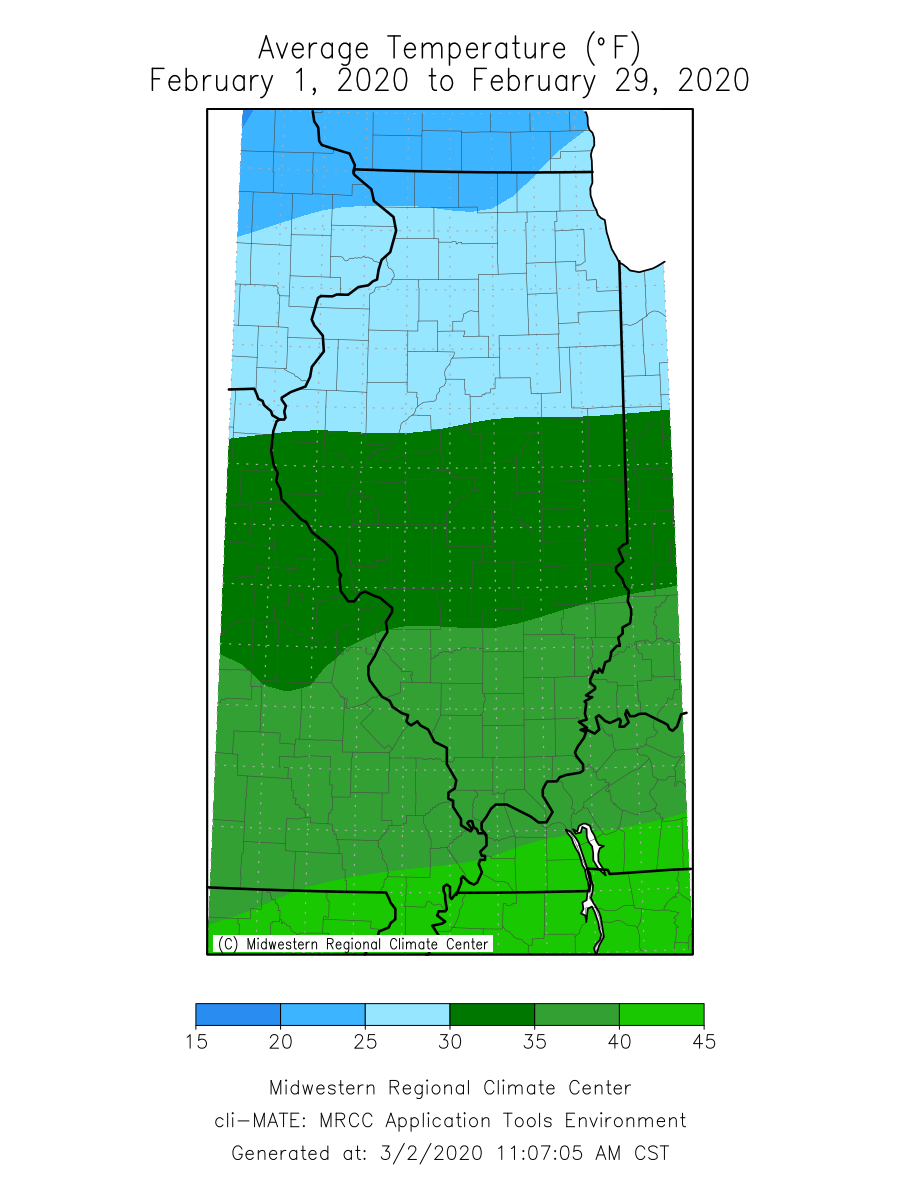
Average temperatures in February ranged from the high teens in northwestern Illinois to the high 30s in southern Illinois. Average temperatures ranged within a degree of the long-term average for all but a southeast sliver of the state. The statewide average February temperature was 31.2 degrees, which is 0.30 degrees above the 30-year normal and tied for 42nd warmest on record.

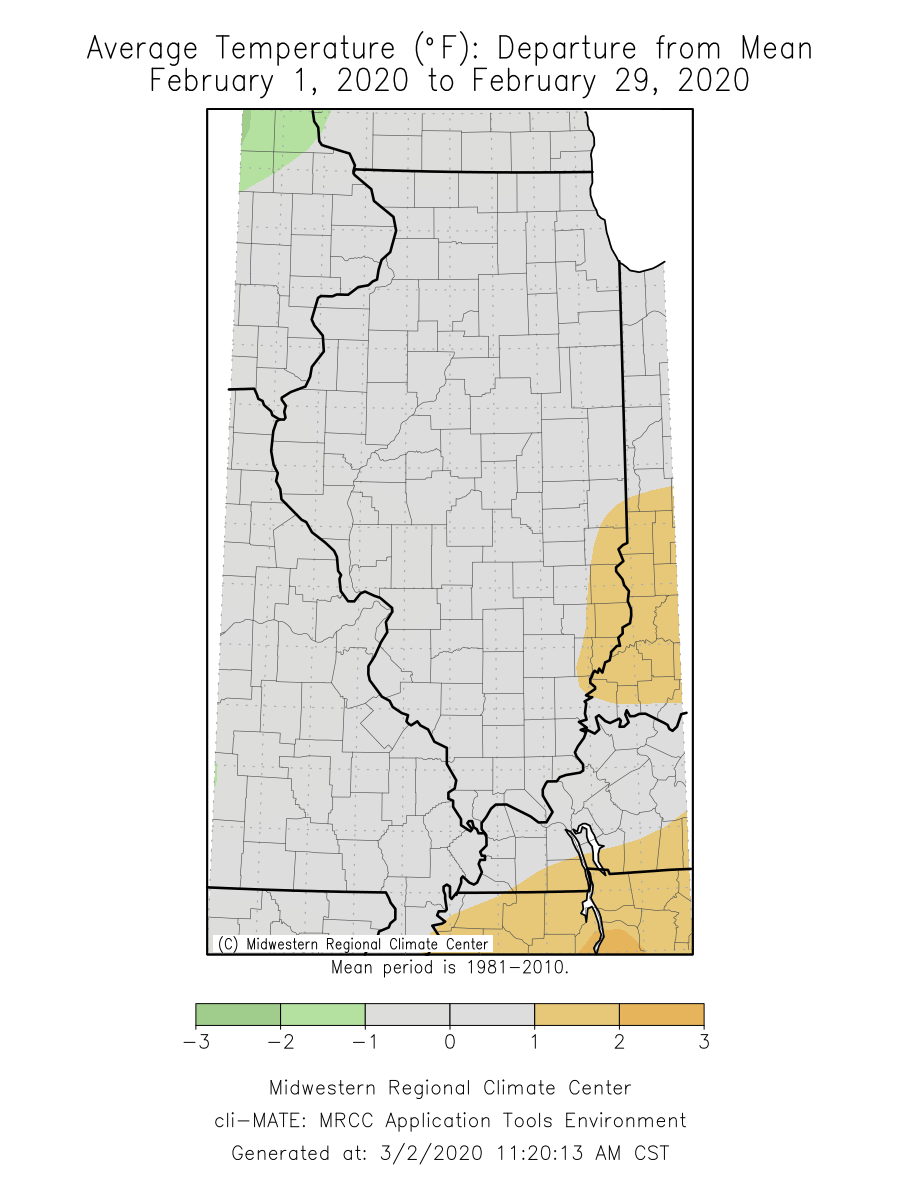
The warm weather that started the month resulted in 115 daily high maximum temperature records and 12 daily high minimum records being broken across the state. One truly incredible departure was a 70 degree high temperature in Charleston in Coles County on Feb. 3. This was nearly twice the long-term average daily high temperature of 38 degrees for that calendar day in Charleston and 5 degrees above the previous record. Eleven days later the Charleston station broke its daily low maximum temperature, reaching only 15 degrees on Valentine’s Day. In total, cold air incursions in February resulted in 23 daily low maximum temperature records and 34 daily low minimum temperature records being broken, most of which were recorded on Valentine’s Day.

The highest temperature recorded in the state in February was 72 degrees in Effingham County, while the lowest temperature was -18 degrees in Jo Daviess County.

An End to a Very Warm Winter Season

February brought an end to climatological winter, which will be best known for persistently warmer than average weather. The preliminary December to February statewide average temperature was 32.6 degrees, which would result in this being the 12th warmest climatological winter season on record in Illinois.

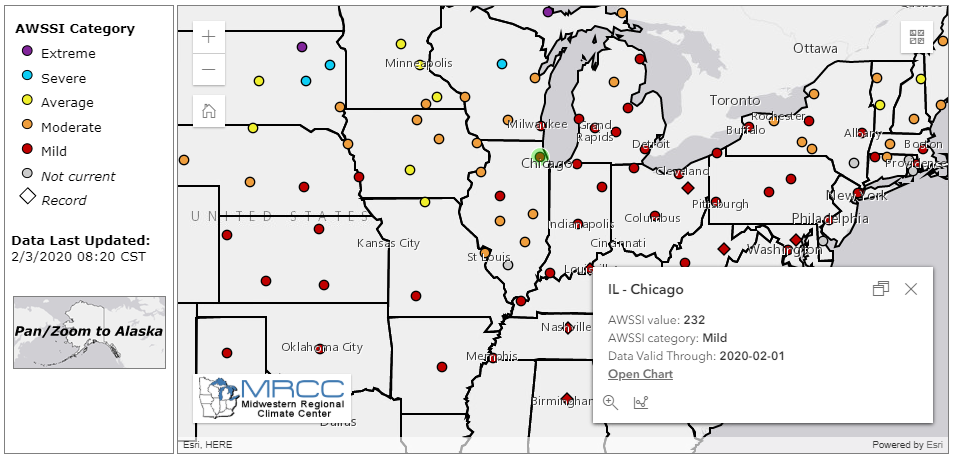
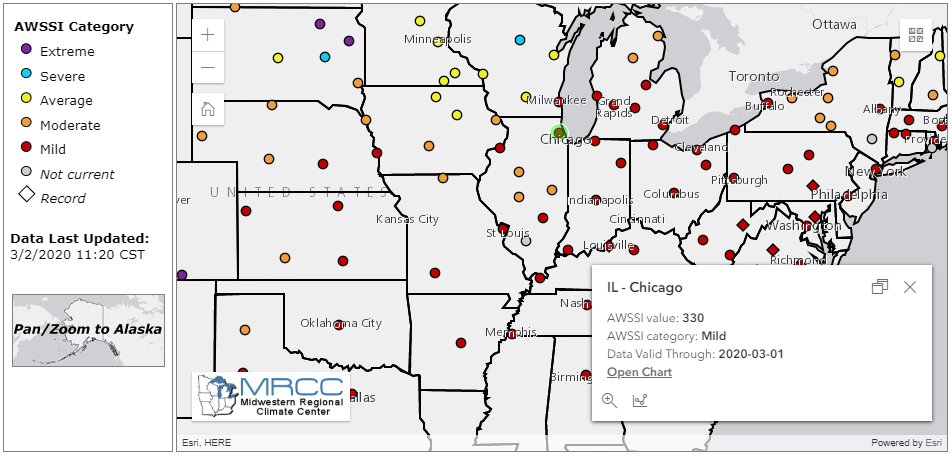
This winter season’s mildness is characterized well by the Accumulated Winter Season Severity Index (AWSSI), which uses daily accumulation of points, based largely on temperature, to characterize winter season severity. The map below shows accumulated winter season severity as of March 3 for individual stations across the U.S. All stations in Illinois have so far exhibited a mild or moderate winter season (i.e., below average severity). AWSSI data and maps are created by the Midwestern Regional Climate Center (https://mrcc.illinois.edu/research/awssi/indexAwssi.jsp).

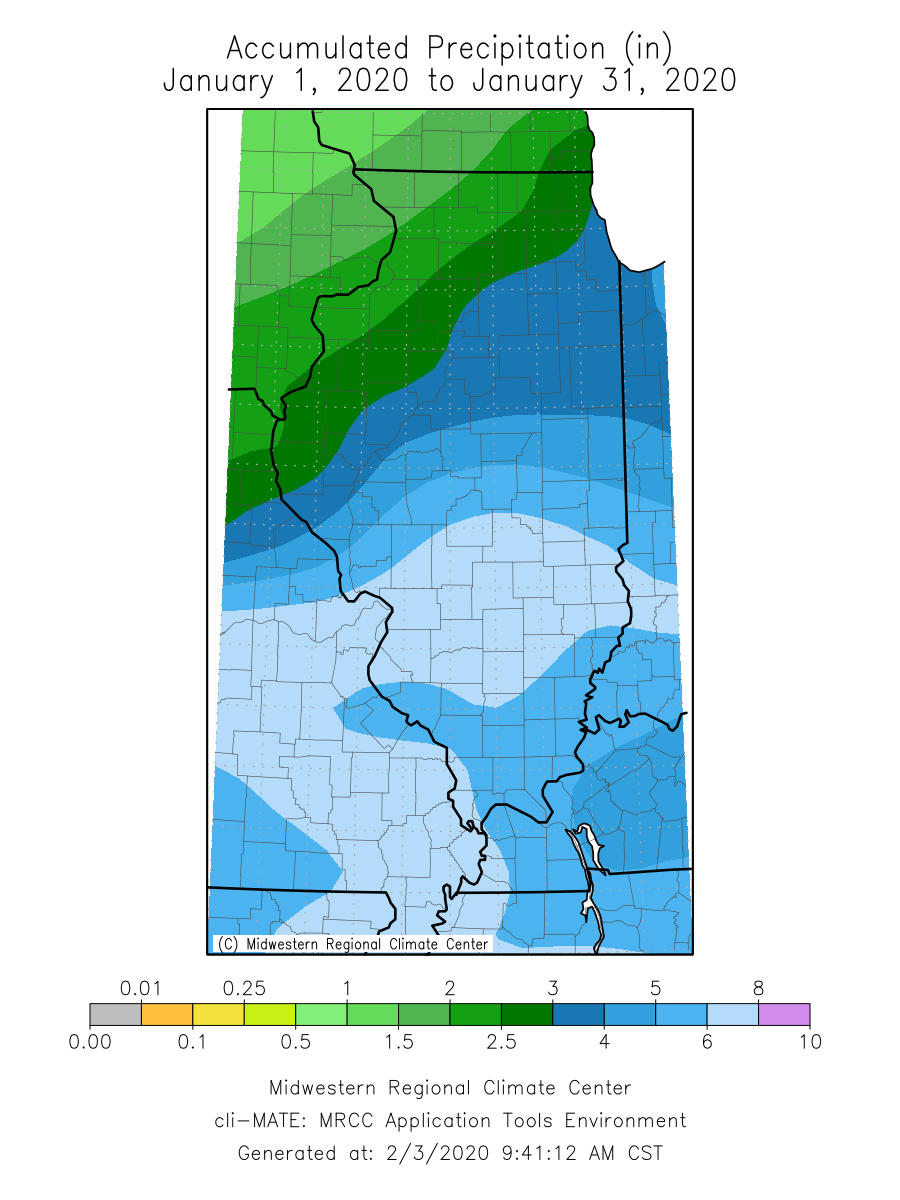
Wet South, Dry North

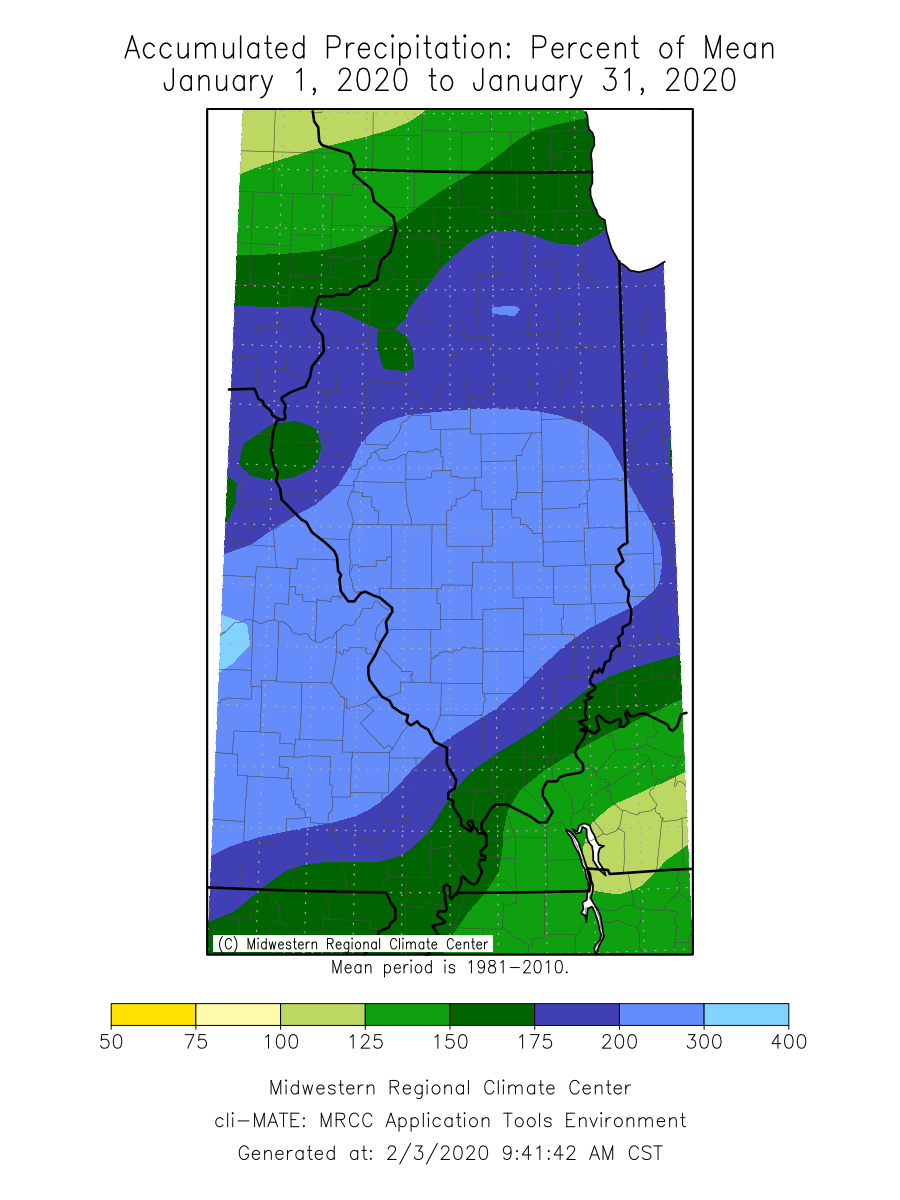
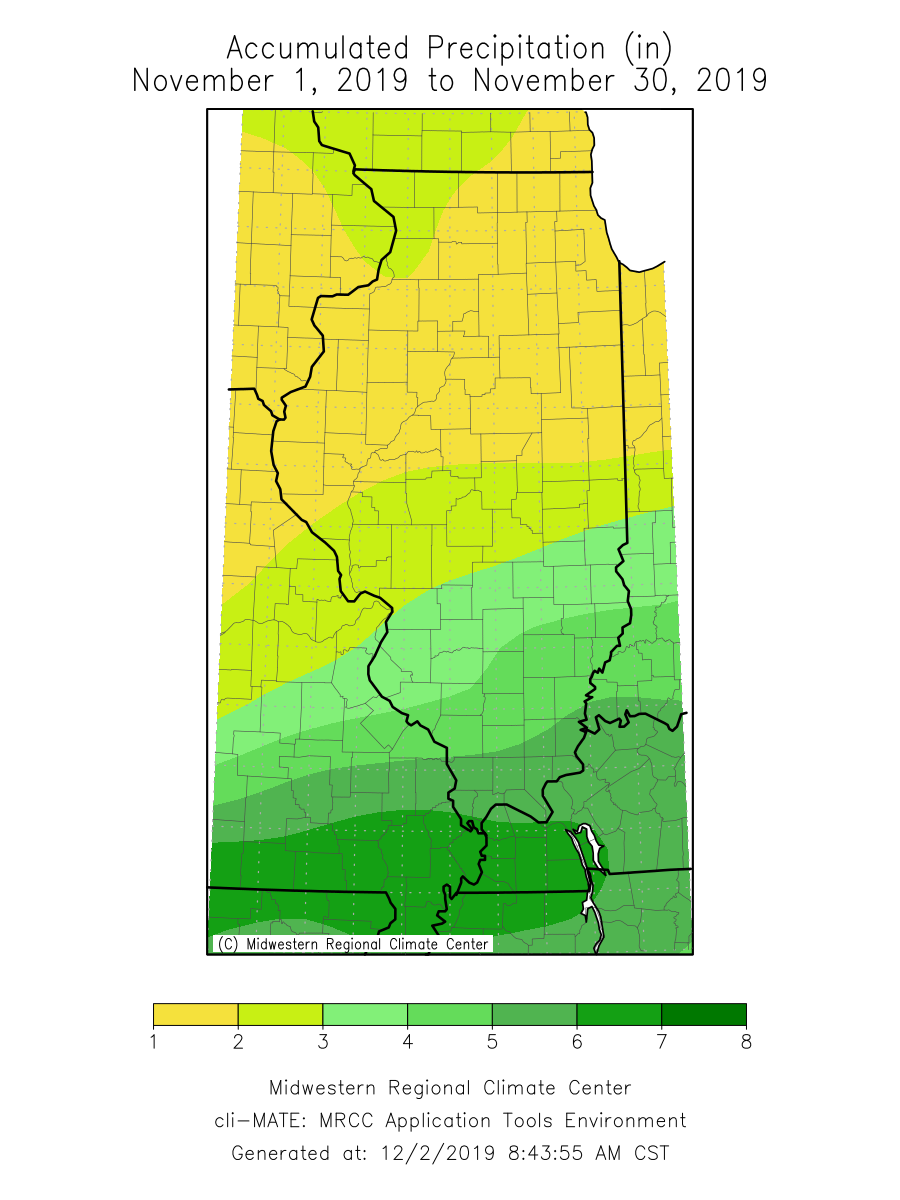
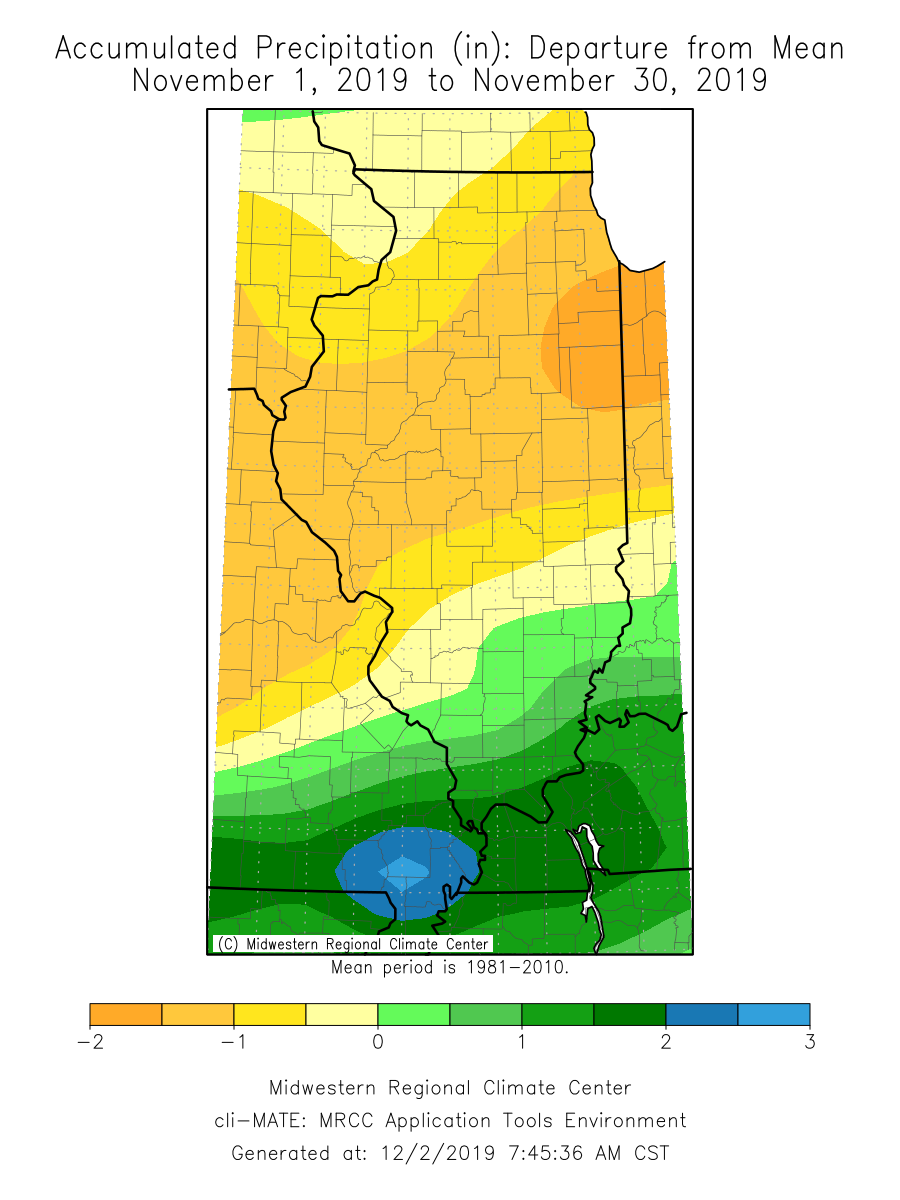
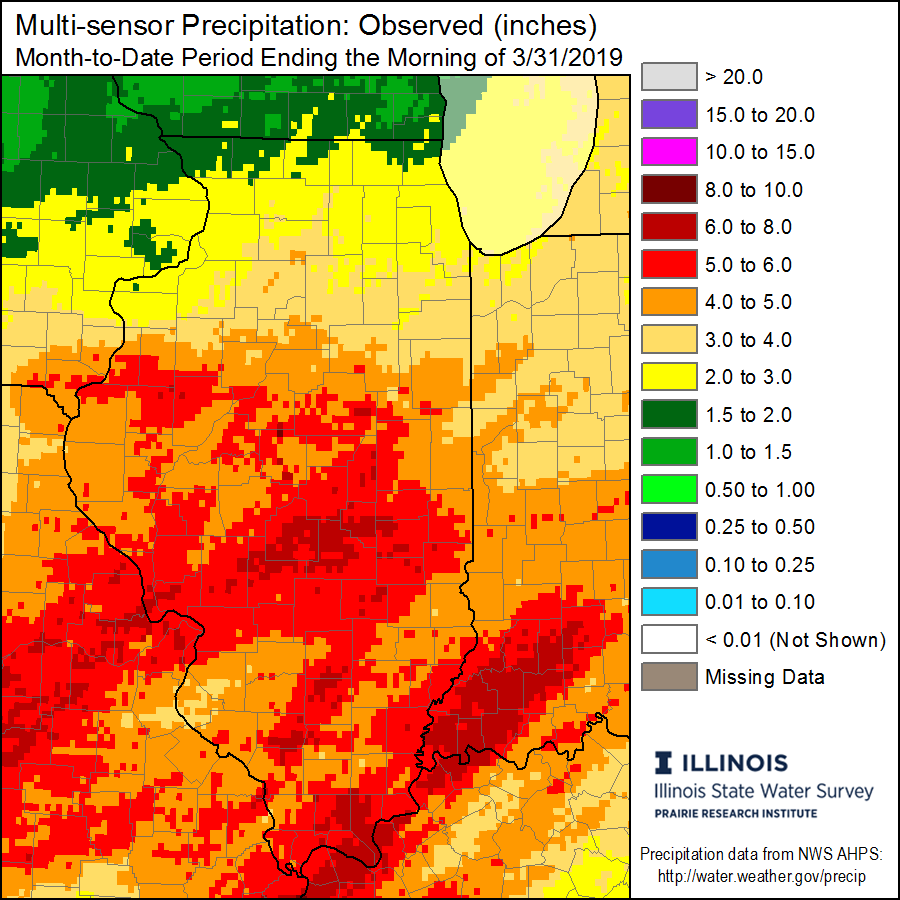
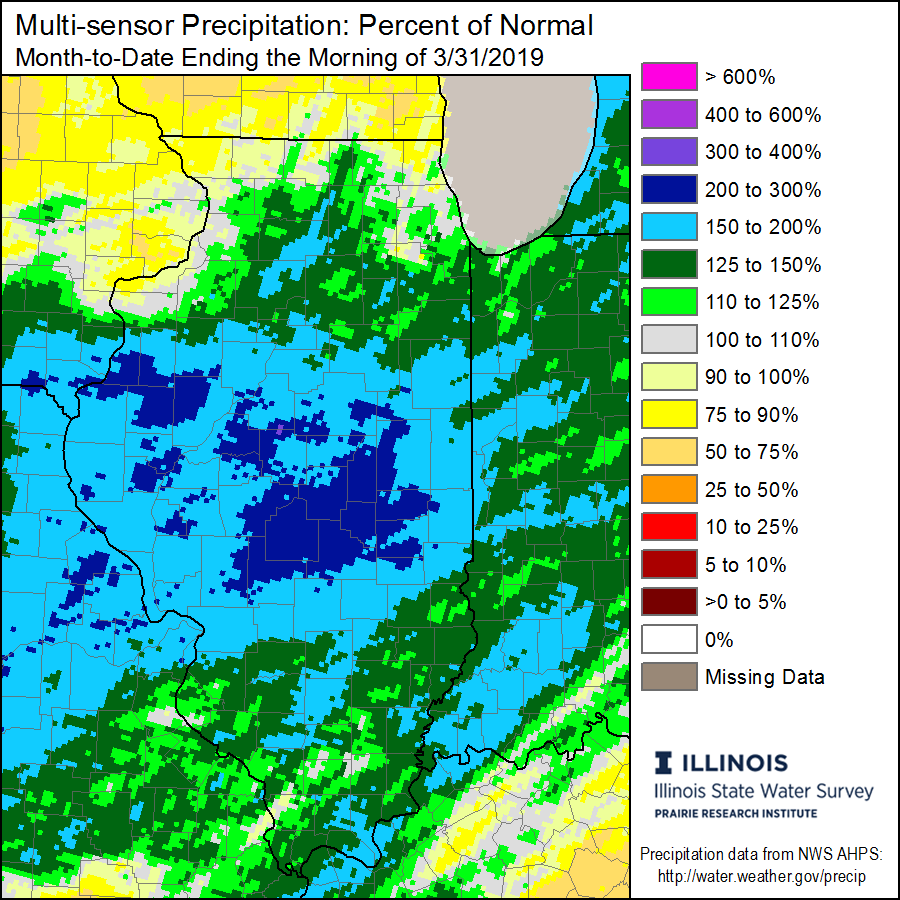
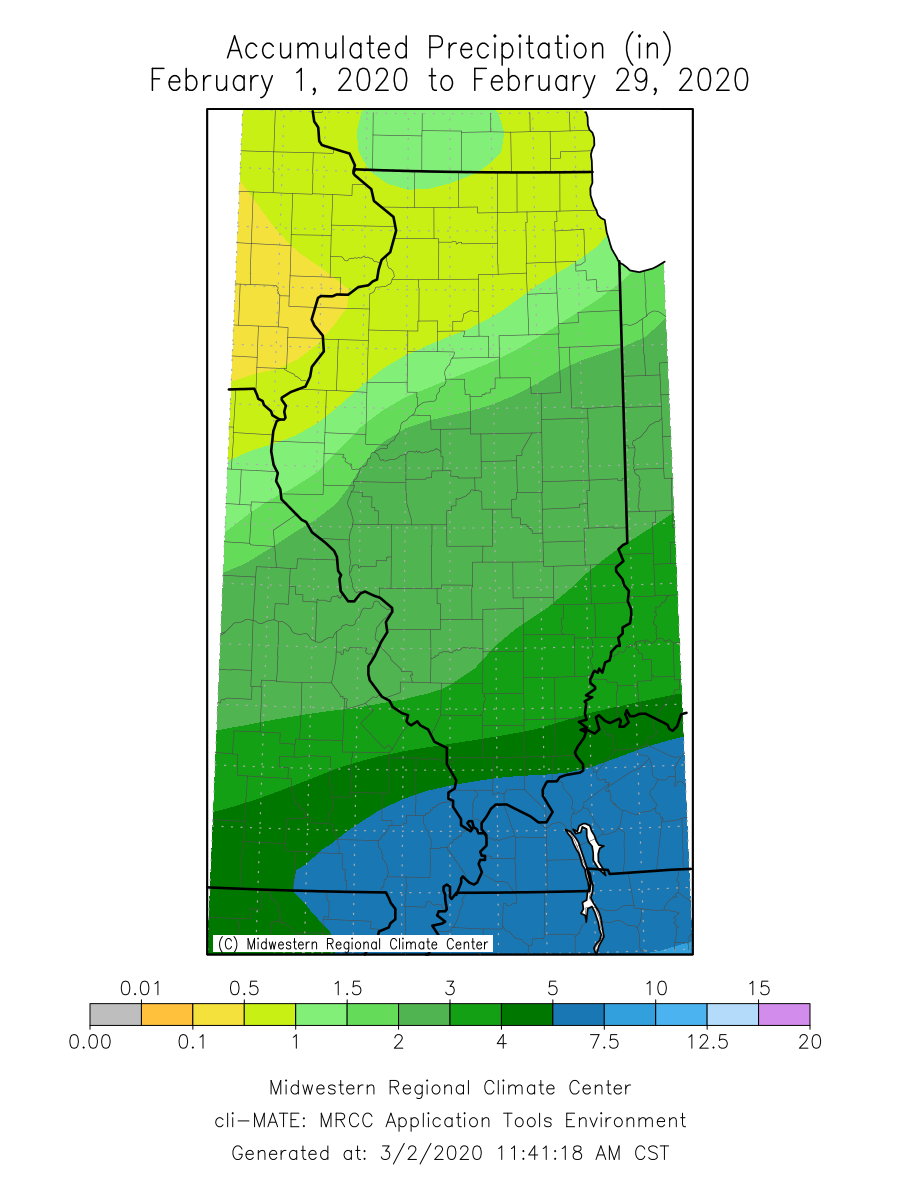
Winter precipitation depends strongly on the location of the subpolar jet stream, which often characterizes the track for winter storms. Last month storms tended to track south of the state, bringing the most rain to southern and south-central portions of Illinois. Total February precipitation ranged from over 10 inches in far southern Illinois to just over a tenth of an inch in northwestern Illinois. These totals range from over 150 percent of average February precipitation in southern Illinois to less than 25 percent of average in northern Illinois.

This was the driest February on record at Gladstone Dam in Henderson County, with only 0.04 inches of precipitation recorded, despite the extra February day this leap year. The wettest place in the state last month was Cairo in Alexander County, with 7.34 inches total precipitation.

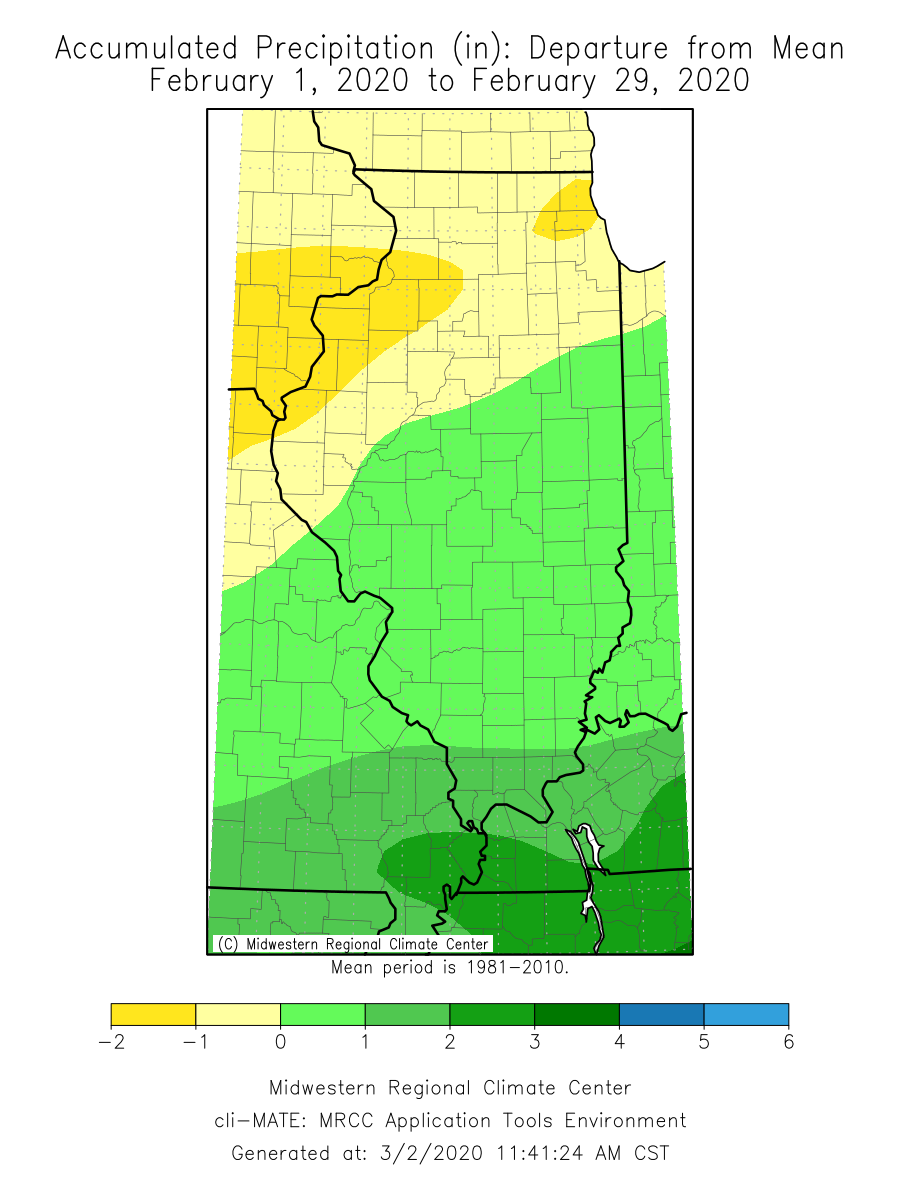
Overall the preliminary statewide average total February precipitation was 2.13 inches, 0.07 inches wetter than the 30-year normal and tied for 46th wettest on record. As a point of reference, the statewide total precipitation for February 2019 was 3.21 inches and for February 2018 it was 4.88 inches.

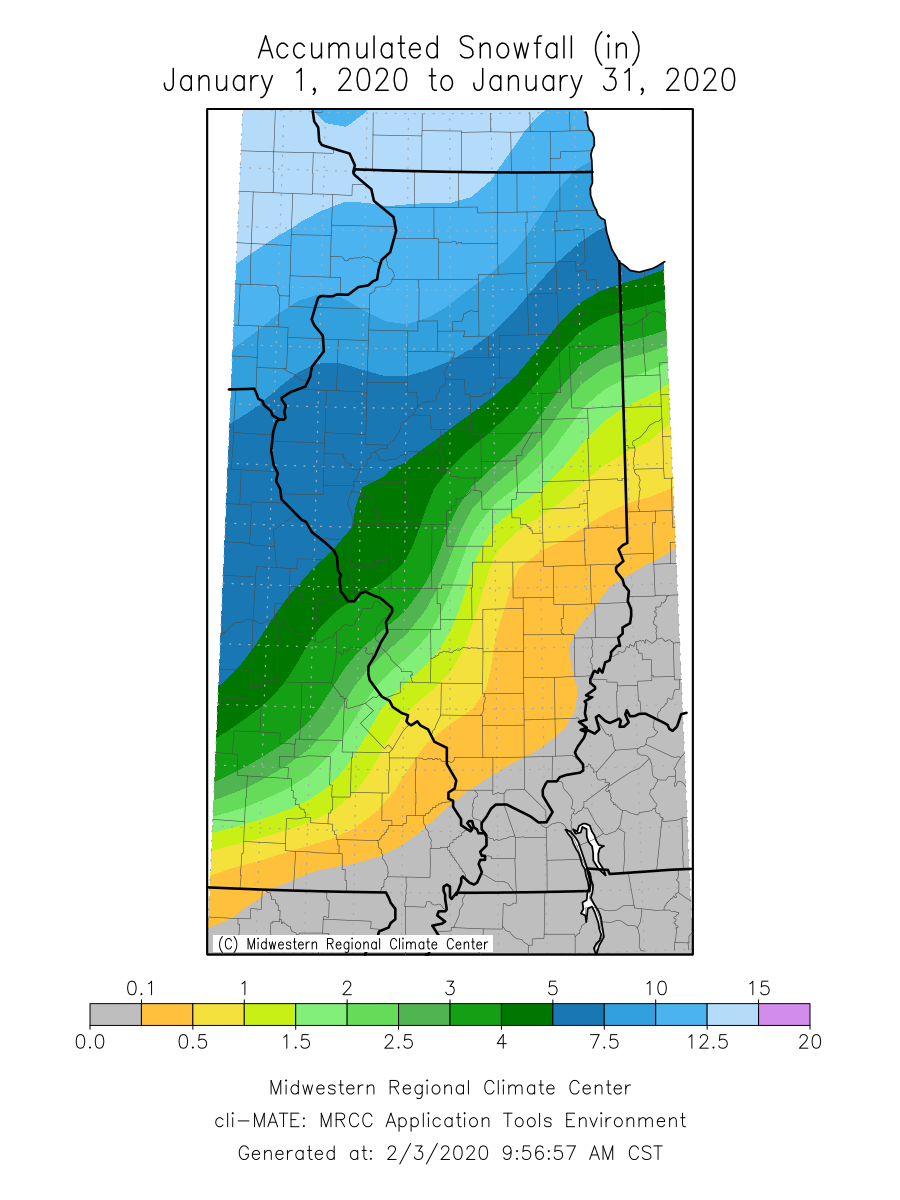
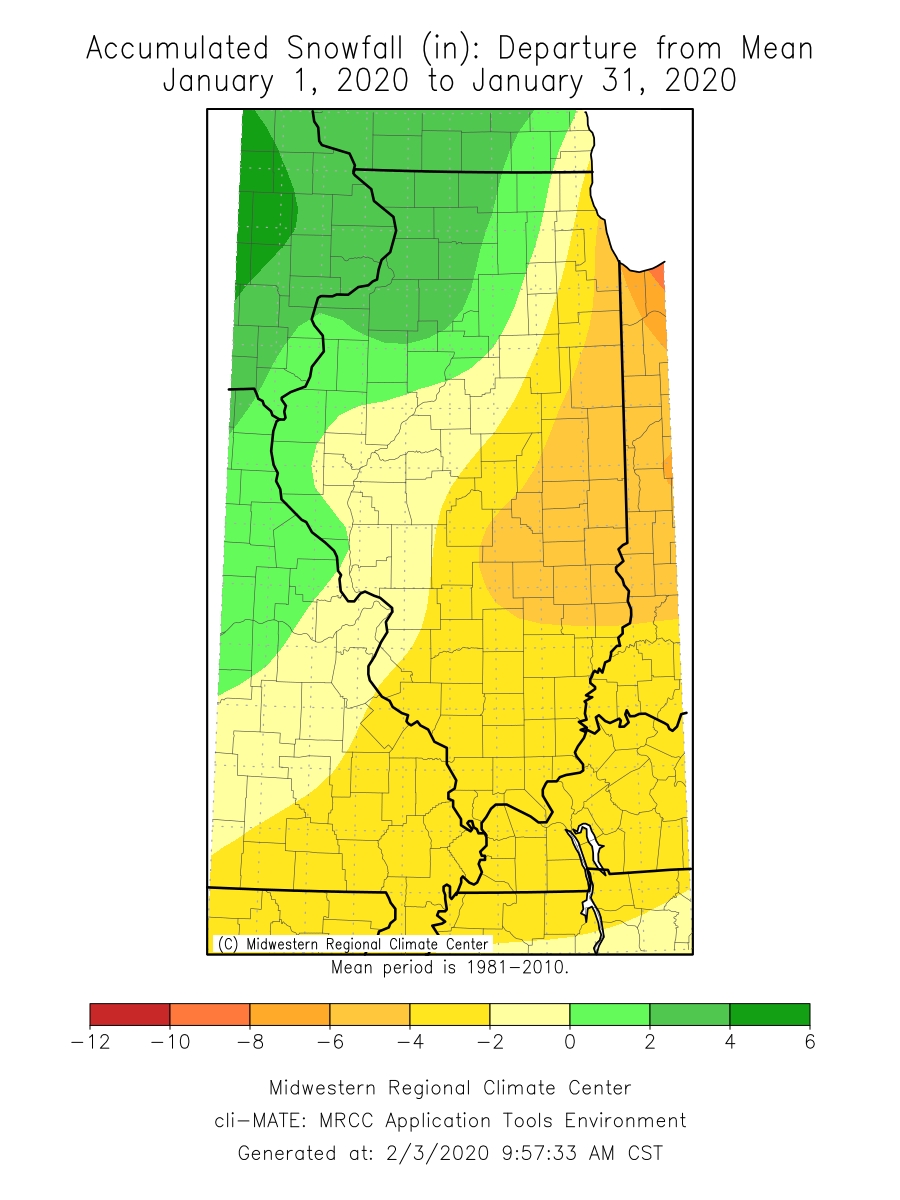
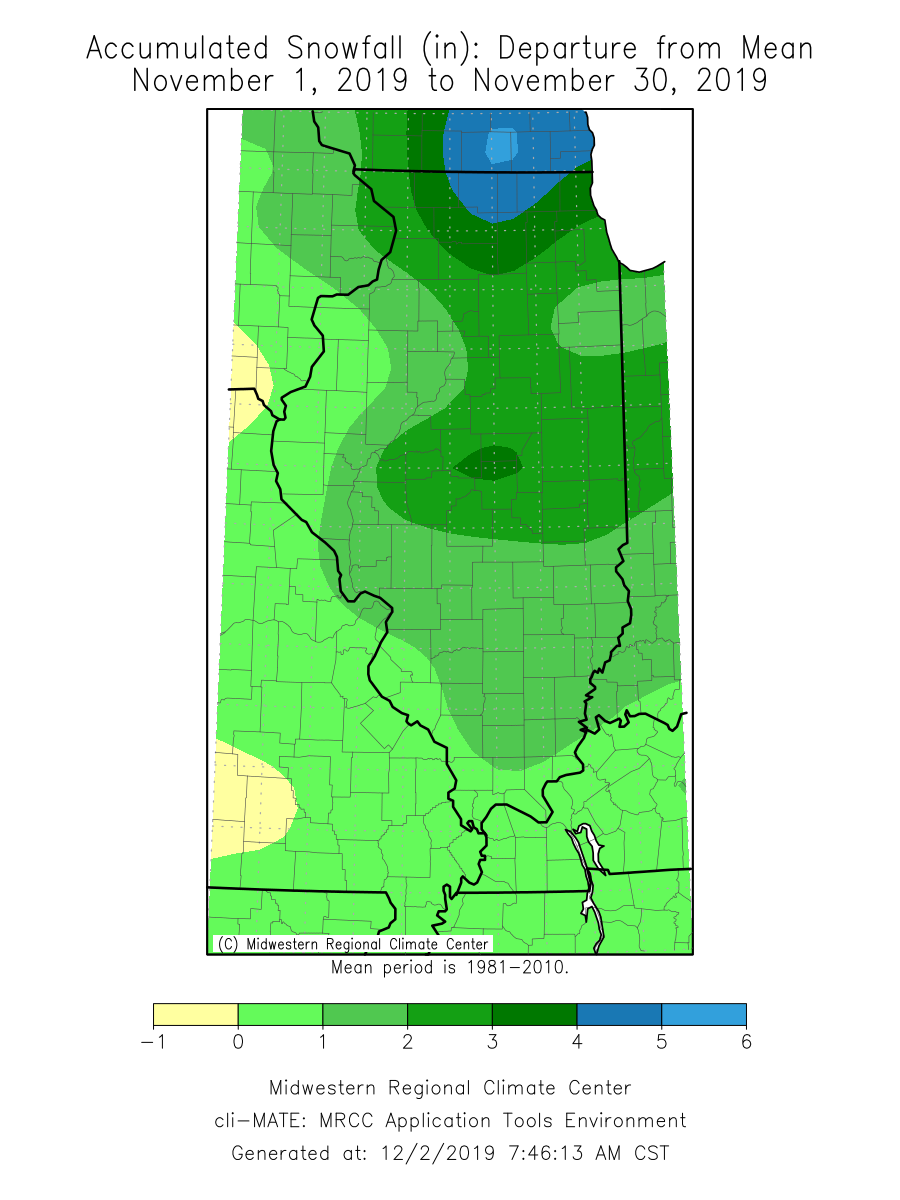
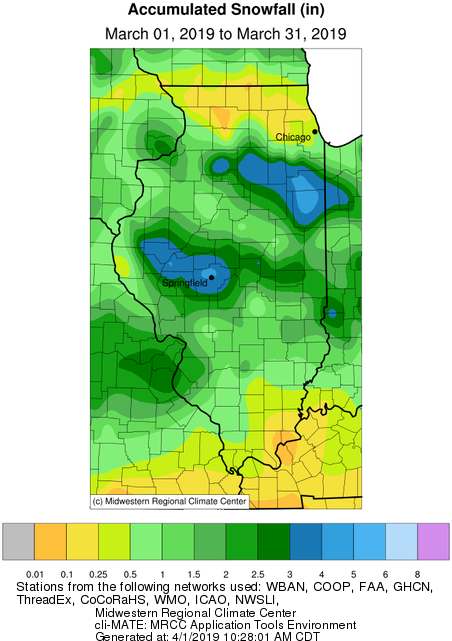
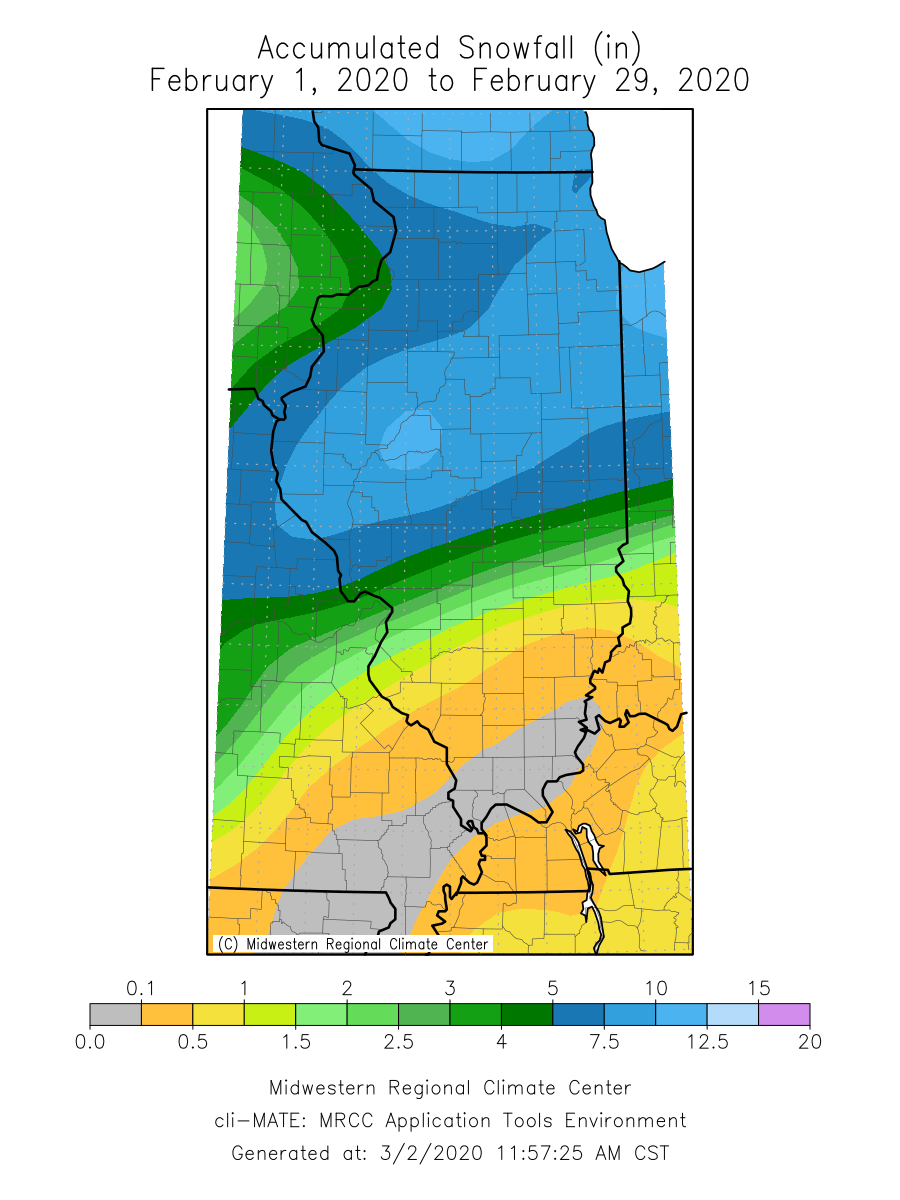
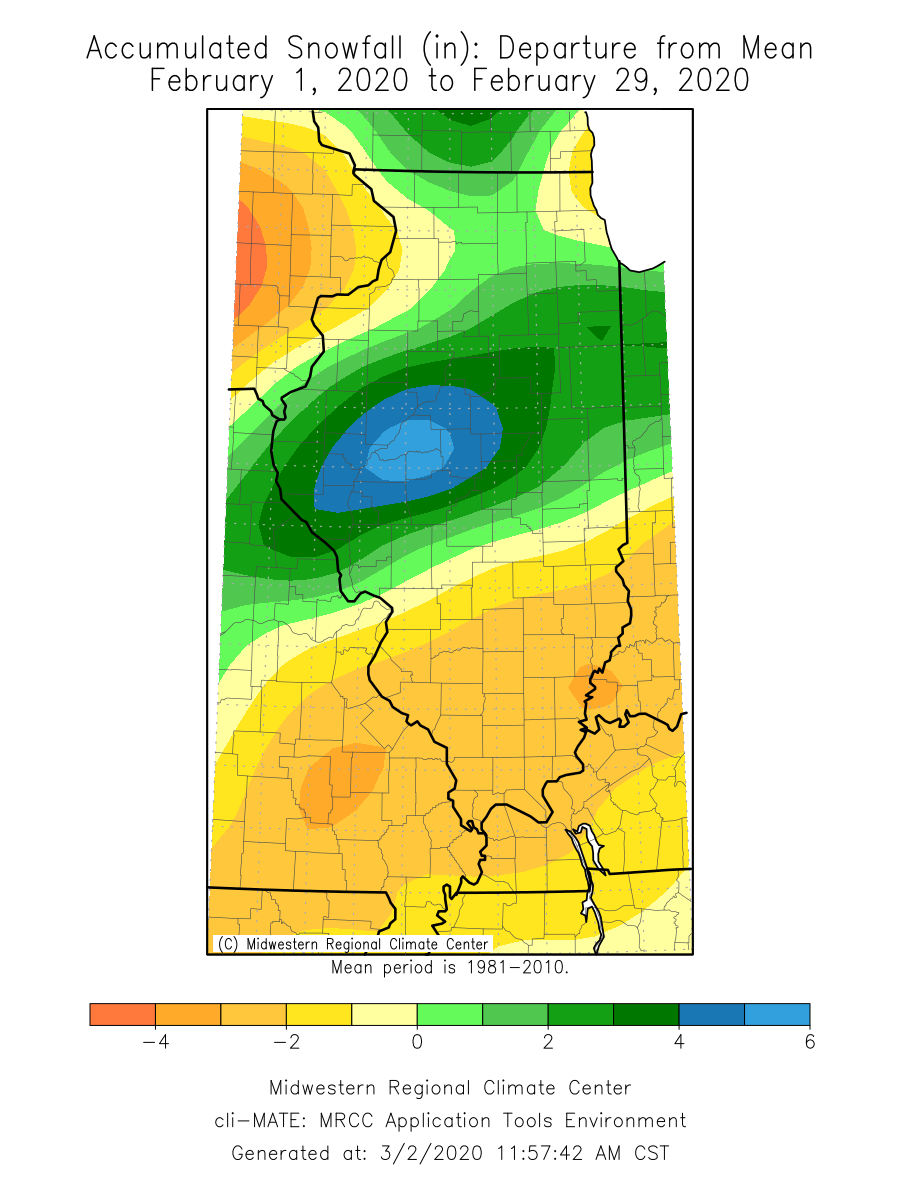
While southern Illinois was experiencing persistent rain, most of northern Illinois was treated to abundant snowfall in February. Snowfall totals from last month ranged from just over 15 inches in Kane County to less than an inch along Interstate 70. Thanks to a mid-month storm, a small area of Mason, Cass, and Menard counties received 6 to 8 inches more than average snowfall in February, whereas most of the rest of the state north of Interstate 70 received near average to just a couple of inches above average snowfall last month.

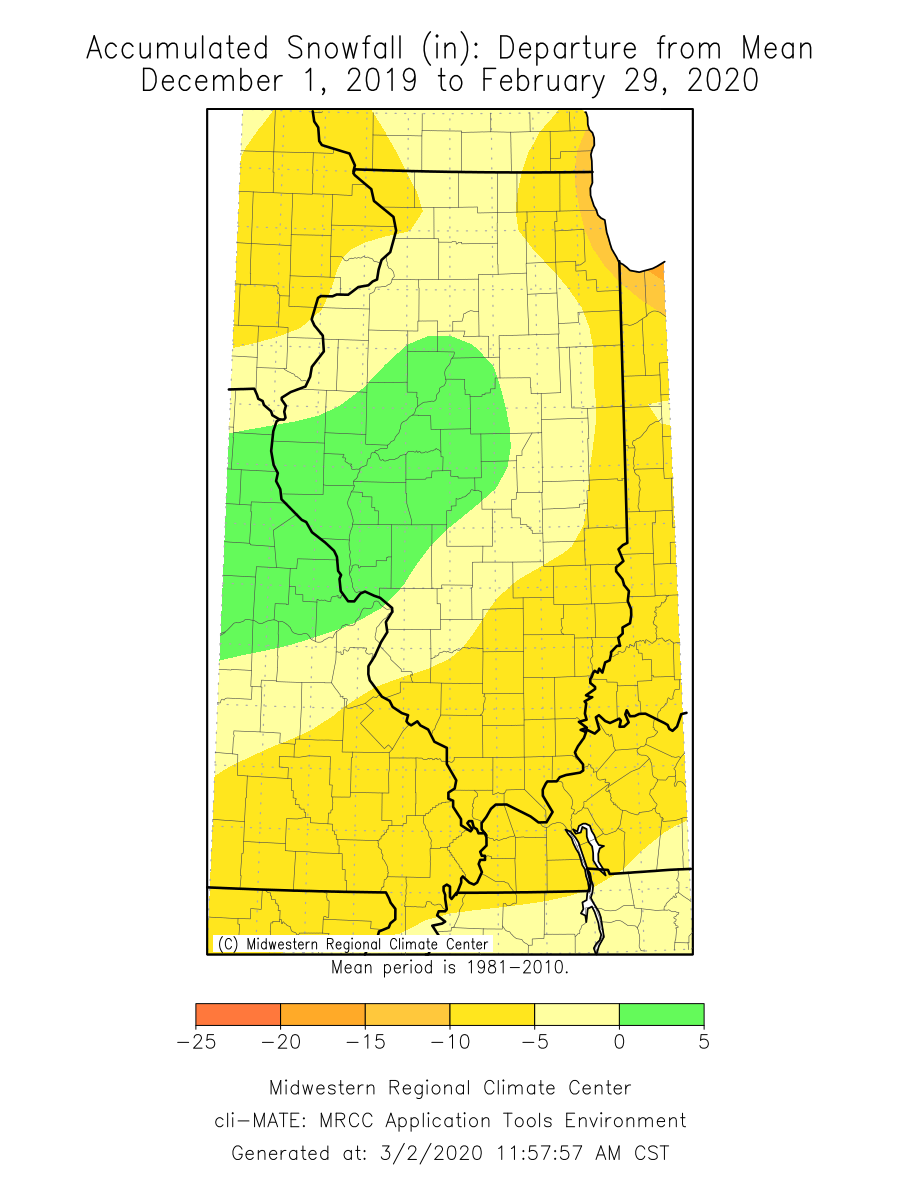
Snowfall totals over the climatological winter season (December–February) are within 5 inches of the long-term average for most of the central and western portions of the state, while a snowfall deficit exists along the Indiana border and for most of southern Illinois. The largest departures from average are in the Chicagoland area, where winter season snowfall has been 15 to 20 inches less than average.

Outlooks

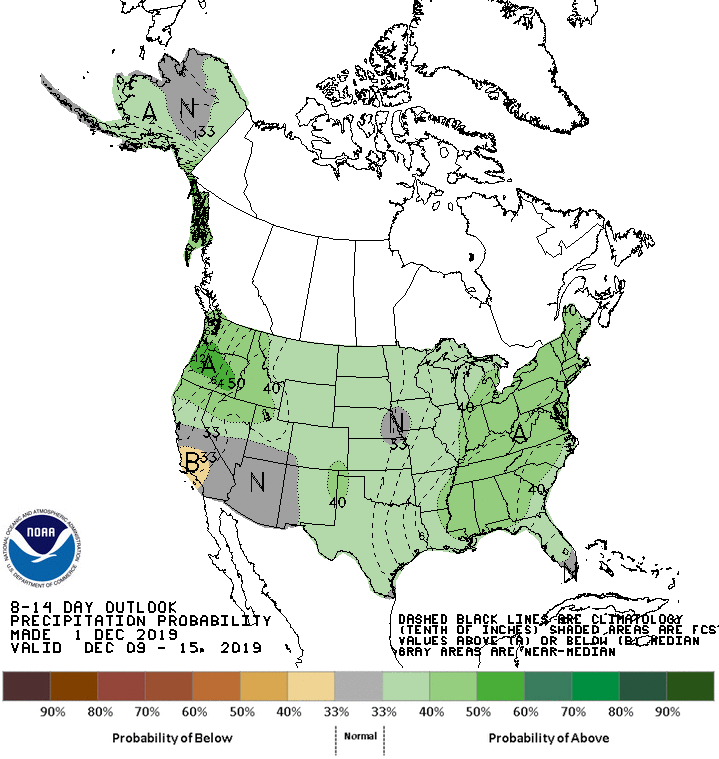
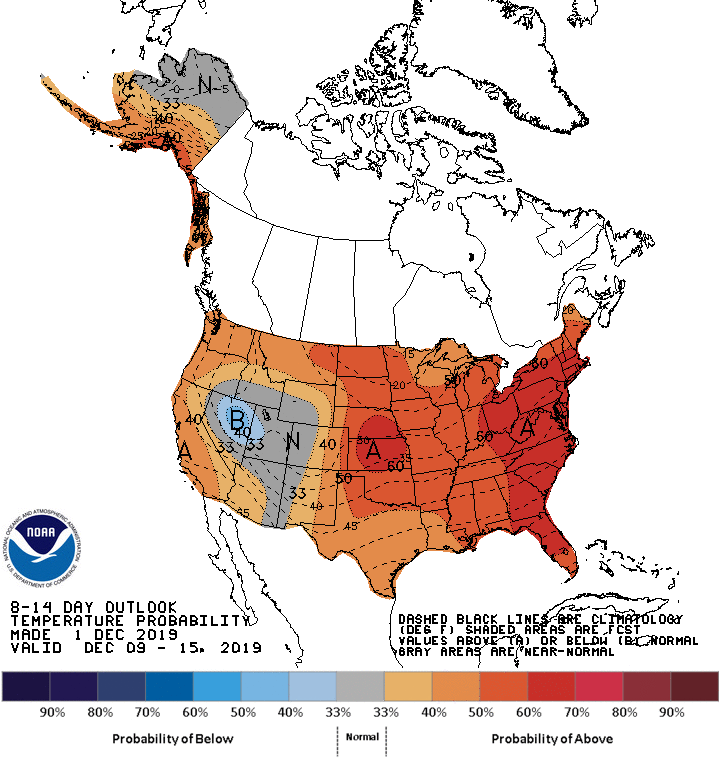
Short-term 8- to 14-day outlooks from the NOAA Climate Prediction Center show strongly elevated odds of both above normal precipitation and above normal temperatures across the state.

Longer-term 30-day outlooks show probabilities remain elevated for warmer than normal conditions across the state for the remainder of March, while elevated probabilities of wetter a wetter than normal March persist in the southern half of the state.

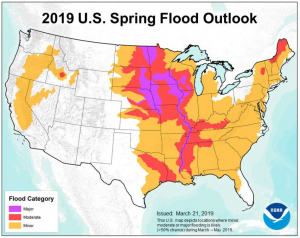
Spring flooding outlooks from the National Weather Service continue to show above normal to much above normal risks of flooding in the Mississippi River Basin, including 473 gauges with a 50 percent or greater chance of flooding between March and May (see below). Most gauges along the Mississippi River in Illinois have a 50 percent or greater chance of major flooding this spring, with gauges along the Illinois, Kaskaskia, Wabash, and lower Ohio rivers having a similar chance of minor to moderate flooding before May.

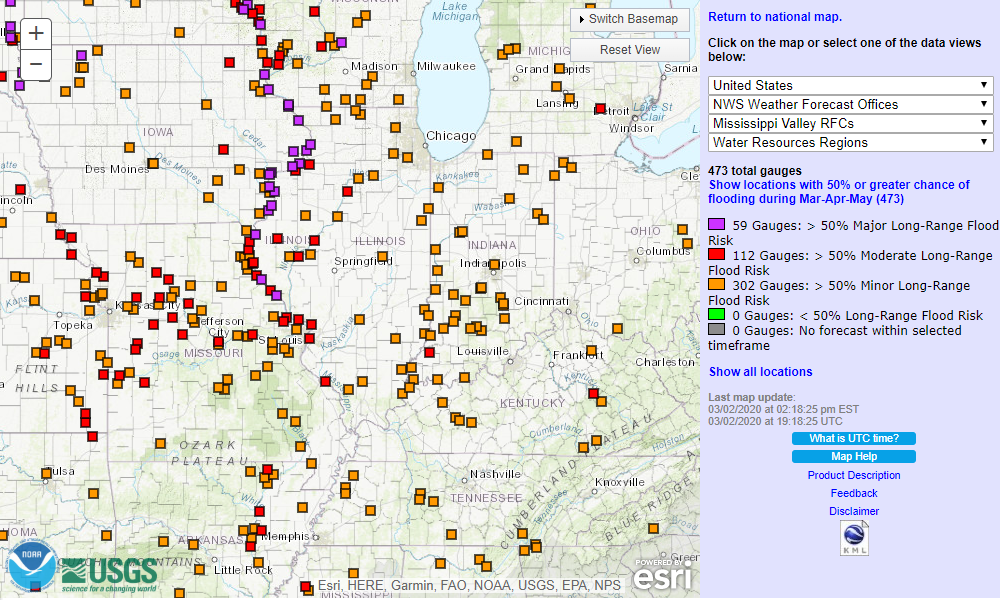
The elevated flood risk is due to: (1) very wet soils across the entire region; (2) large snowpack in the Upper Midwest; and (3) outlooks for a wetter than normal climatological spring season. For those wanting more information related to current hydrologic conditions and/or spring flood outlooks, I have included links to relevant partners and information below.

National Weather Service River Forecast Center: https://www.weather.gov/ncrfc/

NOAA Climate Prediction Center Soil Moisture: https://www.cpc.ncep.noaa.gov/products/Soilmst_Monitoring/US/Soilmst/Soilmst.shtml

NOAA Climate Prediction Center Seasonal Outlooks: https://www.cpc.ncep.noaa.gov/products/predictions/90day/

A Warm, Wet Start to 2020

Our first month of 2020 was quite a bit warmer and wetter than average across the state. The preliminary statewide average January temperature was 31.4 degrees, 5 degrees above the 30-year normal and the 17th warmest on record going back to 1895. The preliminary statewide average total January precipitation was 4.41 inches, 2.34 inches above the 30-year normal and the 9th wettest on record.

Data are provisional and may change slightly over time

Warm Conditions Persist from 2019

Following a warmer than average December, temperatures remained persistently above average for the first half of January, with only a short cold air incursion between Jan. 15 and 23. January average temperatures ranged from the mid-20s in northern Illinois to the high 30s in southern Illinois, and were 2 to 7 degrees above average across the state.

The majority of January days were warmer than average across the state. For example, the daily mean temperature in Dwight in Livingston County was below the long-term average in only 5 of the 31 January days. Dwight has only experienced 14 days with below average daily mean temperatures since the beginning of meteorological winter on Dec. 1.

Last month, 21 local daily high maximum temperature records and 36 daily high minimum temperature records were broken in Illinois. The highest temperature recorded across the state in January was 65 degrees in Cairo and Carbondale on Jan. 11. Overall, the preliminary January 2020 statewide average was 31.4 degrees, which was the 17th warmest January on record, following the 15th warmest December (2019) on record.

Temperatures since the start of meteorological winter on Dec. 1 are 2 to 7 degrees above the long-term average across the state. As an example, this winter through Feb. 2 is the 4th warmest on record in Moline with an average temperature of 31.1 degrees.  The three winters that were warmer through Feb. 2 in Moline are 2002, 2012, and 2016.

Warmer conditions have helped make for a mild winter so far across the southern half of the Midwest, as indicated by the Accumulated Winter Season Severity Index (AWSSI). AWSSI uses a daily accumulation of points, based largely on temperature, to characterize winter season severity. Despite an early snowfall this season, all AWSSI-monitoring stations in Illinois indicate a mild or moderate winter season so far (see map below). AWSSI data and maps are created by the Midwestern Regional Climate Center (https://mrcc.illinois.edu/research/awssi/indexAwssi.jsp).

A Few Days Make for a Wet January

January total precipitation was above normal across the state, with monthly precipitation totals ranging from 2 inches in northwestern Illinois to nearly 8 inches in south-central Illinois. The highest accumulation was along the Interstate 70 corridor between the St. Louis Metro East and Effingham. This region experienced nearly 300 percent of its average January total precipitation. Vandalia in Fayette County experienced its third wettest January on record with 7.99 inches, over 5 inches above the long-term average. As with most of the wettest parts of the state, Vandalia received 85 percent of its total January precipitation in just three days. Much of this was the result of a single winter storm that moved through the Midwest between Jan. 9 and 12.

Total precipitation between Jan. 10 and 12 broke three-day total January precipitation records at Charleston (5.85 inches), Taylorville (4.35 inches), Champaign (3.63 inches), and Marseilles (3.41 inches). This event resulted in flooding along many of Illinois’ larger rivers, including the Kaskaskia River breaking through the Vandalia levee and causing a temporary closure of highway 51. Rivers crested between 24 and 72 hours after the precipitation ended. As of the end of the month, minor flooding persisted in only the lower Illinois and Kaskaskia Rivers in the state (see map below).

Source: https://www.weather.gov/ncrfc/

Snowfall totals this last month ranged from less than a tenth of an inch in southern Illinois to over 12 inches in northwestern Illinois. There was a strong southeast-to-northwest January snowfall gradient across the state, resulting from a similar gradient in air temperature. The highest January snowfall total was 15 inches in both Stephenson and Bureau Counties. Rockford experienced the highest 1-day snowfall maximum across the state with 6 inches on Jan. 25.

January continued winter season snowfall patterns, with the western third of the state experiencing slightly above normal snowfall since Oct. 1, and the eastern two-thirds of the state experiencing near normal to well below normal snowfall over the same period. A broad area along the Indiana border from Cook County to Lawrence County has experienced between 50 and 75 percent of normal winter season snowfall, whereas most of the state south of Interstate 64 has experienced less than 50 percent of normal snowfall since Oct. 1. In contrast, snowfall totals across a broad area between Jo Daviess County and Madison County in western Illinois has experienced between 100 and 125 percent of normal season snowfall.

As is often the case, Illinois spans the continuum of conditions in the Midwest. Most areas northwest of us have experienced well above normal snowfall where areas to the southeast are in a snowfall deficit. In particular a region spanning the Dakotas to the Upper Peninsula of Michigan have experienced well above normal snowfall this winter season. Two CoCoRaHS stations in the Upper Peninsula have recorded over 210 inches of snowfall since Oct. 1. Heavy snowpack in the Upper Midwest (see map below) can often exacerbate unusually wet conditions in early to mid-spring here in Illinois, especially if a brief warm spell and/or heavy rain causes rapid snowmelt. Therefore Upper Midwest snowpack is an important variable to consider when planning for potential flooding-related impacts in the spring.

Source: https://www.nohrsc.noaa.gov/normals/

Outlooks

Short-term 8–14-day outlooks from the NOAA Climate Prediction Center show strongly elevated odds of above normal precipitation, with the highest probabilities across the southern two-thirds of the state. Short-term temperature outlooks show slightly elevated odds for a continuation of above normal temperatures across the eastern part of the state.

Longer-term 30-day outlooks show elevated odds of both above normal temperature and above normal precipitation in southern Illinois. Seasonal outlooks for spring (March to May) continue to show elevated odds of above normal precipitation across the state, with an equal chance of above normal, normal, and below normal temperatures.

Source: https://www.cpc.ncep.noaa.gov/products/forecasts/

Cold November Brings an End to Meteorological Autumn

November temperatures were well below the long-term average across the state, breaking hundreds of local daily records. The preliminary statewide November average temperature was 35.6 degrees, about 7 degrees below our 30-year normal and tied for the ninth coldest on record. Preliminary data suggest November was drier than average for most of the state. The statewide average November precipitation total was 2.51 inches, approximately 0.96 inches below the 30-year normal.

Data are provisional and may change slightly over time

Cold Weather

The intense cold weather at the end of October continued into the first two thirds of November. Average temperatures ranged 10 to 15 degrees below the long-term mean for the first half of the month. Between November 1 and November 15, 149 daily low maximum temperature records and 177 daily low minimum temperature records were broken across the state. Several all-time November temperature records were broken as well, including both the all-time November low minimum and low maximum temperature records in Robinson, Illinois (Crawford County, records back to 1893). At Chicago’s O’Hare airport, 22 out of 30 November days experienced an average temperature below the long-term mean, including the first 19 days of the month. Stations in Knox, Jo Daviess, Carroll, and Whiteside Counties observed daily minimum temperatures below 0 in November, the lowest being -4 degrees in Altona (Knox County) on November 7.

A shift in the upper-atmospheric trough around November 20 allowed temperatures to moderate. Average temperatures between November 16 and November 30 were between 1 and 3 degrees below normal across the state. Overall, November temperatures were between 4 and 8 degrees below the long-term mean across the state. The preliminary 2019 statewide November average temperature was 35.6 degrees, which was also the 2018 statewide average temperature and tied for the ninth warmest November on record.

Precipitation

November precipitation was below the long-term mean for all of Illinois north of Interstate 64. Monthly precipitation totals ranged from 1 to 2 inches in central and northern Illinois to over 6 inches in far southern Illinois. These totals represented between 2 inches below normal and 2 inches above normal.

The statewide average precipitation total for November was 2.51 inches, approximately 1 inch below the 30-year normal and 56th driest monthly total since 1895. November was only the second month this year–along with July–that experienced below normal statewide average precipitation and only the third month since June 2018 (see figure below).

Despite the dryness, abundant October precipitation and timely rain and snow events throughout November alleviated all abnormally dry conditions across the state. According to the U.S. Drought Monitor, the entire state has been free of drought and abnormally dry conditions since November 5.

Although total precipitation was below normal for most of the state this last month, snowfall totals were well above average. Total November snowfall accumulations ranged from nearly 12 inches in northern Illinois to just over half an inch in far southern Illinois. Accumulations were between 1 and 6 inches below the long-term November average snowfall totals. Measurable snowfall (accumulation greater than 0.10 inches) occurred in November as far south as Cairo (Alexander County). The highest November snowfall total was 11.7 inches in McHenry County.

Just as impressive as the snowfall totals this month was the number of days with measurable snowfall. The long-term weather station in Freeport recorded 5 days in November with measurable snowfall, tied for the second most since 1948 and the most since 1978.

December Outlooks

Both short-term 8- to 14-day outlooks and 1-month December outlooks from the Climate Prediction center show strongly elevated odds of above normal temperatures across the state. The outlooks are informed in part by predicted changes in mid-level atmospheric pressure patterns in early December, which permit southerly movement of warm air into the region.

The shorter and longer outlooks both show slightly elevated odds of above normal precipitation, although odds are weaker than for temperature outlooks. Winter (December–February) outlooks show an equal chance for temperature and slightly elevated odds for above normal winter precipitation.

March 2019: A cold start to the month, with a stormy and wet finish

March 2019 will be a month remembered for an unseasonably cold start, followed by an active and wet weather pattern which resulted in a continuation of excess soil moisture, and major flooding events on many local streams and rivers.

Statewide, March ended colder and substantially wetter than the long term average.  The preliminary average statewide March temperature was 36.6°F, which is 4.7°F below the long term average.  The preliminary average statewide precipitation was 4.16 inches, which is 1.20 inches above the long term average.

Data are provisional and may change slightly over time.

Temperature

Preliminary results show that March 2019 finished with a statewide average temperature of 36.6°F which is 4.7°F below the long term average.

The first full week or March begun with a brutal Arctic outbreak in which temperature departures of 15° to 25°  below normal were common across Illinois (see map below).

During this time three stations recorded minimum temperatures of -10° or colder.  The lowest reading in the state, -12°F, occurred at the Little Red School House station (Cook County) on March 5th.

In contrast, the warmest reading in the state was 76°F, reported at a station near Dixon Spring (Pope County) on March 13th.

The map below depicts average monthly statewide temperature departures for Illinois.  March temperature departures finished below average statewide, with the coldest departures occurring across large areas of central Illinois, and in the northwest corner of the state.

Precipitation

Preliminary statewide average precipitation for March was 4.16 inches, which is 1.20 inches above the long term average.

A persistent active weather pattern along with above average precipitation were the biggest weather stories in March.  Major and historic flooding on the lower Ohio River Basin in Southern Illinois continued into the first week of March, resulting from substantial February rain events.  By the middle of the month, a strong and historic low pressure system brought heavy rain, storms, and strong wind to Illinois and the rest of the Midwest.  The heavy rains and combined regional snow melt resulted in additional widespread flooding concerns across the region.  This included a major flooding event for northern and northwest Illinois, with the Rock, Fox, and Mississippi Rivers experiencing significant crests.

The heaviest March precipitation fell across central and southern portions of the state where 4 to 6 inches were common.  Five stations in these regions reported over 6 inches of precipitation for the month.  Totals were lower in Northern Illinois with generally 1.5 to 3 inches. The lowest totals for the month occurred along the Illinois/Wisconsin border.

The highest March precipitation total of 6.41 inches was reported at a station near Jerseyville (Jersey County).

Above average March wetness led to precipitation anomalies over 100% of average for the southern two-thirds of the state, with the most impressive anomalies of 200-300% percent of average in a large area of central Illinois (see map below).

Snowfall in March did occur statewide, although it was rarely long lasting.  Storm tracks are apparent on the accumulated snowfall map, with two distinct snow maximums. One in the vicinity of the corridor from Rushville to Springfield, and a second centered near Kankakee.  In both cases 3 to 5 inches of accumulation were measured.

Spring Outlook

Soil moisture profiles across Illinois remain in the 90th percentile or higher as we head into April.  This leaves soil conditions favorable for spring runoff, and is an ever-growing concern for the agricultural community.

The National Weather Service (NWS) spring flood outlook places the entire state in its flood risk zone. Eastern and central Illinois are subject to a minor flood risk, while western, extreme northern and southern portions of the state are in a moderate flood risk zone.  Locations immediately along the banks of the Mississippi river are in a major flood risk zone.

April 2019

Looking ahead at the rest of April 2019, the Climate Prediction Center (CPC) is favoring probabilities of above average temperatures statewide.  This is a welcome change compared to April 2018, which ranked as the second coldest April in state history.  An active weather pattern looks to persist, as the April outlook favors slight probabilities of above average precipitation for the western half of the state.