March 2019: A cold start to the month, with a stormy and wet finish

March 2019 will be a month remembered for an unseasonably cold start, followed by an active and wet weather pattern which resulted in a continuation of excess soil moisture, and major flooding events on many local streams and rivers.

Statewide, March ended colder and substantially wetter than the long term average.  The preliminary average statewide March temperature was 36.6°F, which is 4.7°F below the long term average.  The preliminary average statewide precipitation was 4.16 inches, which is 1.20 inches above the long term average.

Data are provisional and may change slightly over time.

Temperature

Preliminary results show that March 2019 finished with a statewide average temperature of 36.6°F which is 4.7°F below the long term average.

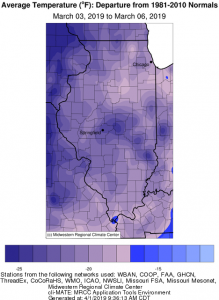
The first full week or March begun with a brutal Arctic outbreak in which temperature departures of 15° to 25°  below normal were common across Illinois (see map below).

During this time three stations recorded minimum temperatures of -10° or colder.  The lowest reading in the state, -12°F, occurred at the Little Red School House station (Cook County) on March 5th.

In contrast, the warmest reading in the state was 76°F, reported at a station near Dixon Spring (Pope County) on March 13th.

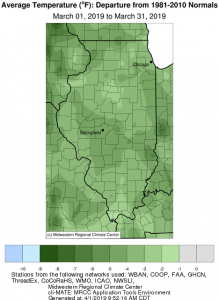
The map below depicts average monthly statewide temperature departures for Illinois.  March temperature departures finished below average statewide, with the coldest departures occurring across large areas of central Illinois, and in the northwest corner of the state.

Precipitation

Preliminary statewide average precipitation for March was 4.16 inches, which is 1.20 inches above the long term average.

A persistent active weather pattern along with above average precipitation were the biggest weather stories in March.  Major and historic flooding on the lower Ohio River Basin in Southern Illinois continued into the first week of March, resulting from substantial February rain events.  By the middle of the month, a strong and historic low pressure system brought heavy rain, storms, and strong wind to Illinois and the rest of the Midwest.  The heavy rains and combined regional snow melt resulted in additional widespread flooding concerns across the region.  This included a major flooding event for northern and northwest Illinois, with the Rock, Fox, and Mississippi Rivers experiencing significant crests.

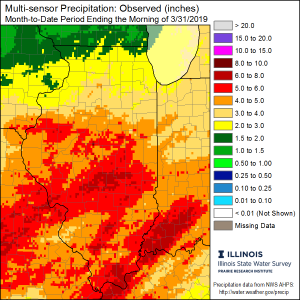
The heaviest March precipitation fell across central and southern portions of the state where 4 to 6 inches were common.  Five stations in these regions reported over 6 inches of precipitation for the month.  Totals were lower in Northern Illinois with generally 1.5 to 3 inches. The lowest totals for the month occurred along the Illinois/Wisconsin border.

The highest March precipitation total of 6.41 inches was reported at a station near Jerseyville (Jersey County).

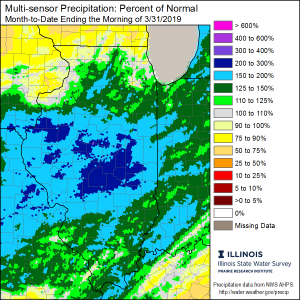
Above average March wetness led to precipitation anomalies over 100% of average for the southern two-thirds of the state, with the most impressive anomalies of 200-300% percent of average in a large area of central Illinois (see map below).

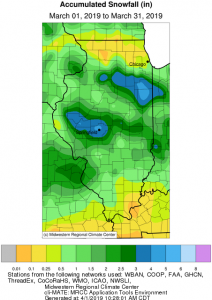
Snowfall in March did occur statewide, although it was rarely long lasting.  Storm tracks are apparent on the accumulated snowfall map, with two distinct snow maximums. One in the vicinity of the corridor from Rushville to Springfield, and a second centered near Kankakee.  In both cases 3 to 5 inches of accumulation were measured.

Spring Outlook

Soil moisture profiles across Illinois remain in the 90th percentile or higher as we head into April.  This leaves soil conditions favorable for spring runoff, and is an ever-growing concern for the agricultural community.

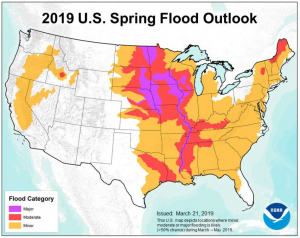
The National Weather Service (NWS) spring flood outlook places the entire state in its flood risk zone. Eastern and central Illinois are subject to a minor flood risk, while western, extreme northern and southern portions of the state are in a moderate flood risk zone.  Locations immediately along the banks of the Mississippi river are in a major flood risk zone.

April 2019

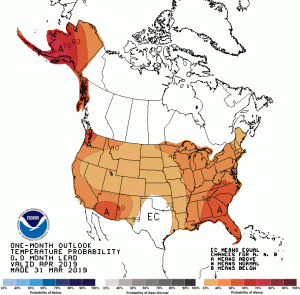
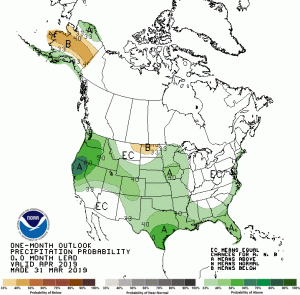
Looking ahead at the rest of April 2019, the Climate Prediction Center (CPC) is favoring probabilities of above average temperatures statewide.  This is a welcome change compared to April 2018, which ranked as the second coldest April in state history.  An active weather pattern looks to persist, as the April outlook favors slight probabilities of above average precipitation for the western half of the state.
El Nino and the Midwest

NOAA has released a new 2-page fact sheet on El Niño and the Midwest (links below). Several people in the Midwest had input into this, including myself. El Niño typically results in warmer and drier than average winters. Confidence in these patterns is higher during stronger El Niño events.

Right now the NOAA Climate Prediction Center states that El Niño is favored to begin in the next 1-2 months and last into spring of 2015. The current thinking is that the odds are 2-in-3 in favor of it arriving and that the event will likely remain weak throughout its duration.

PDF version: EN-MW-Sep2014

Online version:

[scribd id=242836832 key=key-2ql4MIpJSjgpfv25L5Zd mode=scroll]

Lightning Safety Week

Treat lightning with the respect it deserves. Lightning ranks as one of the most serious weather hazards, right up there with floods, tornadoes, and hurricanes (see graph). Because it does its damage in ones and twos, it does not get the same attention as a hurricane or tornado. However, the results can be just as devastating.
Summer (June, July, and August) is the peak season for lightning hazards because it is both the peak for thunderstorms and outdoor activities. Because of the summer spike, the  National Weather Service has declared June 23-29, 2013 as Lightning Safety Week.

Weather fatalities, NOAA. Click to enlarge.
Weather fatalities, NOAA.

A detailed review of recent lightning deaths in the US was done by John Jensenius (NWS).  According to that report, there were 238 people killed between 2006 and 2012. It turns out that golfers (8 deaths in the 7-year study) are not the most likely victims of lightning. More dangerous activities include fishing (26 deaths), camping (15 deaths), boating (14 deaths). Even yard work is more dangerous (12 deaths). Another sobering statistic for us guys is that we account for 82 percent of all fatalities. 
According to another recent study, we have had 102 reported lightning fatalities in Illinois from 1959-2012. And some researchers suggests that these numbers may be too low by 30 to 50 percent because not all lightning deaths are reported as such.  Lightning has likely injured hundreds more in Illinois since 1959.  The injuries can be severe, especially to the brain and nerves. This NOAA webpage outlines the medial aspects of lightning
So treat lightning with the respect it deserves. If you hear thunder, you are likely within striking distance of the storm. Seek shelter immediately. Do not wait. Buildings and vehicles are the best places to seek shelter. Here are more safety resources, including toolkits.
Related links:

Are we normal or average?

In the last few weeks I have gotten some questions and comments about using the term “normal”. In the field of applied climatology, the word “normal” has a specific meaning and refers to 30-year averages that are updated every decade. Currently we are using the 1981-2010 period for those calculations. Normals are one of the tools of trade for providing a benchmark or reference point to compare conditions at a particular time or to compare two or more stations. Other averaging periods or statistical methods can be employed in their place. For example, some utilities use a 10-year running average, updated every year, in their work. In some instances, especially if the distribution is not normally distributed, the median, or selected percentiles, may be more appropriate.
If you pull up dictionary.com or look in Webster’s Dictionary, the noun “normal” is defined as the mean or average. So in that sense, “normal”, “mean”, and “average” refer to the same thing.
Many people think of the adjective form of the word “normal”, which  means that it is the most common or usual case. However, the 30-year averages were not intended to be viewed that way. In fact, I sometimes joke that it is abnormal to be normal on the rare occasion when the temperature or precipitation exactly matches the normal value.
A more mundane issue is that in writing this blog I often report things like “the statewide average temperature was 2.3 degrees above normal”. If I used the word average instead of normal, it would be “the statewide average temperature was 2.3 degrees above average” which sounds very close to saying “the  … average was … above average”.
Or I could always use the longer and more complete term “the 30-year average updated every 10 years” in place of “normal”. While it is more precise, it gets to be awkward at times. Right now I’m leaning towards continuing with “normal” but give an explanation somewhere at the bottom of the post. This morning on the drive in I decided to try “long-term average” and see how that works.