Looking Ahead to Fall – Recent Temperature Changes and First Freeze Dates

As we approach the end of climatological summer, I have received several questions regarding the fall, harvest, and potential of an early freeze. In this post I try to address some of those concerns based on recent outlooks and both long-term and recent historical data.

Fall Outlooks

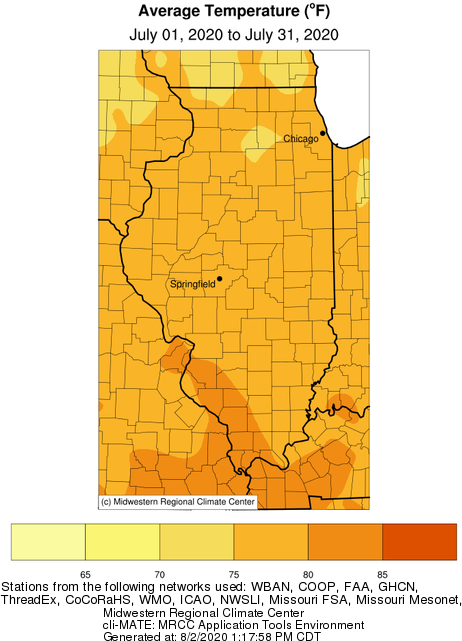
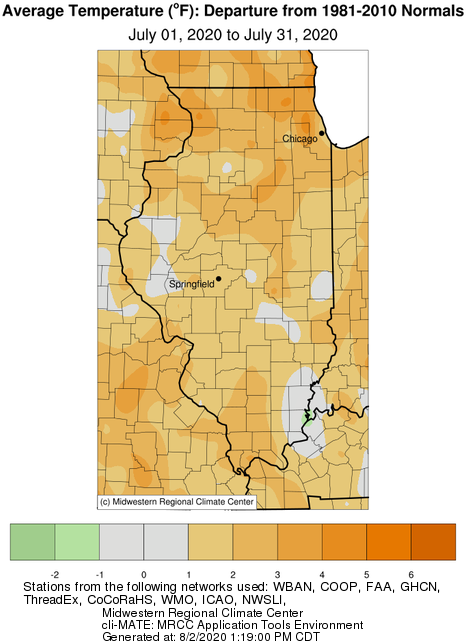
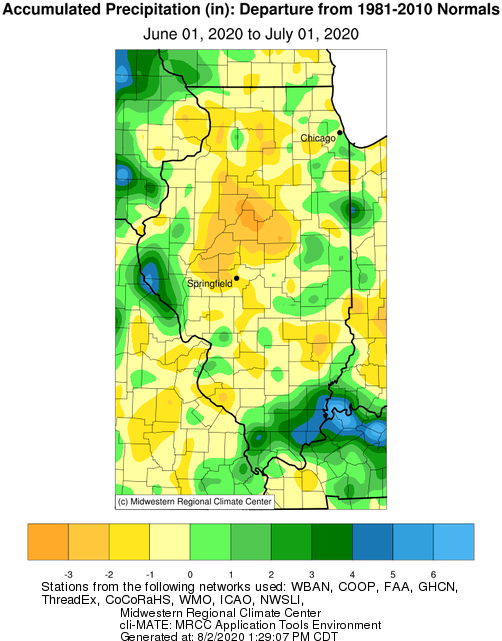
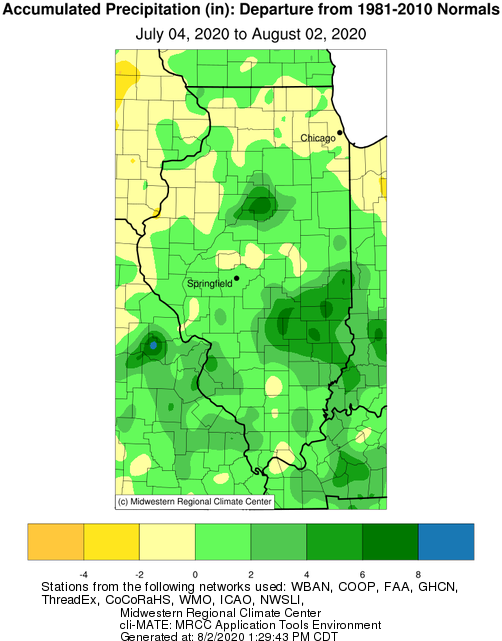
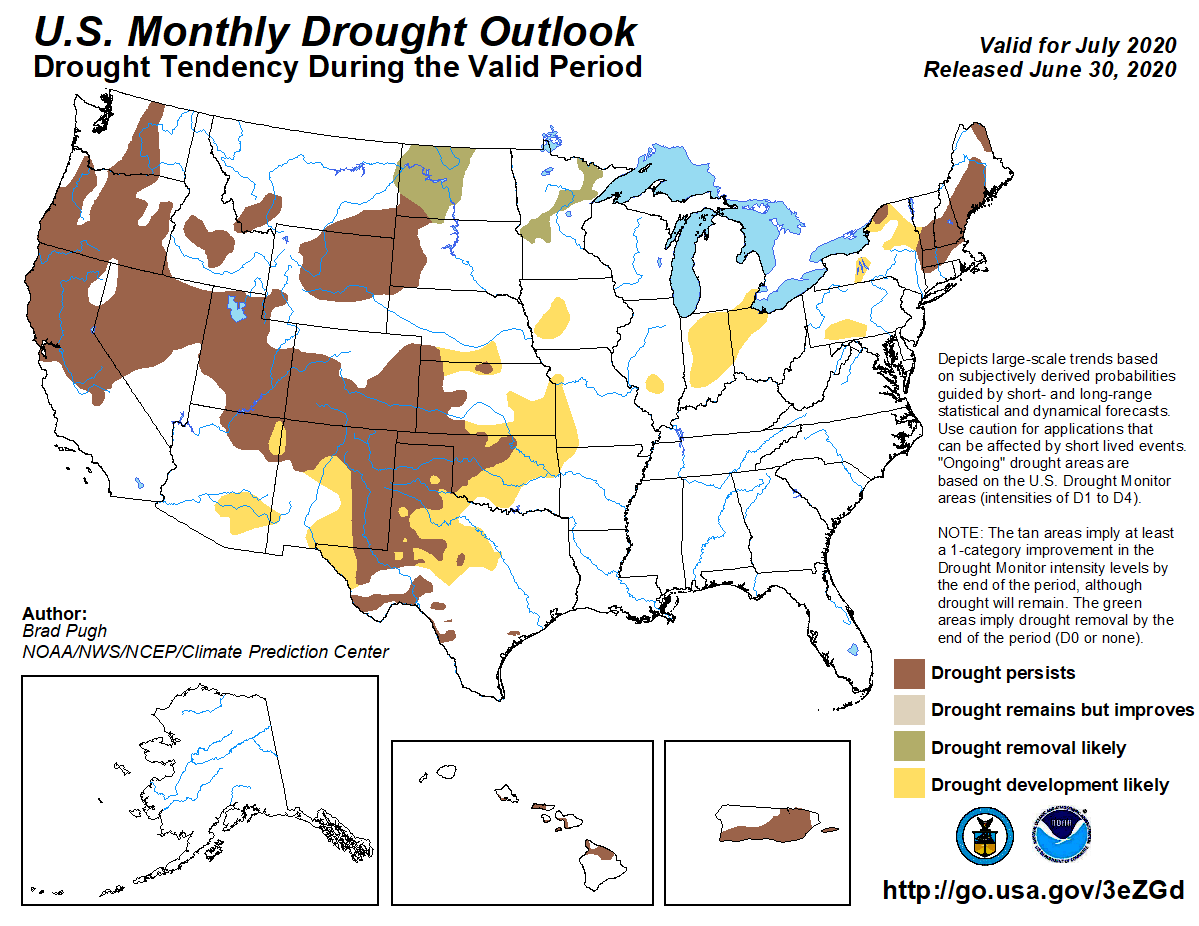
The most recent 3-month outlook from the Climate Prediction Center (CPC) was released on July 16 and covers August through October. Those outlooks show elevated odds of above normal temperatures over these three months, with equal chances of above normal, normal, and below normal precipitation (see maps below).

Much of the temperature outlook is based on the persistence of warmer than average weather from this summer, as well as sea surface temperatures and corresponding atmospheric conditions in the tropical and extratropical Pacific and Atlantic Oceans. However, another important contribution to these outlooks is from decadal trends in fall temperatures.

Fall Temperature Changes

Statewide, average temperature in climatological fall (September to November) has increased at a rate of 0.08 degrees (Fahrenheit) per decade between 1895 and 2019. However, fall warming has accelerated in recent decades. Over the past 30 years, the statewide average rate of fall temperature changes is 0.6 degrees per decade.

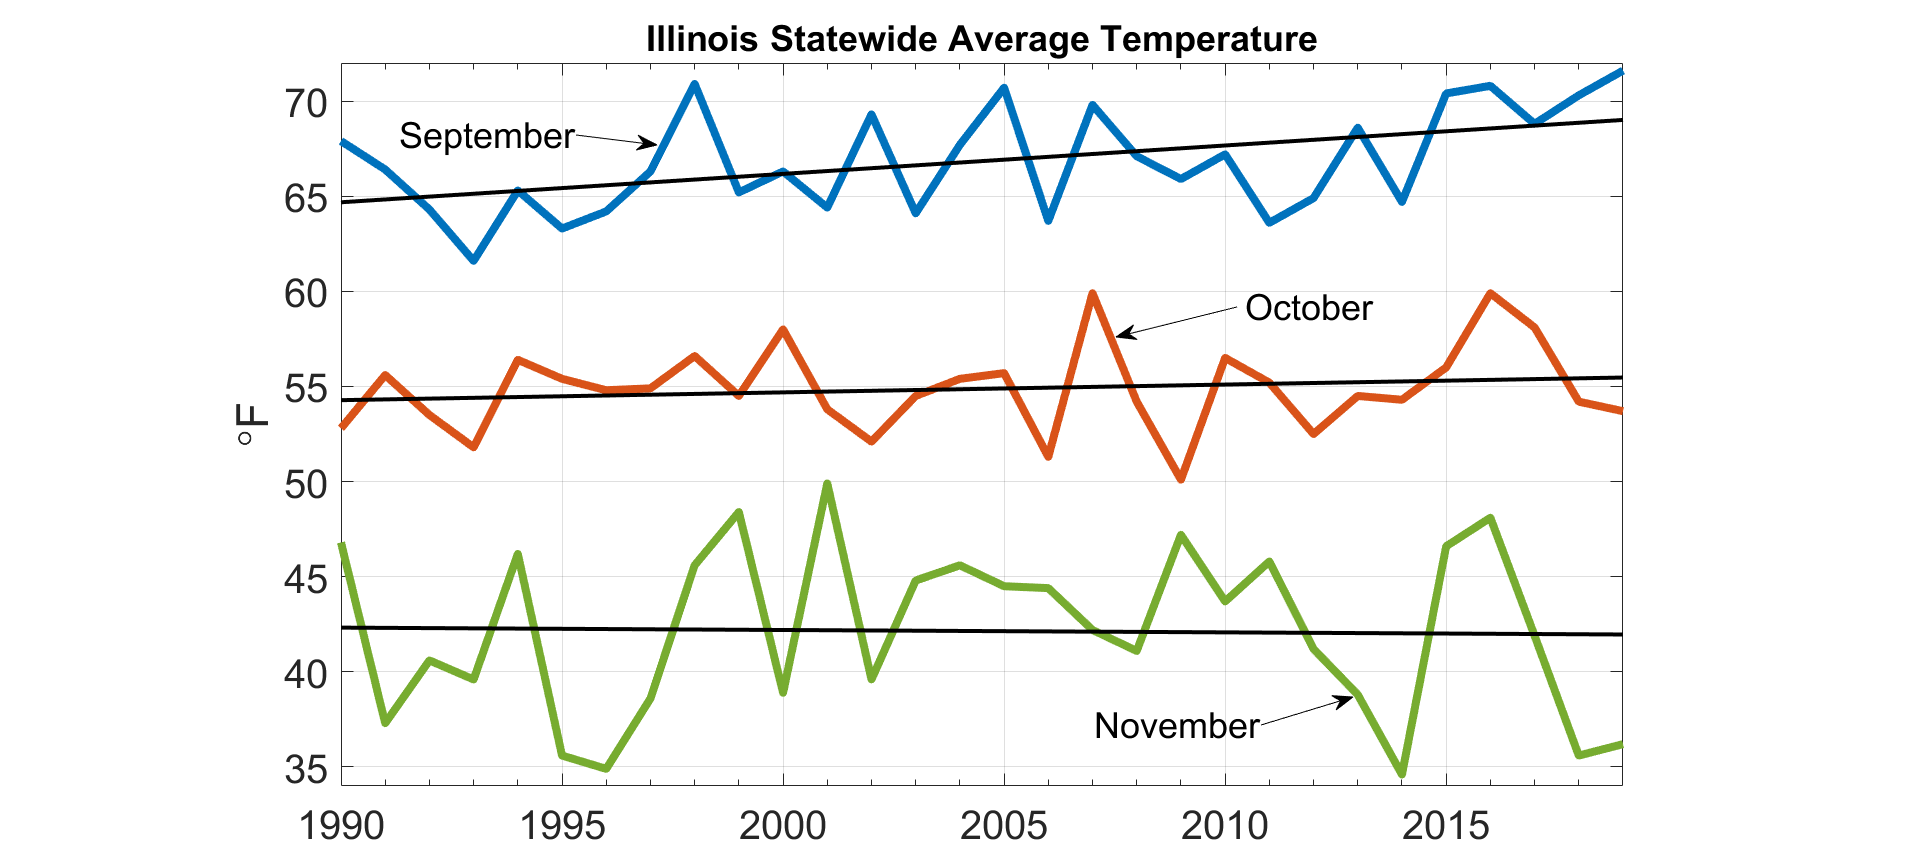
The plot below shows statewide monthly average temperature in September, October, and November between 1990 and 2019, with trends fitted to show recent temperature changes. September and October temperature have both increased over the past 30 years, whereas November temperature has decreased slightly. The largest magnitude of change is in September; over the past 30 years September average temperature in Illinois has increased at a rate of 1.5 degrees per decade.

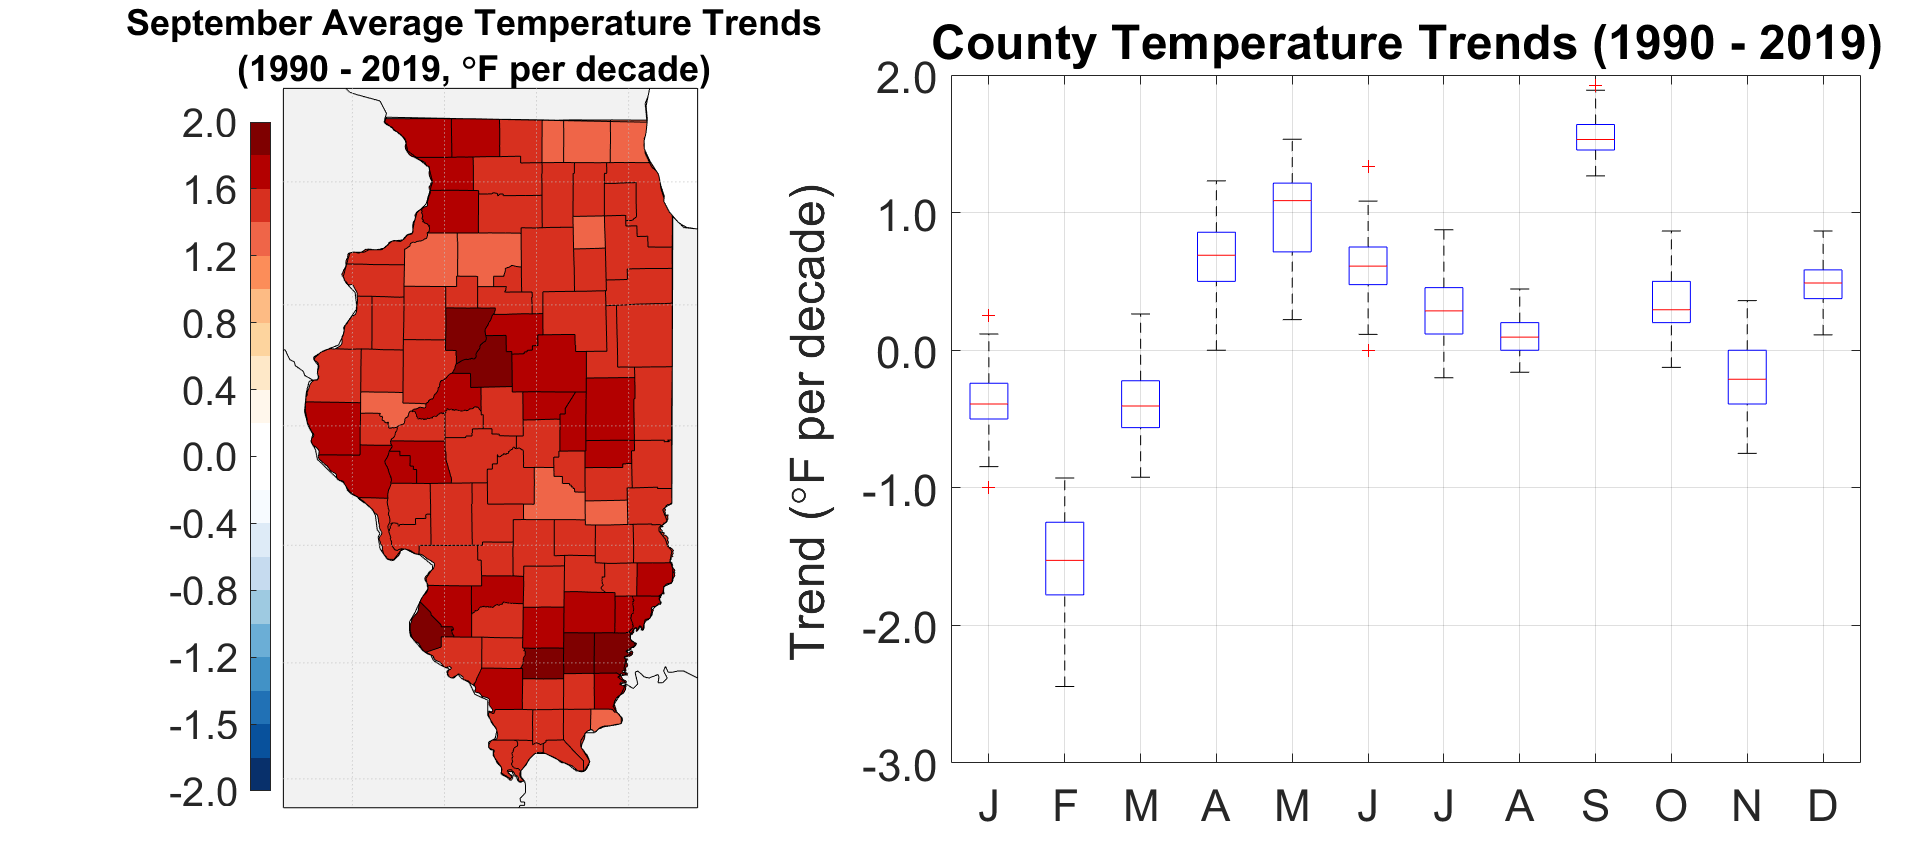
As the map below shows, all 102 Illinois counties have experienced a positive (i.e., warming) trend in September temperature over the past 30 years. From a different perspective, the figure next to the county map shows the distribution of all Illinois county temperature trends for each calendar month between 1990 and 2019.The boxplots show the range of temperature trends across all 102 counties for each calendar month. The boxplots clearly show that positive 30-year trends are largest in September, and all counties have a September temperature trend greater than or equal to 1.2 degrees per decade.

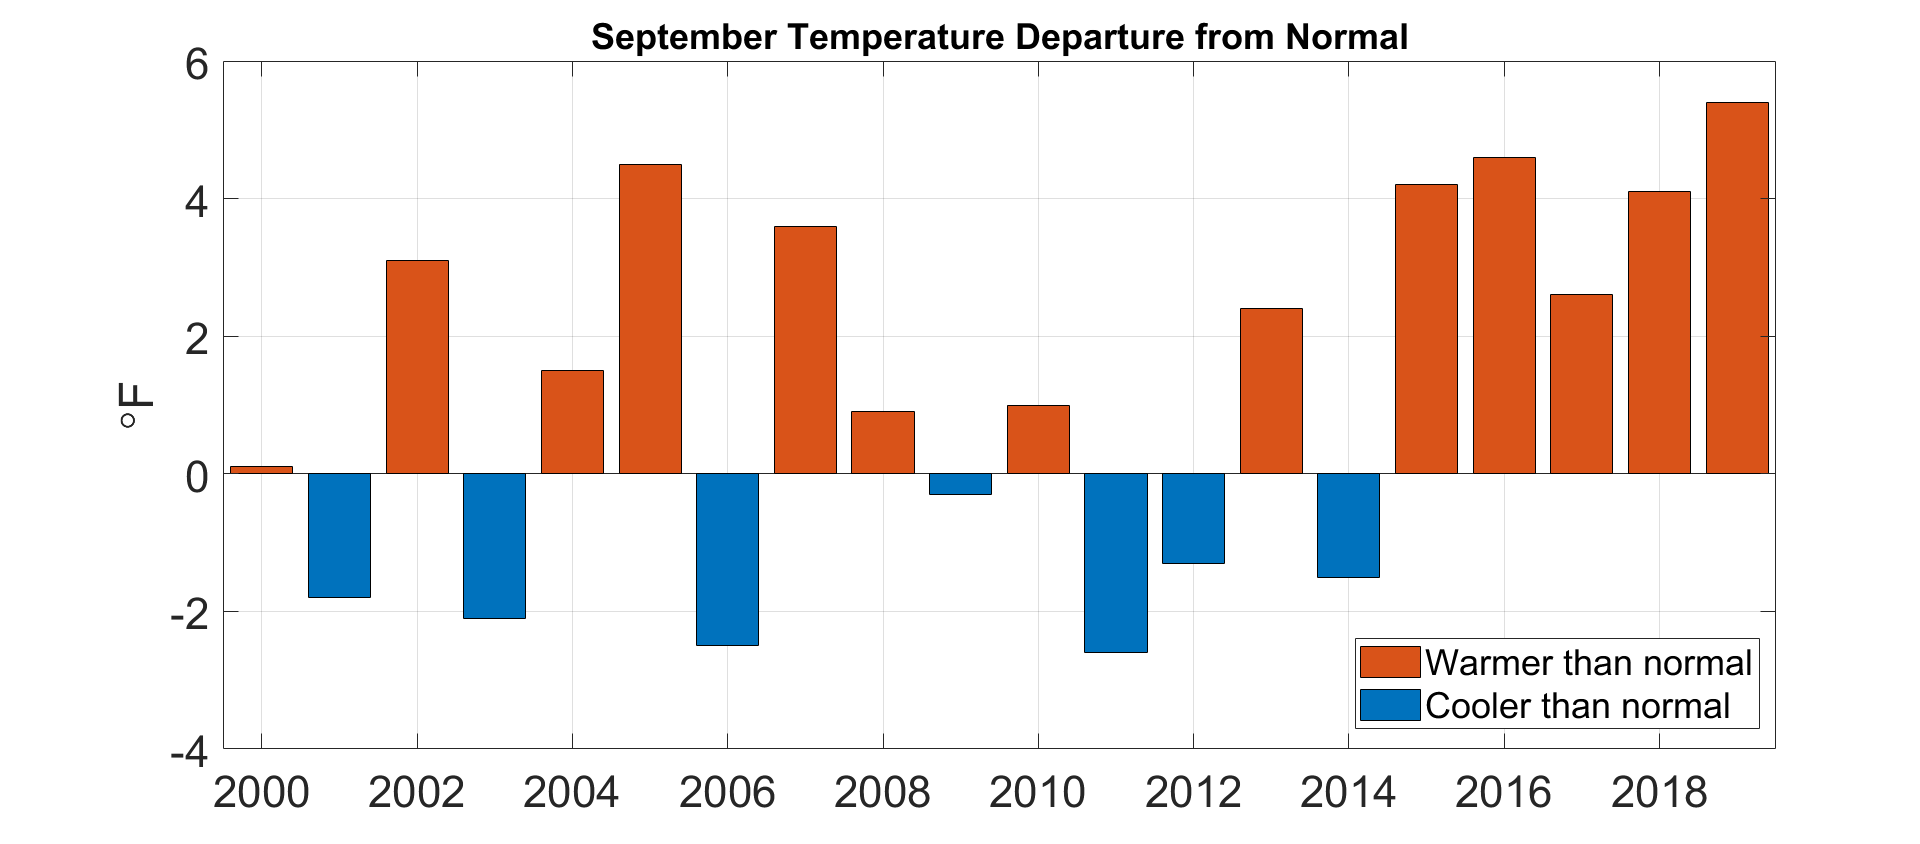
The plot below shows statewide September average temperatures between 2000 and 2019, depicted as a departure from the current (1981-2010) normal. The statewide average September temperature has been higher than the 30-year normal in 13 of the past 20 years, and each of the past five years. The average September temperature departure from the normal over the past five years is 4.2 degrees, and in four of the past five years, the September statewide average temperature has been closer to the August 30-year normal than the September normal.

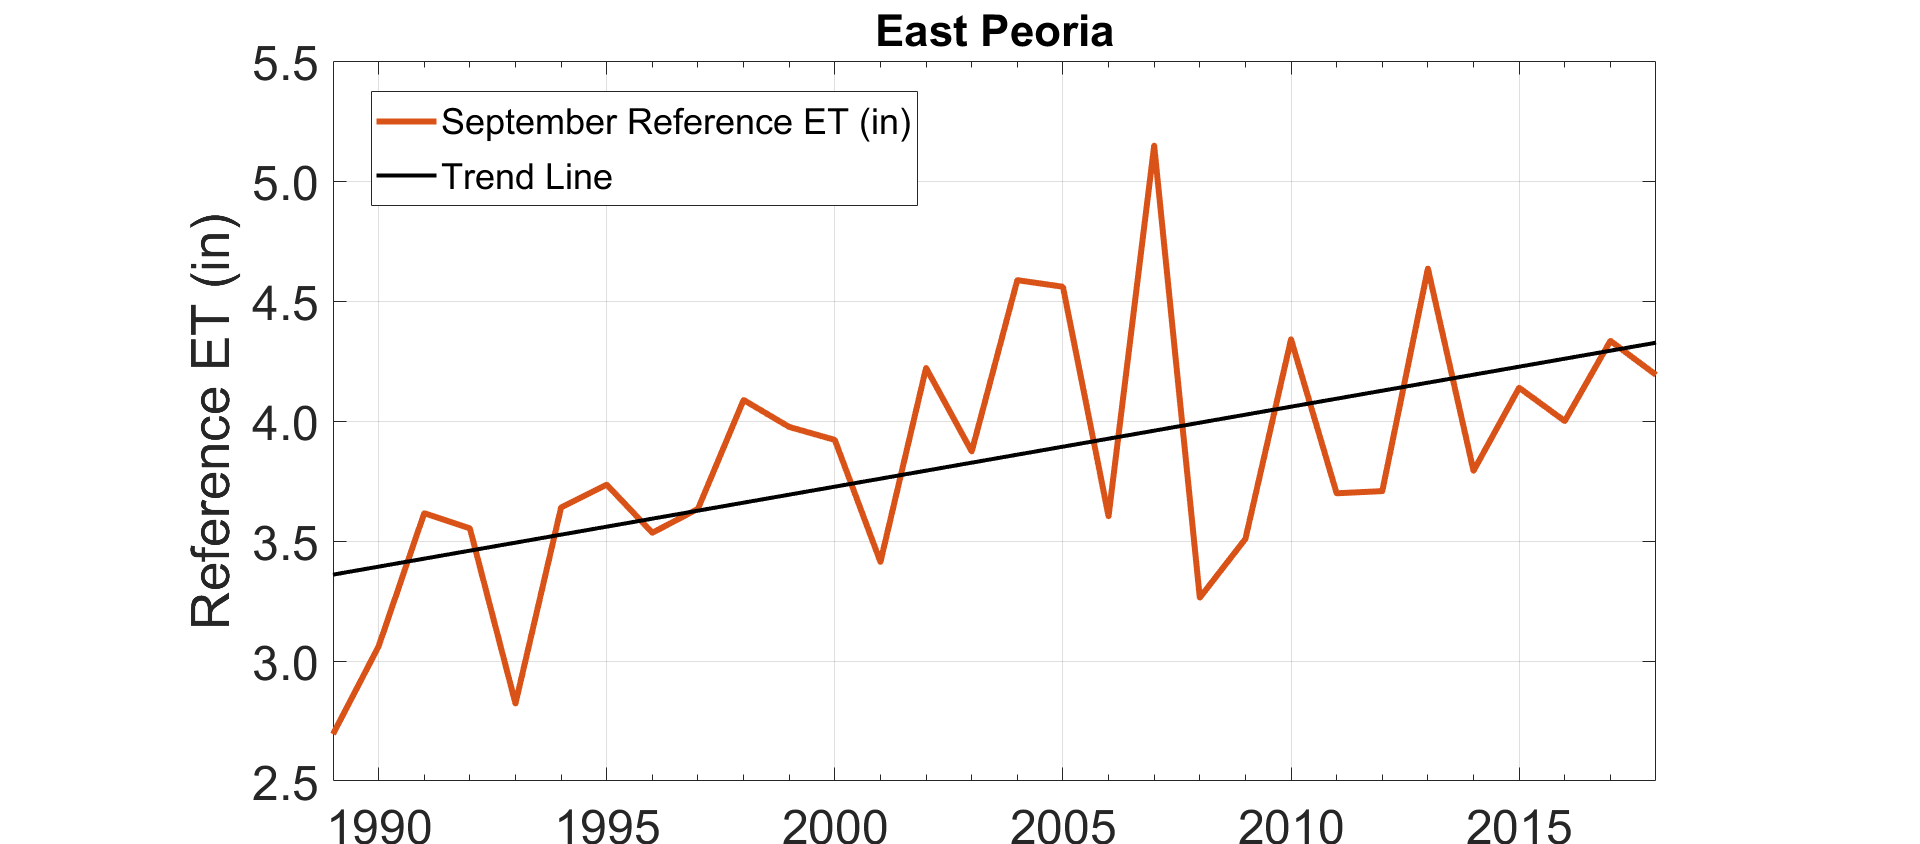
The figures and maps above agree with anecdotal evidence I’ve heard from folks around the state who have noticed recent Septembers have been unusually warm. This was particularly noteworthy last year, when a very warm September statewide was critical to help mature late-planted crops. However, higher September temperatures also increase atmospheric evaporative demand, which can intensify dry conditions. The plot below shows total September evaporative demand, represented by reference evapotranspiration (ET), estimated from measurements at the Illinois Climate Network station in East Peoria between 1989 and 2019. Reference ET in East Peoria has increased by 0.28 inches per decade between 1989 and 2019. All 19 Illinois Climate Network stations show similar evaporative demand trends over this time period.


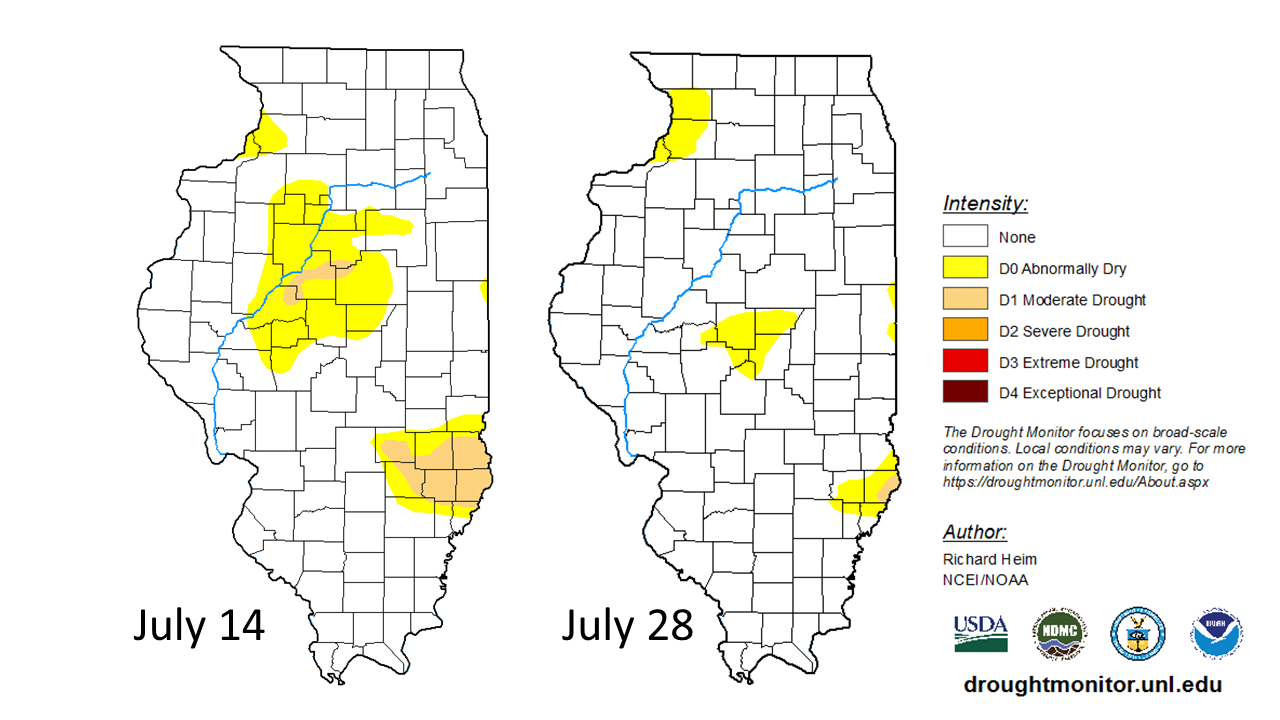
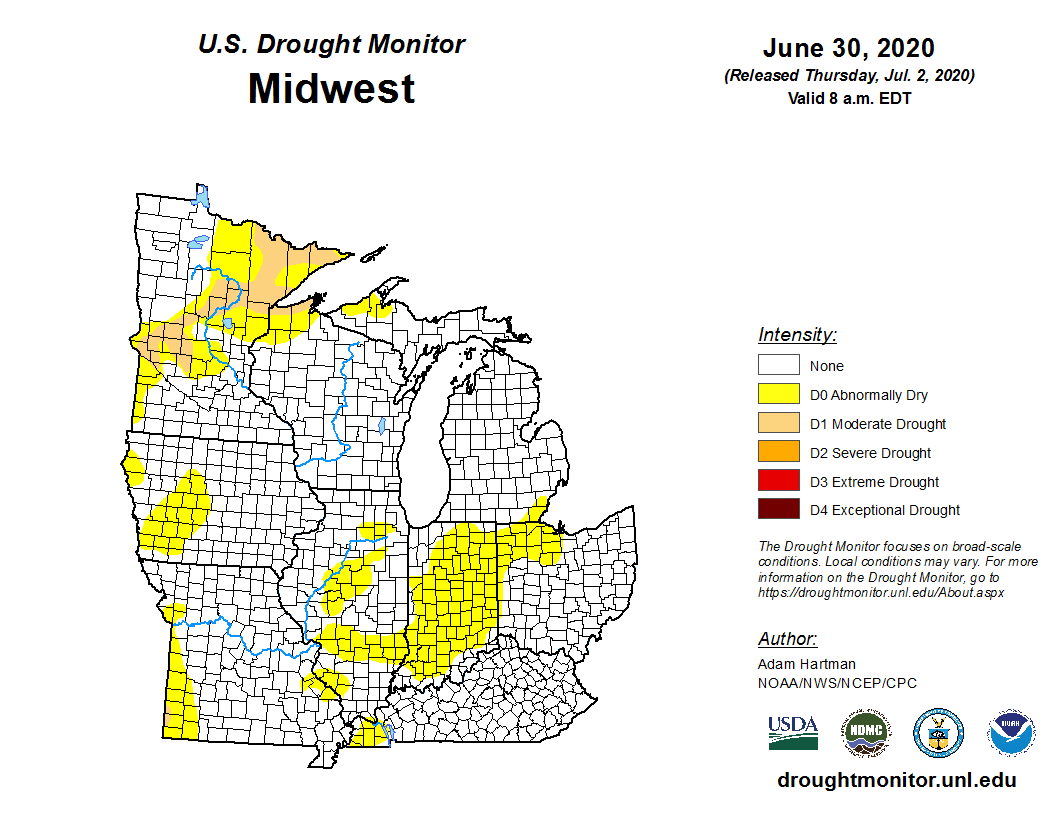
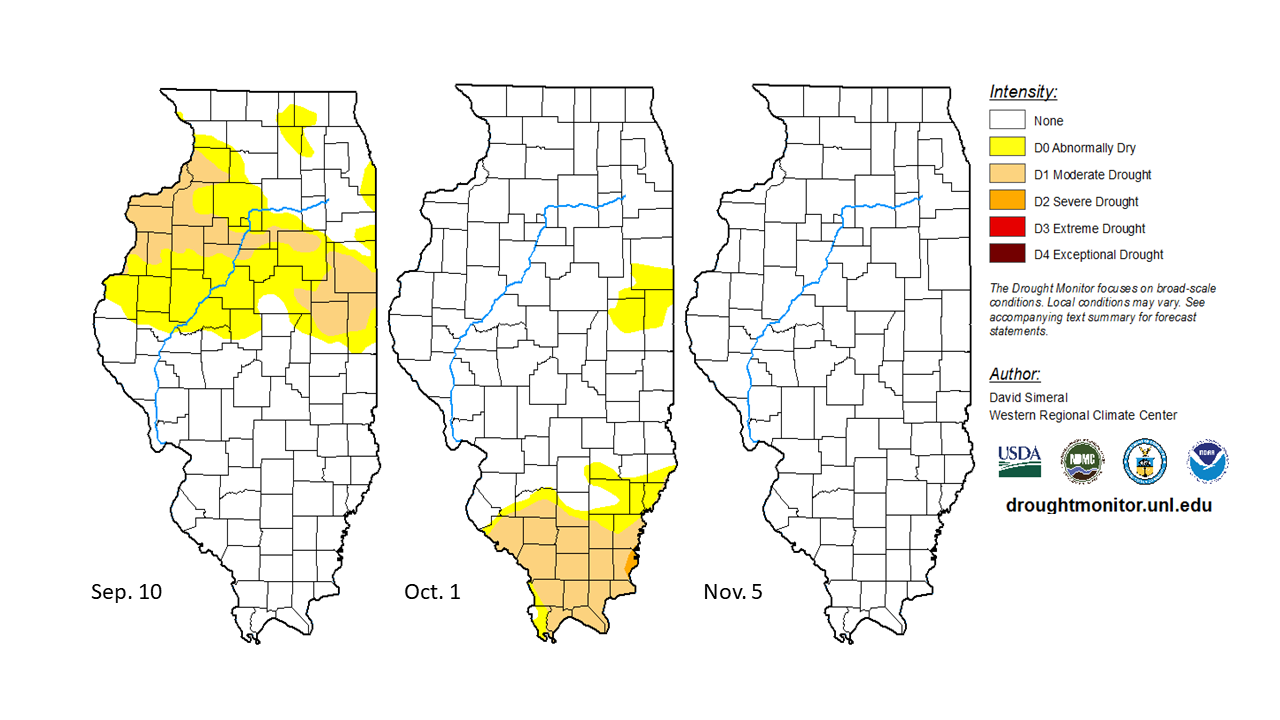
The importance of temperature and evaporative demand for drought played out in southern Illinois last year. Most counties south of Interstate 64 received 10 to 50 percent of normal September precipitation that combined with very high September temperatures to rapidly dry soil. The U.S. Drought Monitor maps below show the evolution of what could be called a “flash drought” last fall in southern Illinois, when many counties deteriorated from near normal conditions to severe drought in only three weeks. It is likely the drought in southern Illinois would not have intensified as quickly without the elevated September temperatures and high evaporative demand.

A consistent conclusion of recent climate assessments, including the 4th National Climate Assessment (https://nca2018.globalchange.gov/chapter/21/), is that increasing temperatures will exacerbate drought conditions, similar to what we witnessed last year in southern Illinois.

Fall Freeze Dates

Despite recent fall warming, studies have not consitently found a significant decrease in the frequency of very early fall freeze events in the central U.S. This may seem counterintuitive, but it provides a good example of the separation of variability and change. Daily, monthly, and inter-annual weather and climate variability exists on top of longer term change. Therefore, an early fall freeze is still very possible despite positive fall temperature trends. Thankfully, crops this year are much further along in their maturity than last year, so irrespective of fall freeze, there is overall less risk of crop damage. Still, as September approaches, it is a good time to review climatological fall freeze dates in Illinois.

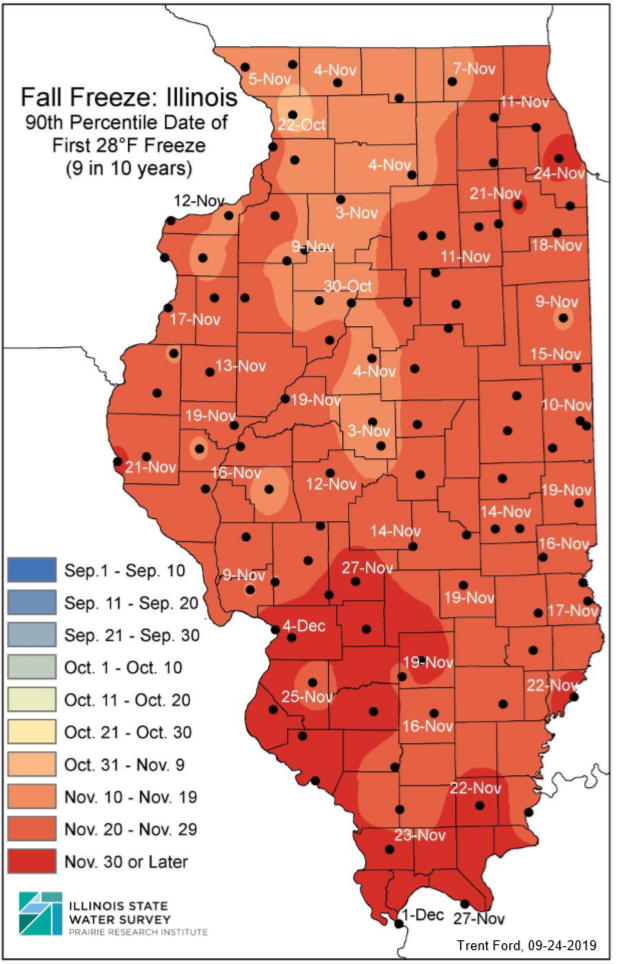
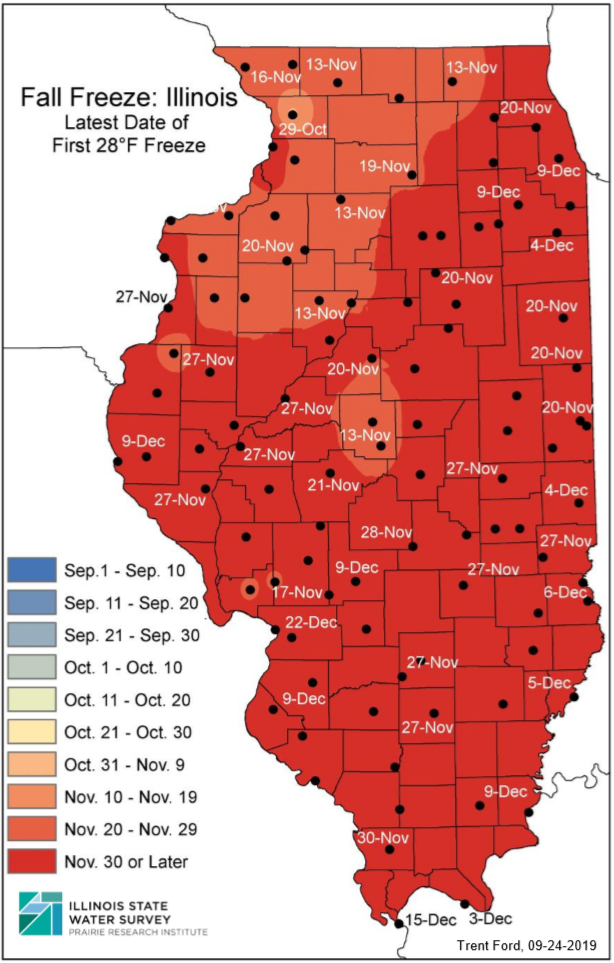
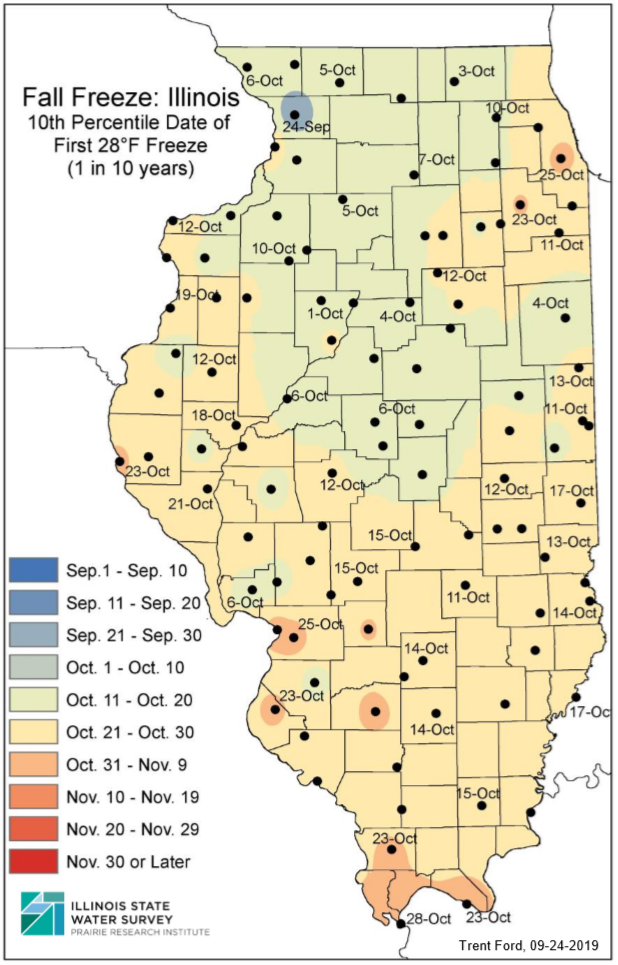
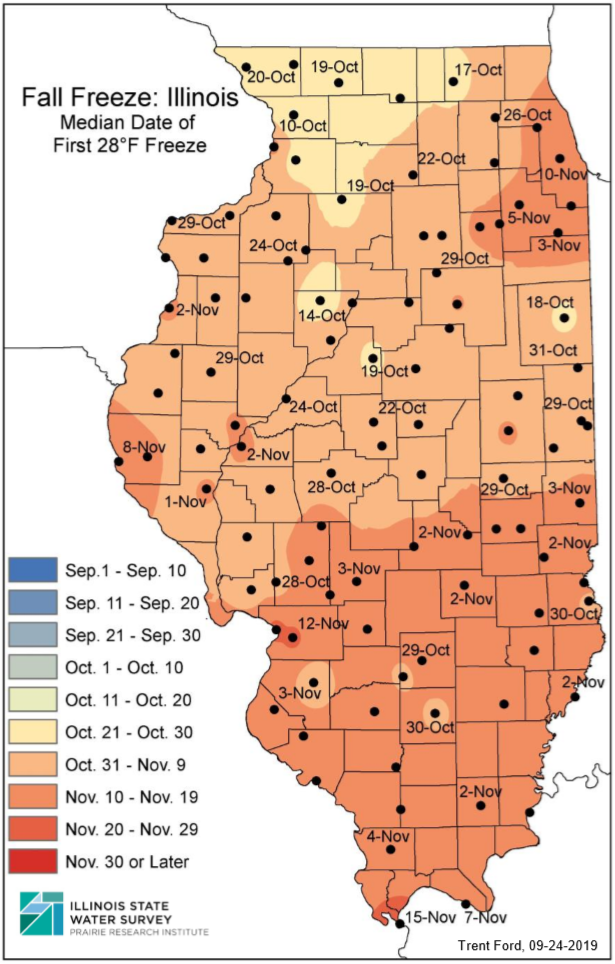
The maps below were created by the State Climatologist Office for a discussion on fall freeze dates last year (https://stateclimatologist.web.illinois.edu/2019/09/24/illinois-first-fall-freeze-climatology/). The maps show the climatological earliest and latest first fall freeze dates, the median date, and the dates which represent 1 in 10 and 9 in 10-year events. The climatological period is 1979 and 2018. Although 2019 data are not included, all areas of the state experienced their first fall freeze event within days of the climatological median, so the exclusion of 2019 will not drastically affect the numbers.

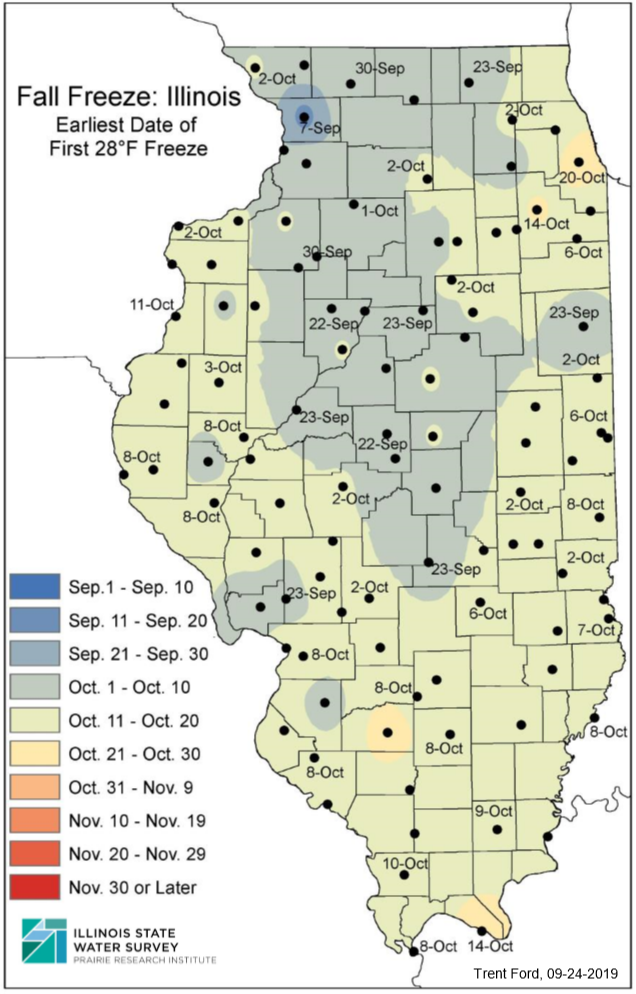
The earliest fall freeze dates over the past 40 years range from late September in northwest and central Illinois to early October in southern and eastern Illinois. The tenth percentile (i.e., 1 in 10 years) first fall freeze dates range from early October in northern and central areas to late October in southern Illinois. Median first fall freeze dates range from mid- to late October in northwest and central Illinois to early November in southern and northeastern Illinois.

The 90th percentile first fall freeze dates (i.e., 9 in 10 years) range from early November in northwest and central areas to mid- to late November in southern areas. One way to think about the 9 in 10-year maps is that 90 percent of all years in the climatological record have recorded the first fall freeze before that date. Finally, the latest first fall freeze dates range from mid- to late November in northwest Illinois to mid-December in southern Illinois.


Active July Continues a Warm Summer

July was warmer and wetter than average across Illinois, continuing a warmer than average summer season. The preliminary statewide average July temperature was 77.2 degrees, 1.8 degrees above the 30-year normal and tied for the 29th warmest on record. Preliminary statewide average total precipitation for July was 5.79 inches, 1.71 inches wetter than the 30-year normal and the 12th wettest on record.

Data are provisional and may change slightly over time

July Heat, Humidity

June was the 20th warmest on record statewide, and above average temperatures persisted throughout the month of July. The figure below shows daily maximum and minimum temperatures between June 1 and July 30 in Champaign. The Champaign COOP station recorded 36 consecutive days with a daily maximum temperature above 80 degrees, a streak that ended on July 30. The longest streak of 80+ degree days on record in Champaign is 74, between June 19 and August 31, 1959.

To show the persistence of warm weather last month, the plot below shows daily average temperature departures from normal in Rockford. Only five July days exhibited a daily average temperature below the 30-year normal, and those days were only 2 to 3 degrees below the daily normal.

The elevated temperatures last month were accompanied by abundant humidity because of persistent atmospheric flow off from the Gulf of Mexico and actively transpiring crops. The heat index combines the effects of temperature and humidity to better represent how humans feel hot, humid weather. The daily average heat index value in Belleville this last month was 87.2 degrees, which was the second highest July average heat index value on record, after 2011.

Overall, July temperatures ranged from the mid-70s in northern Illinois to the mid-80s in southern Illinois, between 1 and 5 degrees above average. The preliminary statewide average July temperature was 77.2 degrees, 1.8 degrees above the 30-year normal and the 29th warmest on record. Last month, one daily high maximum temperature record and two daily high minimum temperature records were broken.

Severe Weather

The abundant heat and humidity made for a very active severe weather month in July. The NOAA Storm Prediction Center reported 10 tornado, 22 hail, and 154 wind reports in Illinois during July. This follows a very inactive severe weather month in June, with only 1 tornado and 10 hail reports statewide. Although areas of the state needed the rain that accompanied severe thunderstorms last month, several producers reported widespread crop damage from hail and strong winds.

Rain for All, Too Much for Some

As the two maps below show, June was very dry for areas of central and southeast Illinois. For example, Morton in Tazewell County received only 0.50 inches of rainfall in June, approximately 15 percent of normal. In contrast, July was wetter than normal for most of the state, and areas of central and southeast Illinois received 4 to 6 inches more than normal July rainfall.

The station at the Peoria airport recorded 5.15 inches in just six hours on July 15, marking the highest six-hour rainfall total on record in Peoria, with the record going back to 1948. This event is approximately a 50-year event based on estimates from the Illinois State Water Survey’s newly release Bulletin 75 study (https://www.ideals.illinois.edu/handle/2142/106653). This means there is a 2% chance of exceeding this six-hour total in Peoria each year.

Twenty-four-hour rainfall totals from this event exceeded 6 inches in parts of Tazewell and Woodford Counties, resulting in widespread flash flooding in agricultural and residential areas. The station in Minonk in Woodford County, for example, recorded 6.50 on July 15. This day, along with a 9-inch rainfall observation in September of last year, are the only two days in Minonk’s 125-year record with more than 6 inches of rainfall observed.

Heavy rain in central and southeast Illinois alleviated acute dryness that continued from June and the first half of July. The maps below show U.S. Drought Monitor conditions as of July 14 and 28, showing the reduction in moderate drought (D1) and abnormally dry (D0) categories in central and southeast Illinois in response to the rain.

July total precipitation ranged from over 13 inches in central and eastern Illinois to less than 2 inches in the northeast. Overall, statewide July total precipitation was 5.79 inches, 1.71 inches wetter than the 30-year normal and the 12th wettest on record. Single-day precipitation total records were broken at 88 stations across the state last month. Five of those stations broke the July all-time daily precipitation records. Last month was also the wettest July on record at Casey in Clark County, Minonk in Woodford County, and Clay City in Clay County; all three stations have records exceeding 70 years.

Outlooks

Temperatures have been quite moderate  at the start of August. However, short-term 8- to 14-day outlooks from the NOAA Climate Prediction Center suggest the heat may return later this month, with elevated odds of above normal temperatures in the second week of August. The state is also covered with slightly elevated odds of wetter than normal conditions over the same time period.

Despite the short-term outlook, one-month outlooks indicate elevated odds of below normal temperatures for August as an entire month, with the strongest odds of near-normal precipitation.


A Mostly Warm, Dry Start to Summer

June was warmer and drier than average across the state. The preliminary statewide average June temperature was 73.7 degrees, 1.8 degrees above the 30-year normal and tied for the 26th warmest on record going back to 1895. The preliminary statewide average total June precipitation was 3.70 inches, 0.51 inches below the 30-year normal and the 48th driest on record.

Data are provisional and may change slightly over time

Persistent Above Average Temperatures Last Month

June was warmer than normal for most of the northern two-thirds of the state following a warm end to May. June average temperatures ranged from the high 60s in northern Illinois to the high 70s in southern Illinois. In the northern part of the state, June was 1 to 6 degrees warmer than normal, with the highest departures in northern and northeast Illinois.

The highest temperature recorded in Illinois last month was 99 degrees in Cook County on June 20. In contrast, a few cloudless nights following a strong cold front in the middle of the month resulted in several stations recording minimum temperatures in the 40s, including 43 degrees in McHenry County on June 15.

Overall, 20 daily high maximum temperature records were broken last month, including a 148-year-old daily maximum temperature record on June 2 at Rock Island Lock and Dam. High humidity throughout the state also resulted in 31 daily high minimum temperature records broken last month, including a daily record 76-degree minimum temperature in Olney on June 10.

The station at Chicago’s O’Hare airport only recorded six days in June with an average temperature below the long-term daily mean (see plot below). The average June temperature at O’Hare of 74 degrees tied 2012 for the second warmest on record, following only the 74.2-degree average of June 2005. The June average daily maximum temperature at O’Hare was 84 degrees, which was the sixth highest on record. It should be noted that the O’Hare temperature record only goes back to 1958, and therefore does not include the 1930s during which most summer high temperature records were set in Illinois.

Because of the heightened influence of the land surface on temperature during the summertime in Illinois, monthly precipitation and air temperature (particularly daily maximum temperature) are often negatively correlated. Drier summer months tend to result in reduced soil moisture, which can also decrease evaporation and increase air temperature. This is why the driest summers (think 1988, 2005, 2012) are also frequently the warmest summers. The graph below shows the total June precipitation on the x-axis and average daily maximum June temperature on the y-axis, both from the station at O’Hare. Each scatter point represents a calendar year from 1959 to 2020. In general, wetter Junes correspond with lower maximum temperatures in Chicago. However, despite last month being slightly wetter than average in Chicago, it was much warmer than average.

The added heat last month helped crops progress after well below normal temperatures in May. However, base 50 growing degree days since April 1 are still below normal across the state and well below normal in southern Illinois.

June: Dry for Most, Very Wet for Some

Most summer precipitation in Illinois comes from local- to meso-scale systems, such as convective thunderstorms. These storms can produce large precipitation totals over short time periods but typically only affect a small geographic area. This can result in a “have and have not” summer precipitation pattern, which is what occurred last month.

The June total precipitation ranged from over 8 inches in parts of western and east-central Illinois to less than an inch in central and south-central Illinois. The totals represented between 200 percent and less than 25 percent of normal June precipitation. For example, only 60 miles separates COOP stations in Fisher in Champaign County, which recorded over 8 inches of precipitation in June and Morton in Tazewell County, which recorded just 0.52 inches in June.

High humidity and active large-scale atmospheric patterns resulted in several instances of thunderstorm-driven heavy precipitation across the state last month. Six stations recorded single-day precipitation totals of over 4 inches. This included 4.48 inches of rainfall recorded in West Frankfort in Franklin County, which was the seventh highest single-day total since precipitation observations began at that station in 1972. Heavy precipitation in Adams and Pike counties resulted in two different flash flood warnings, one on June 21 and a second on June 30.

In contrast to the few areas of wet extremes last month, most of the state was drier than normal, including a few areas with less than 25 percent normal June rainfall. The station in Highland in Madison County experienced their driest June on record going back to 1977. Incredibly, the same station in Highland recorded nearly 3.5 inches more precipitation than normal in January and May of this year and, despite the very dry June, is still well above 100 percent of normal precipitation for the first six months of the year. Thankfully, this station also recorded over 2 inches of rainfall on July 1, helping reduce some of the dryness from the previous month.

Below normal precipitation and declining soil moisture resulted in the U.S. Drought Monitor identifying abnormally dry (D0) conditions at a number of areas in the state, most notably in south-central and central Illinois. It is important to note that at this time the conditions in these marked areas are considered only abnormally dry and not officially in drought.

Outlooks

Short-term 8- to 14-day outlooks from the Climate Prediction Center show strongly elevated odds of above normal temperatures across the state through the middle of July.

The early to middle part of July is, climatologically, the hottest time of the year in Illinois, and this outlook suggests temperatures will be above the climatological normal. Accordingly, the Climate Prediction Center is indicating a moderate risk of excessive heat over the same period between July 8 and 14 for most of the state.

Similar to what we experienced in June, the high temperatures will likely be coupled with very high humidity, resulting in hazardous conditions that increase the risk of adverse human and animal health outcomes.

The precipitation outlook over the same time period indicates slightly elevated odds of drier than normal conditions in Illinois.

Given that the 8- to 14-day outlooks tilt toward persistence of warm, dry weather to start July, dry conditions in central and south-central Illinois likely will worsen before they are alleviated. The July U.S. Monthly Drought Outlook indicates likely drought development in south-central Illinois in response to expected dry conditions, exacerbated by elevated evaporation due to high temperatures.

Longer-term 30-day outlooks from the Climate Prediction Center show continued elevated odds of warmer than normal conditions through the entirety of July. Precipitation outlooks indicate slightly elevated odds of wetter than normal conditions for July as a whole, hopefully reducing the potential for drought development this month.

Very Dry June (so far)

Four out of the first five months of 2020 have been wetter than normal. As the map below shows, most of the state, entered June with a calendar year precipitation surplus of 2 to 10 inches.

However, more recently rain has been scarce in most of the state. Ironically, the driest area in the state through May has received abundant June precipitation, while most other areas have seen less than 1.5 inches of total June precipitation (through the 21st). In areas of southwest and south-central Illinois, totals so far represent less than 25% of average precipitation by this time of June, including the driest first 21 days of June on record in Pinckneyville in Perry County.

Three full weeks with little to no precipitation and increased evaporative demand has resulted in depletion of surplus soil moisture in many places around the state. The plot below shows 8-inch soil moisture observations at the Illinois Climate Network (ICN) station in DeKalb. The thick, red line shows the daily evolution of soil moisture in DeKalb between June 1st and 22nd of this year, with respect to all other record years back to 2003. I denoted soil moisture conditions during other, noteworthy dry years in northern Illinois. In general, the plot shows the rapid decline in soil moisture in response to dry, warm conditions this month.

For a broader view of soil conditions the maps below show soil moisture on June 21st from all ICN stations at 4, 8, and 20 inches (from left to right). Generally speaking, observations exceeding 0.35 to 0.40 indicate saturated or nearly saturated conditions, while observations in or below the teens indicate conditions at or approaching the wilting point. Not surprising, 4 inch and 8 inch soils have dried quite a bit more than the 20 inch soil; however, nearly all stations are still drier than average for this time of the year at 20 inches.

Early summer is a challenging time to experience moisture deficit, both because crops and other vegetation are actively growing and because evaporative demand and evaporation tend to increase as temperatures continue to rise into July. However, the 7-day forecast indicates potential for rainfall to alleviate some dryness in northeast and east-central Illinois. There is less of a chance of reprieve from dryness for southern Illinois over the next week.

At the same time, the 6- to 10-day and outlooks from the Climate Prediction Center indicate elevated odds of wetter than normal conditions through the end of June and into July.