Who ordered winter? The cold season came with a vengeance in February, bringing bitter cold and snow across the state. The preliminary statewide average February temperature was 20.0 degrees, 11.1 degrees below the 1991–2020 average and the 10th coldest on record going back to 1895. Preliminary statewide average total February precipitation was 2.01 inches, 0.10 inches below the 1991–2020 average and tied for the 51st wettest on record going back to 1895.
Data are provisional and may change slightly over time
February Can Still Be Cold
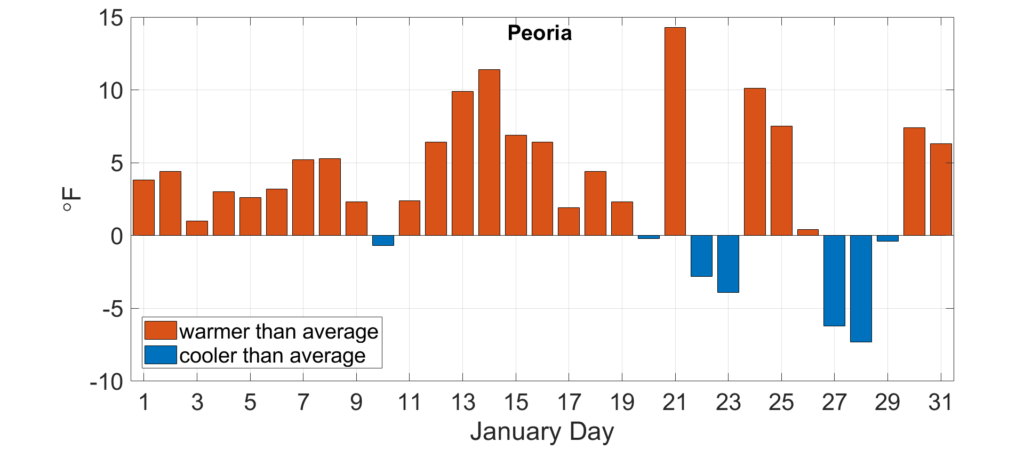
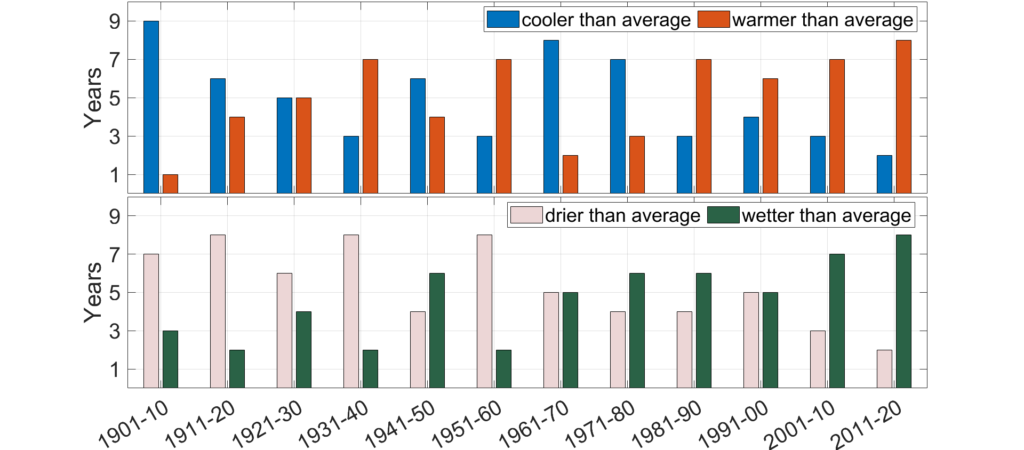
Winter average temperatures in Illinois have increased by 0.20 degrees per decade since 1895 and by 0.80 degrees per decade since 1970. Two thirds of the 2020-21 winter season followed this pattern, but February did not abide. The plot in Fig. 1 shows daily February temperatures as a departure of the 1981–2010 normal in Monmouth. Average temperatures on all but one day between February 7 and February 18 in Monmouth were at least 25 degrees below the 30-year normal, and many were more than 30 degrees below normal. Most places in Illinois experienced at least 20 days of below normal temperatures in February, following fewer than 20 days with below normal temperatures in January and December combined.
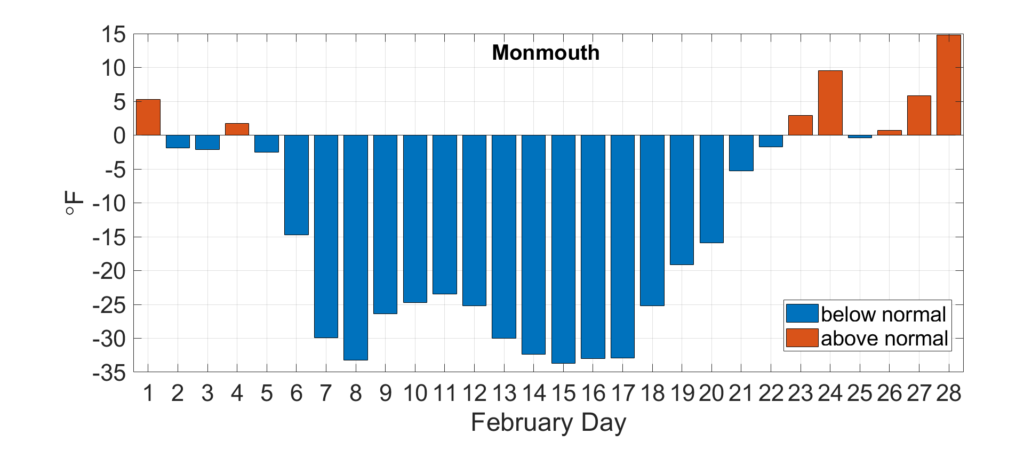
Figure 1. Daily temperatures in Monmouth, expressed as a departure from the long-term average.
The extreme cold broke 218 daily low maximum temperature records and 81 daily low minimum temperature records at stations around Illinois, from Galena to Cairo. No February low maximum and minimum temperature records were broken last month. However, among stations with at least 30-year records, last month was the coldest February on record in Dixon, Du Quoin, Olmsted, Carmi, and Mt. Vernon. Some of the most extreme observed temperatures include -21 degrees in Altona and Mt. Carroll, -17 in Aurora, and -15 in Moline.
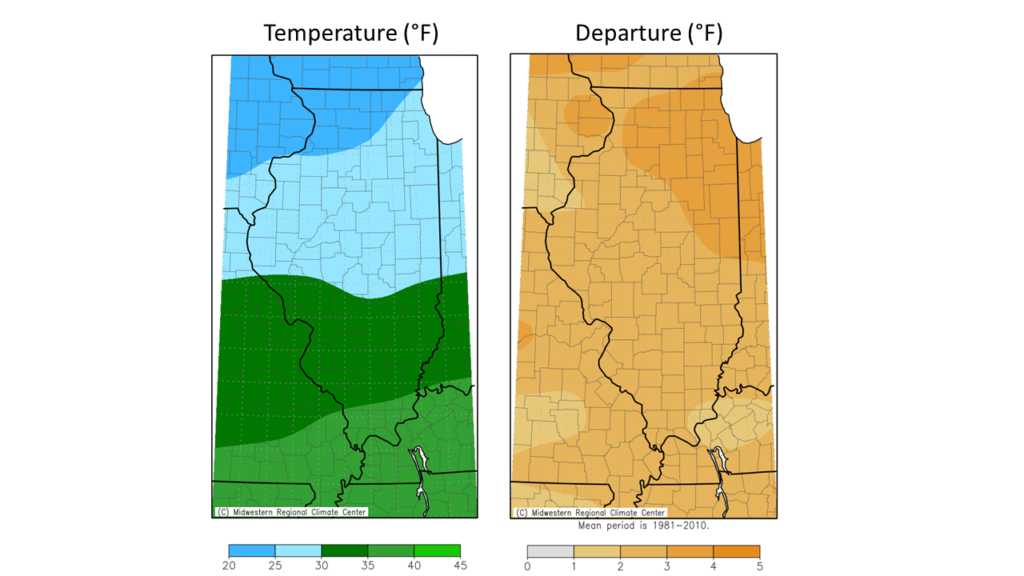
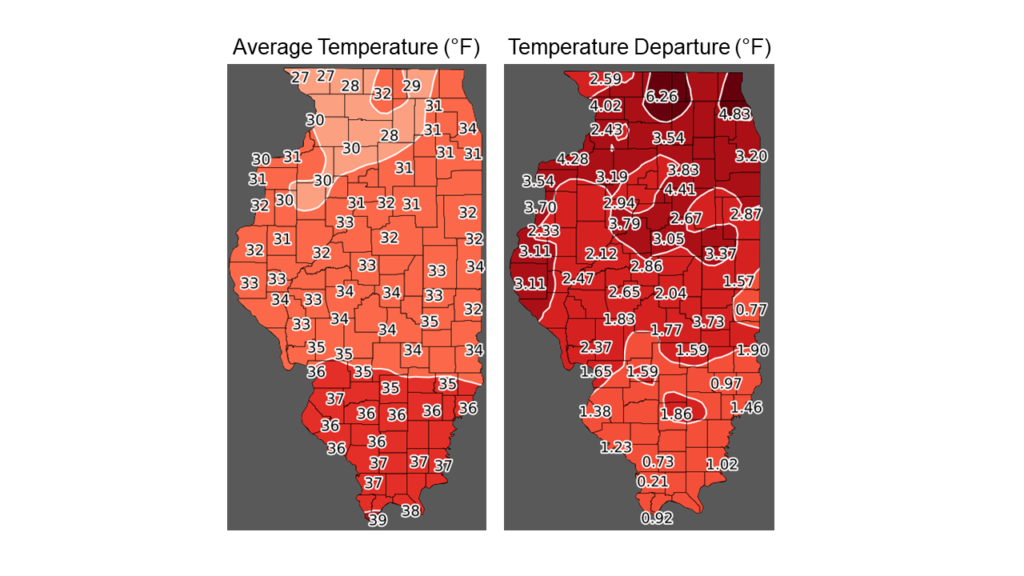
As the maps below show, February average temperatures ranged from the low teens in northwest Illinois to the high 20s in southern Illinois, which was between 8 and 14 degrees below the 1981–2010 normal (Figure 2). The two-week stretch during February 6–20 exhibited temperatures between 18 and 25 degrees below the 1981-2010 normal across the state.
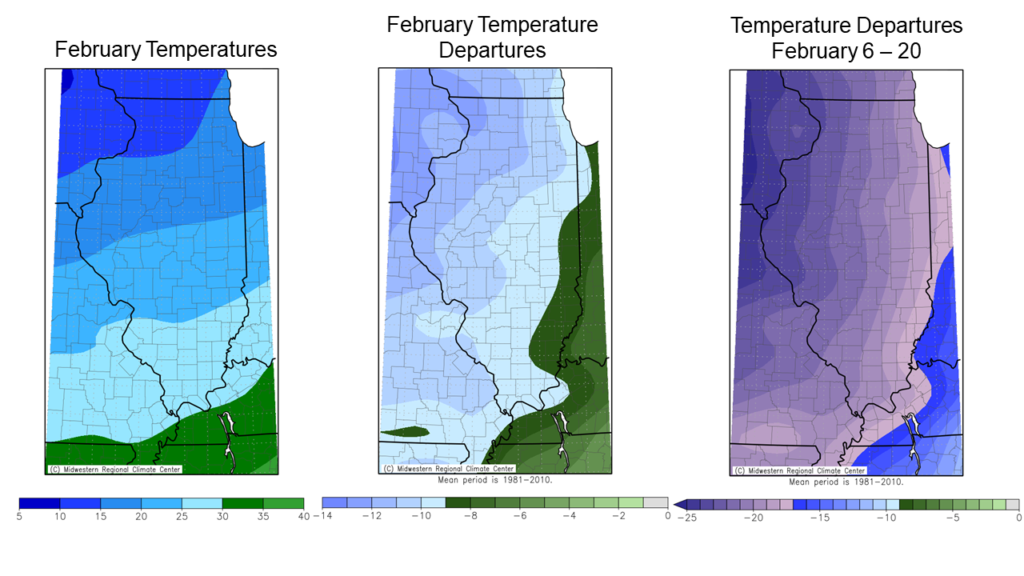
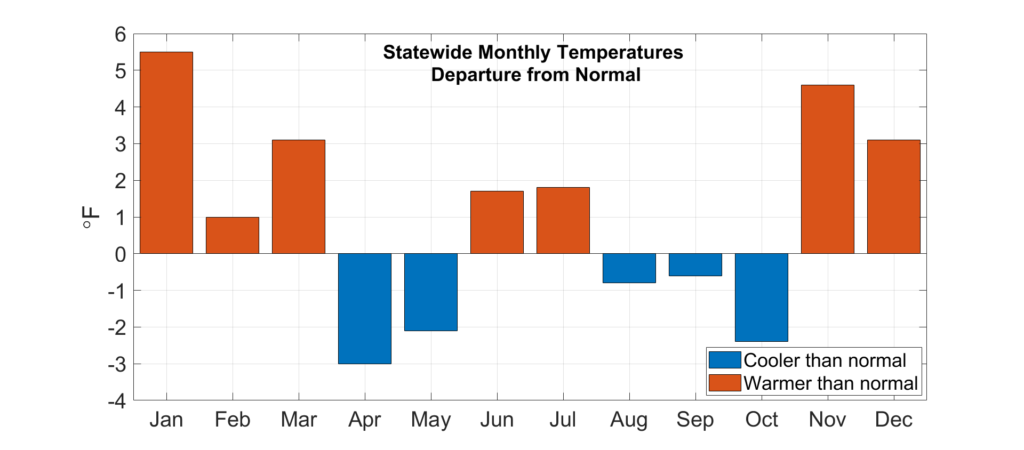
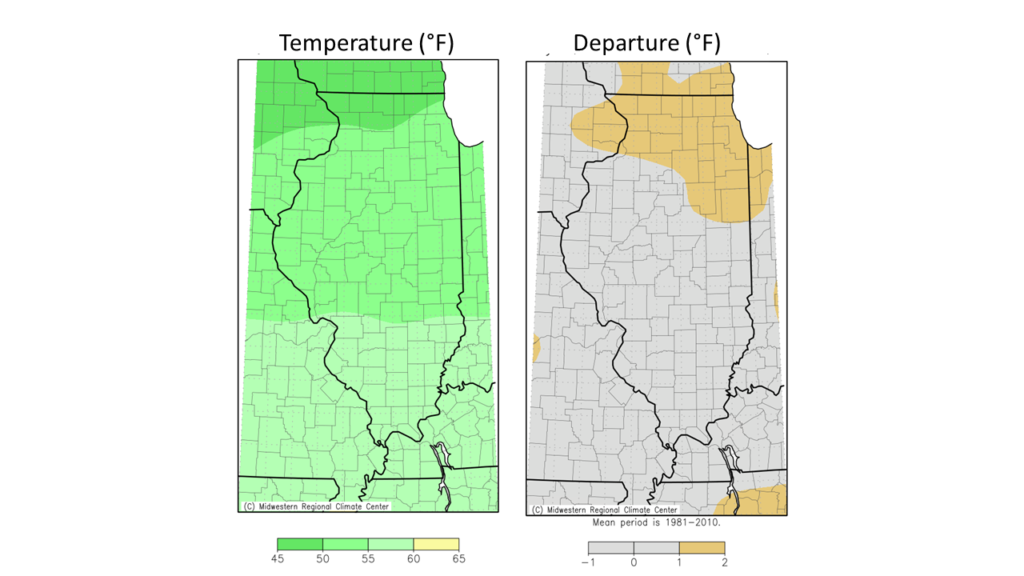
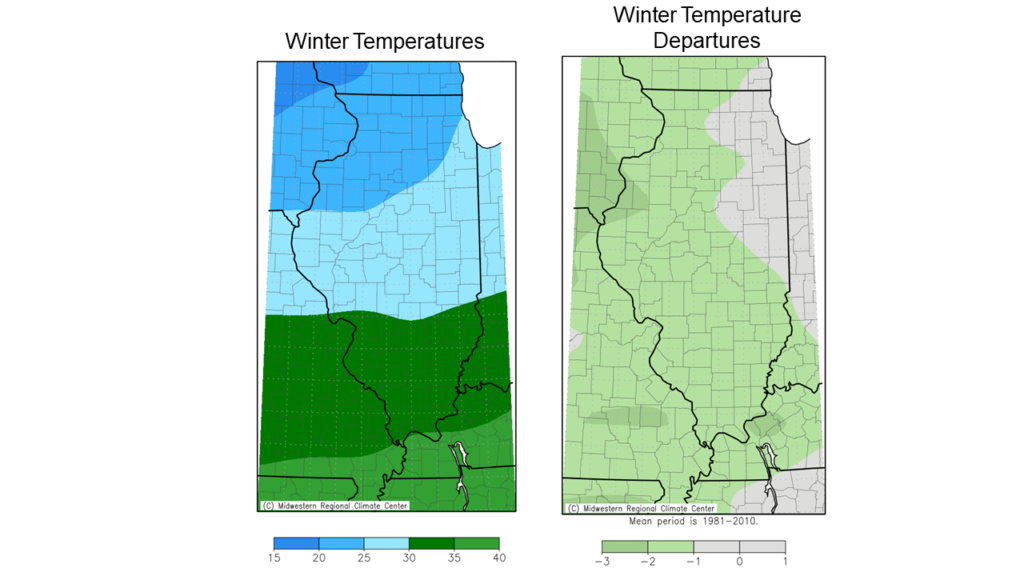
The preliminary statewide average February temperature was 20.0 degrees, 11.1 degrees below the 1991-2020 average and 10th coldest on record going back to 1895. February propelled the 2020-21 winter season temperatures below the 1981-2010 normal, despite a warmer than normal January and December. Winter average temperatures ranged from the high teens in northern Illinois to the high 30s in southern Illinois, between 0 and 4 degrees below normal (Fig. 3).
More Snow Than Rain
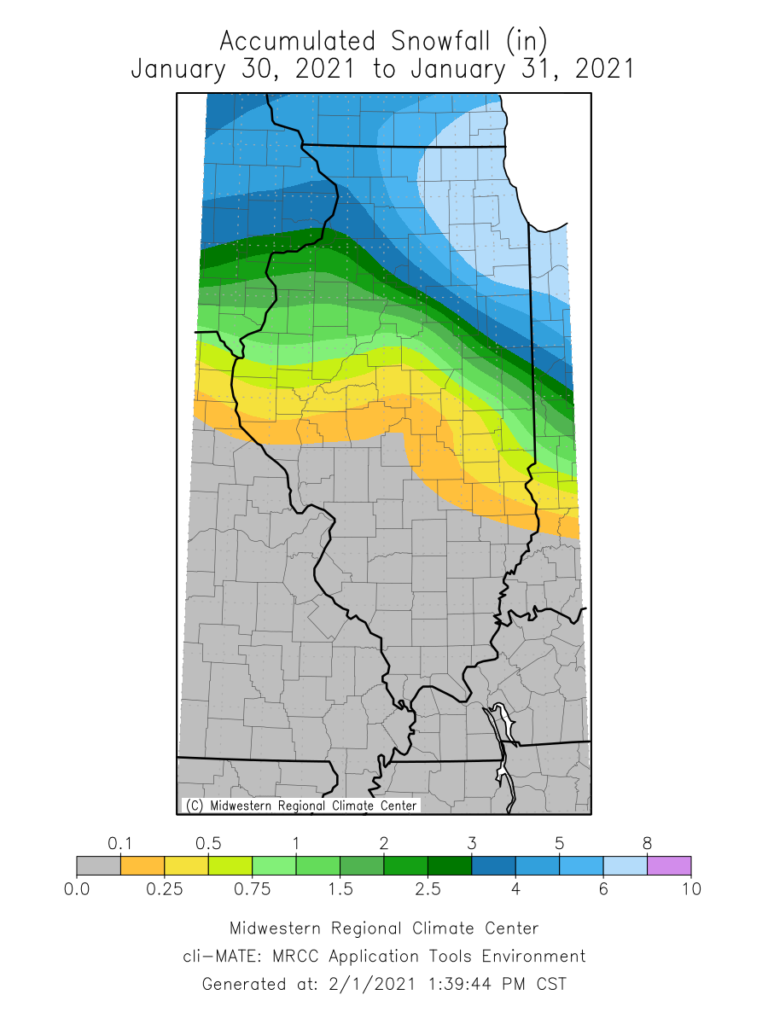
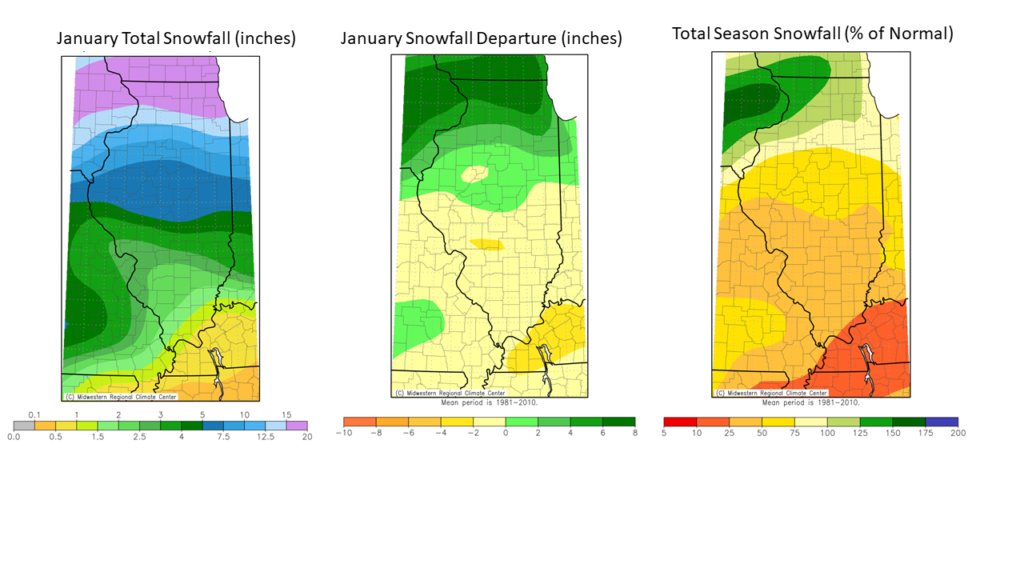
February was noteworthy not only for extremely cold weather, but also for exceedingly high snowfall totals. The position of the subpolar jet stream created an active winter storm track across the state, bringing multiple heavy snowfall events. One storm in particular produced 10 to 20 inches of snow in a 24-hour period in the northeast part of the state. This included 13 inches observed in Kankakee on February 16 alone, which was the largest single day snowfall total on record in Kankakee. February snowfall totals ranged from just under 34 inches in the northern Chicago suburbs to about 3 inches in Mt. Vernon.
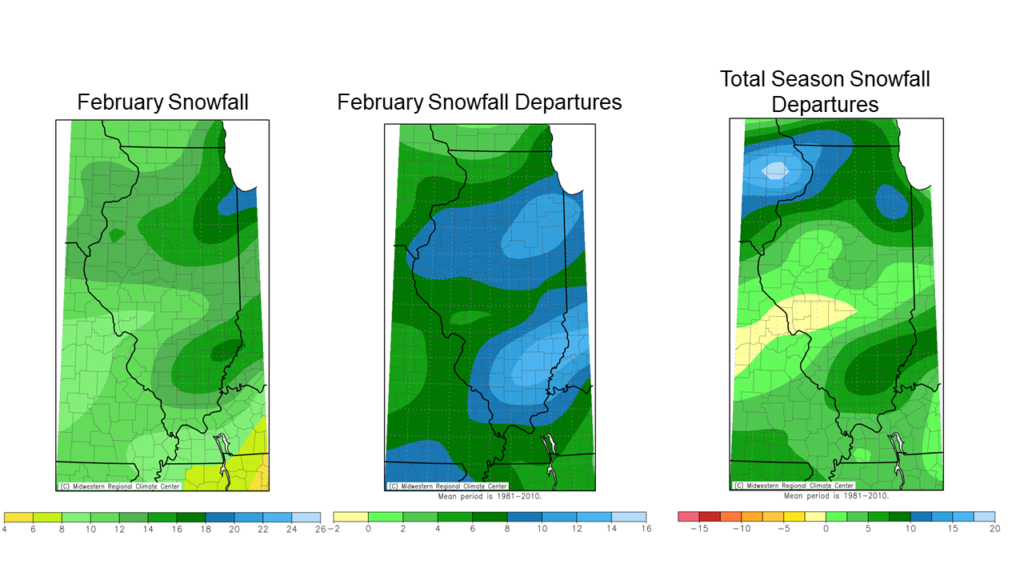
The maps below show February total snowfall ranged from 8 inches in southwest Illinois to over 30 inches in northeast Illinois, between 5 and 15 inches above the 1981–2010 normal (Fig. 4). The incredibly snowy month pushed winter season totals above normal across most of the state.
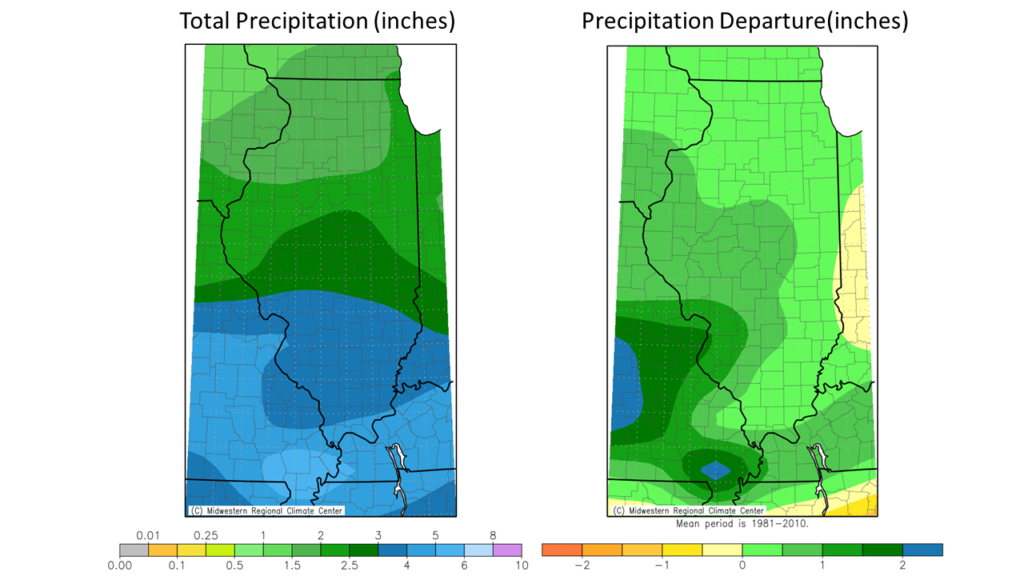
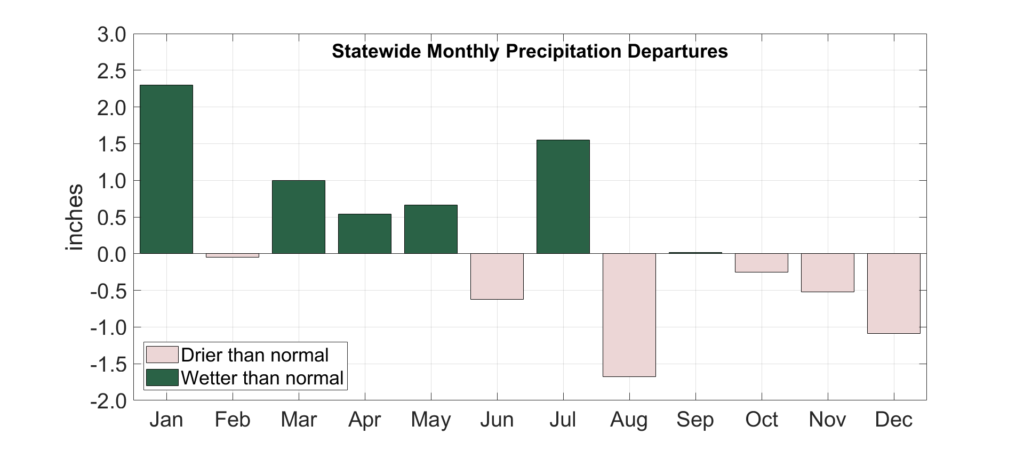
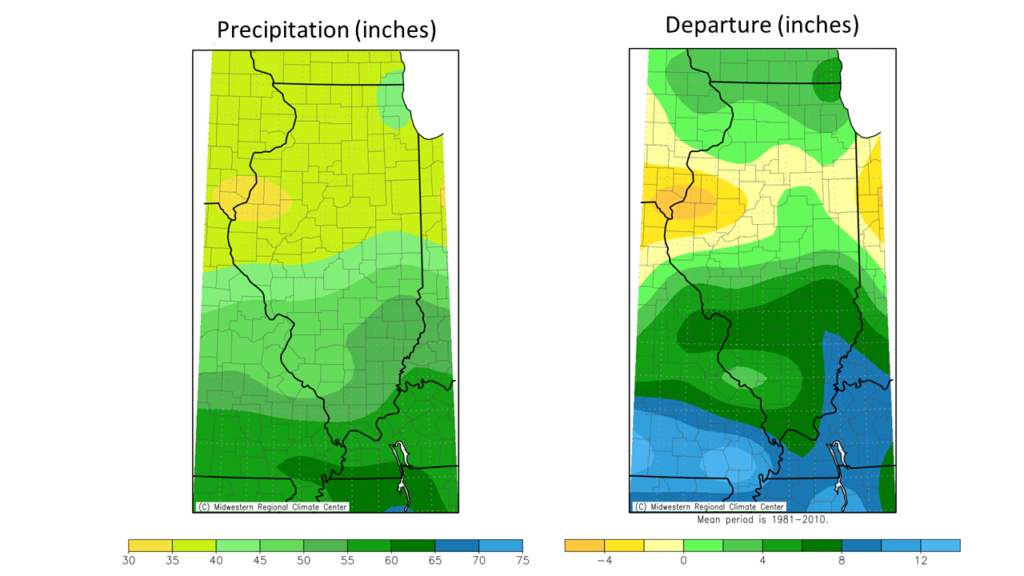
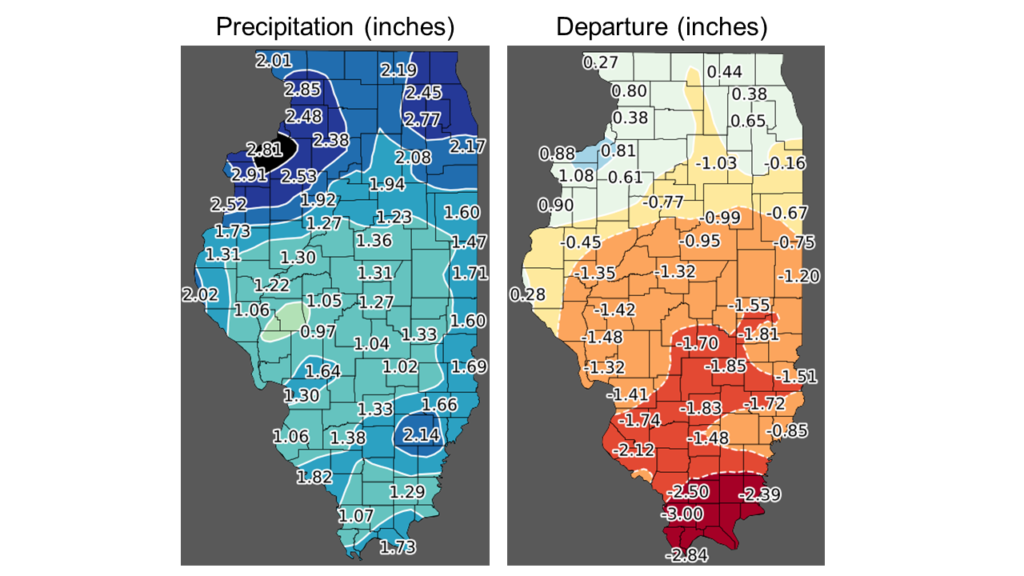
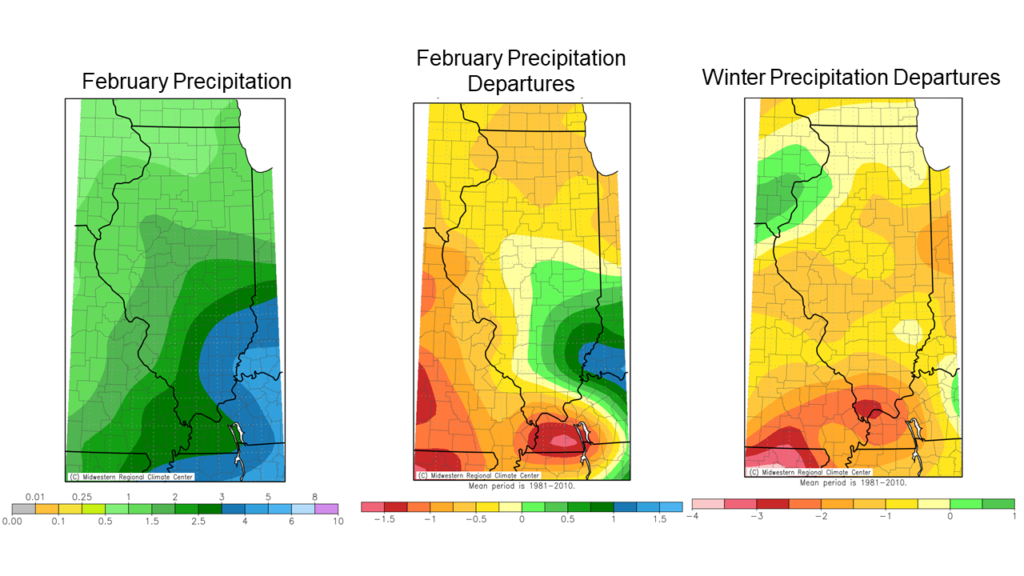
Because February snow fell from very cold air, it did not produce a large amount of equivalent liquid precipitation. February total precipitation ranged from just over an inch in far northern Illinois to just over six inches in southeast Illinois. All areas except for the southeast quadrant were a tenth to one inch drier than the 1981–2010 normal in February. Combined with drier than average months in January and December, most parts of the state experienced a winter season that was one-half inch to three inches drier than normal (Fig. 5).
Overall, preliminary statewide average total February precipitation was 2.01 inches, 0.10 inches below the 1991–2020 average and tied for the 51st wettest on record going back to 1895.
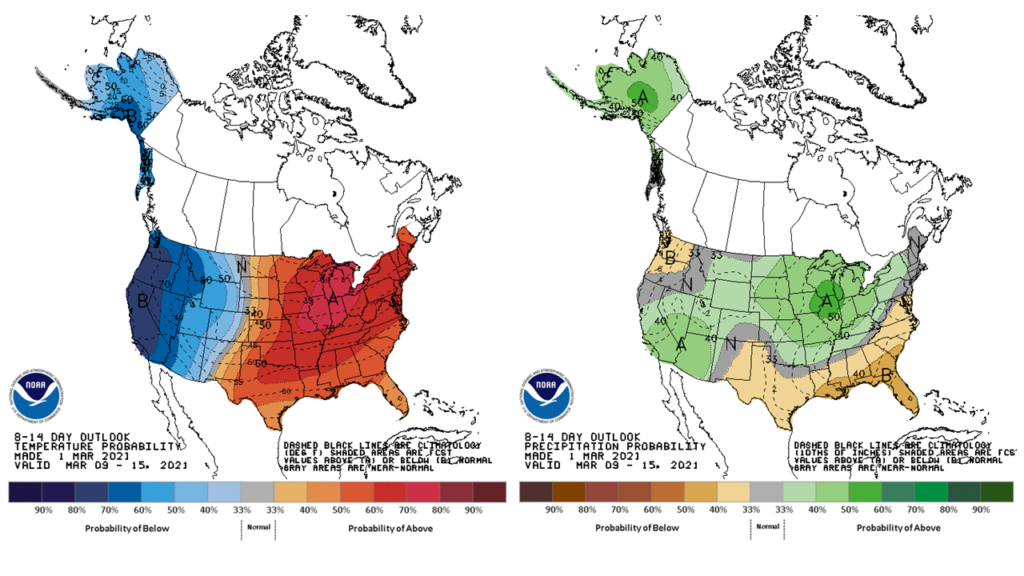
Outlooks
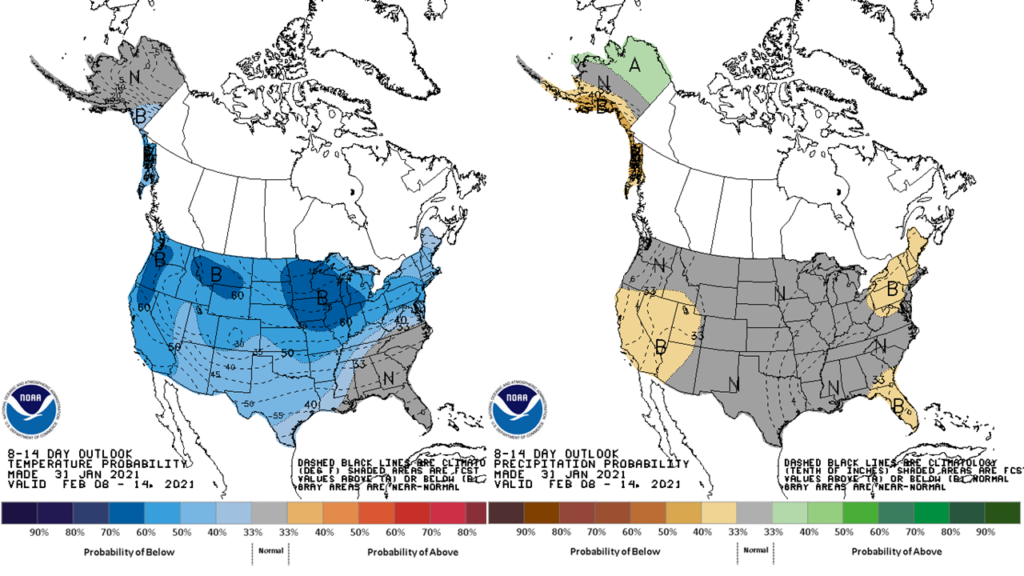
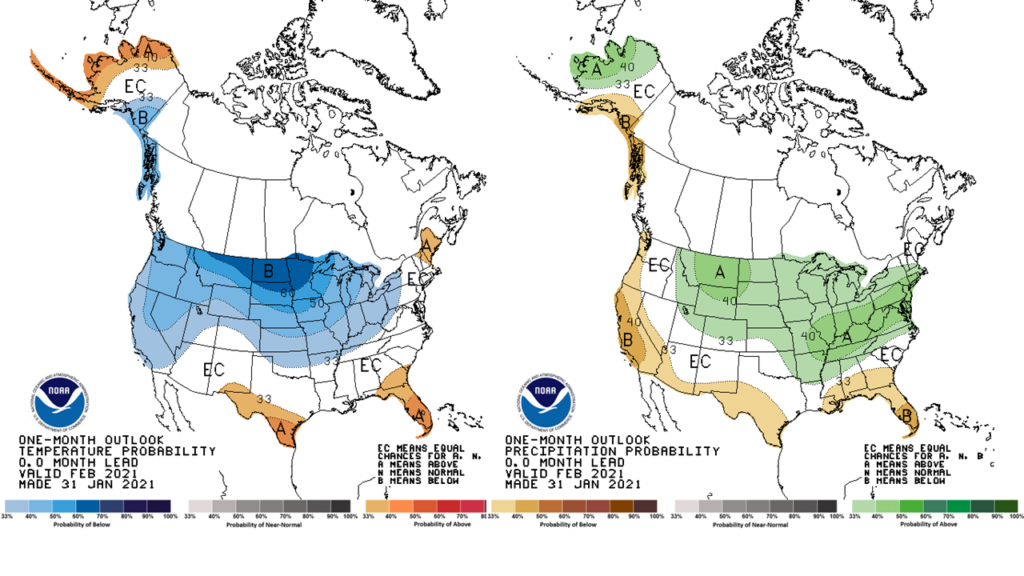
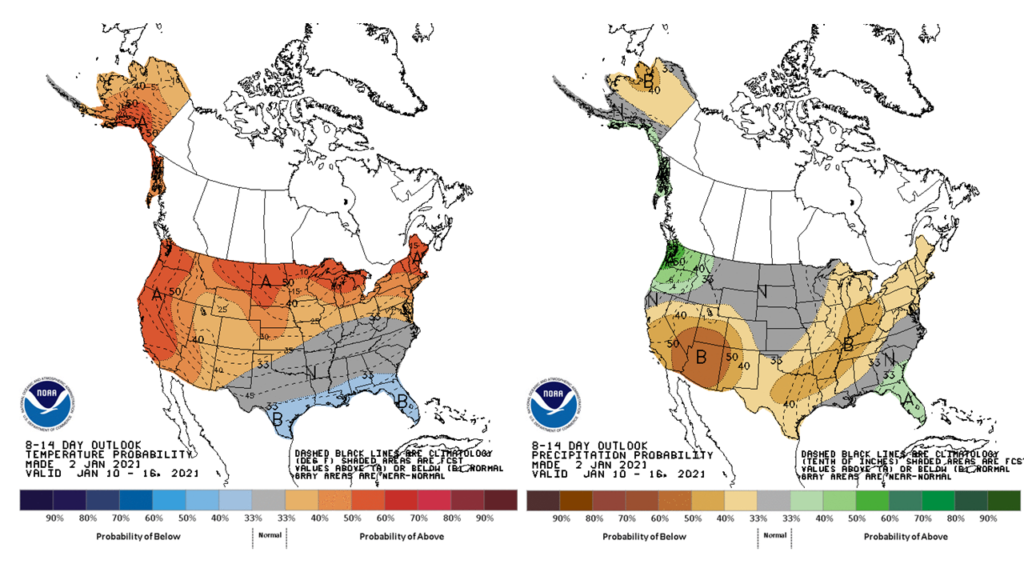
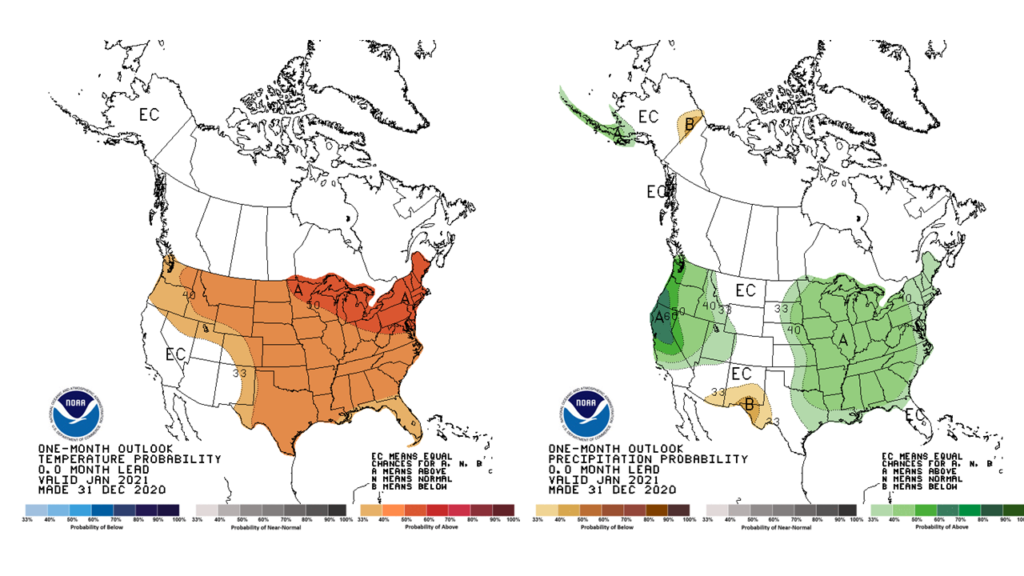
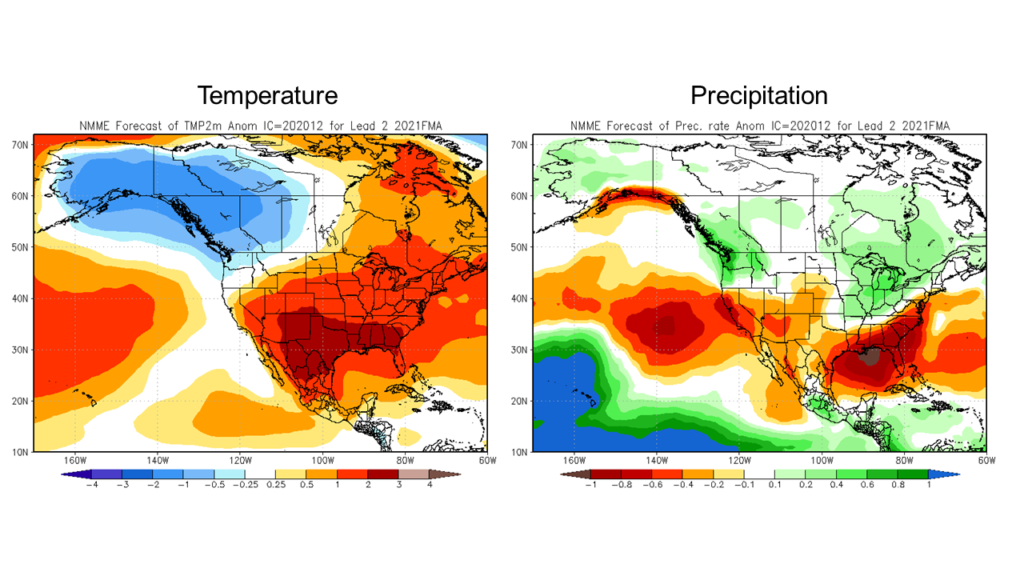
Both the short-term 8- to 14-day outlooks and the one-month March outlooks from the Climate Prediction Center show strongly elevated odds of warmer than normal conditions this month. The outlooks also indicate the highest odds of wetter than normal conditions in the first half and through the entirety of March (Fig. 6). Lastly, the newest three-month outlooks for climatological spring (March–May) also indicate the highest odds of warmer and wetter than normal conditions.