December was much warmer and drier than average across Illinois. The preliminary statewide average December temperature was 32.8 degrees, 2.9 degrees above the 30-year normal and tied for the 35th warmest on record. Preliminary statewide average total precipitation for December was 1.78 inches, 0.91 inches less than the 30-year normal, and the 43rd driest on record.
Data are provisional and may change slightly over time
December Temperatures
The atmospheric conditions that gave us a very warm November continued most of last month, resulting in above average December temperatures statewide. The maps below show December average temperatures and departures across the state. Average temperatures ranged from the high 20s in northern Illinois to the high 30s in southern Illinois, between 1 and 6 degrees above average. Rockford recorded its 10th warmest December on record, following its 3rd warmest November. In fact, seven of the twelve months of 2020 were in the top 10 warmest on record in Rockford, and 2020 as an entire year was fourth warmest on record there.
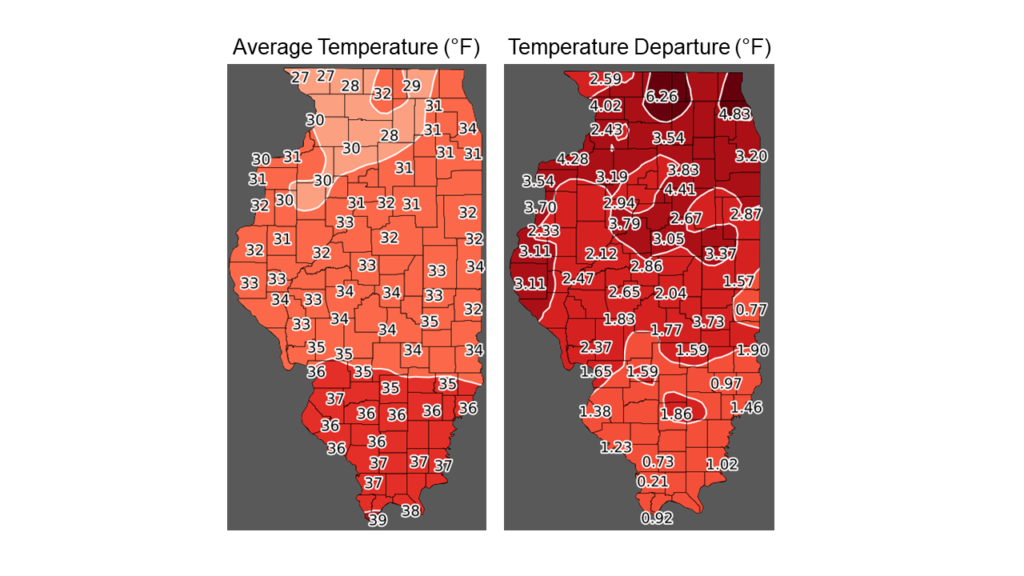
Daily maximum temperature records were broken at 34 stations last month. Overall, the statewide average December temperature was 32.8 degrees, 2.9 degrees above the 30-year normal and tied for 35th warmest on record.
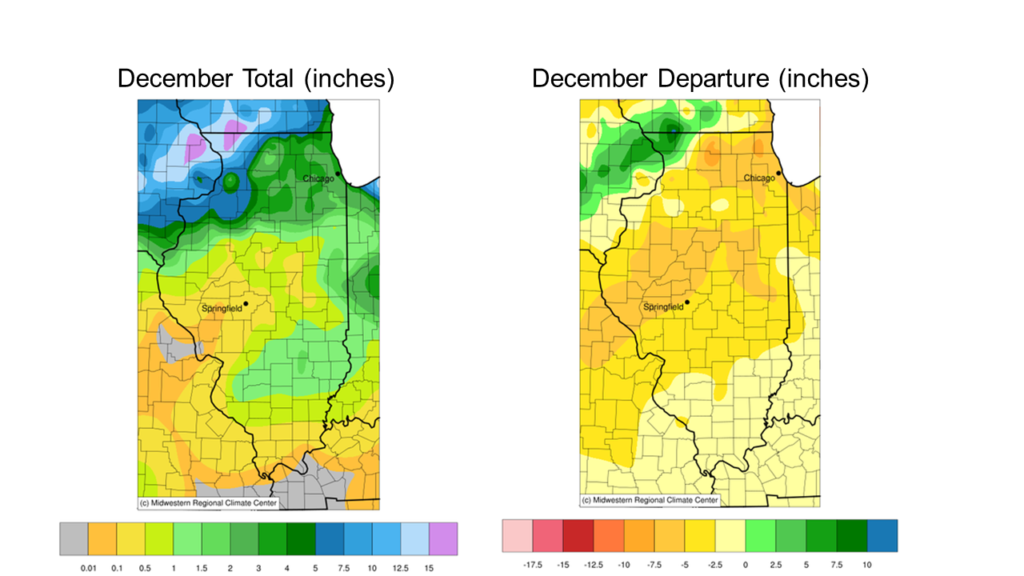
Another Dry December
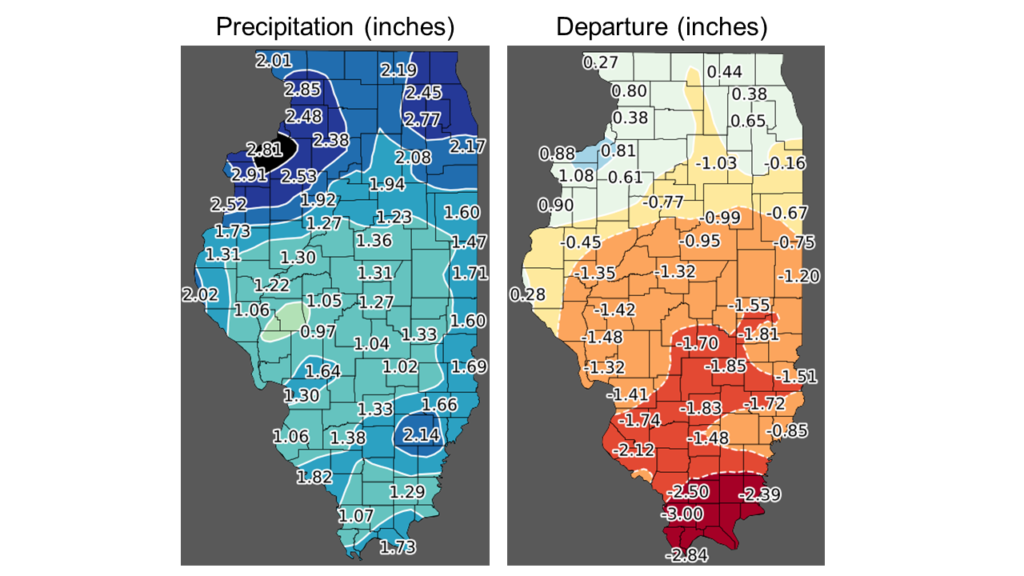
As the maps below show, December total precipitation ranged from just under 3 inches in northwest Illinois to just over 1 inch in much of central and southern Illinois. The entire southern two-thirds of Illinois was drier than average in December, with one-month precipitation departures between 2 and 3 inches in southern Illinois.
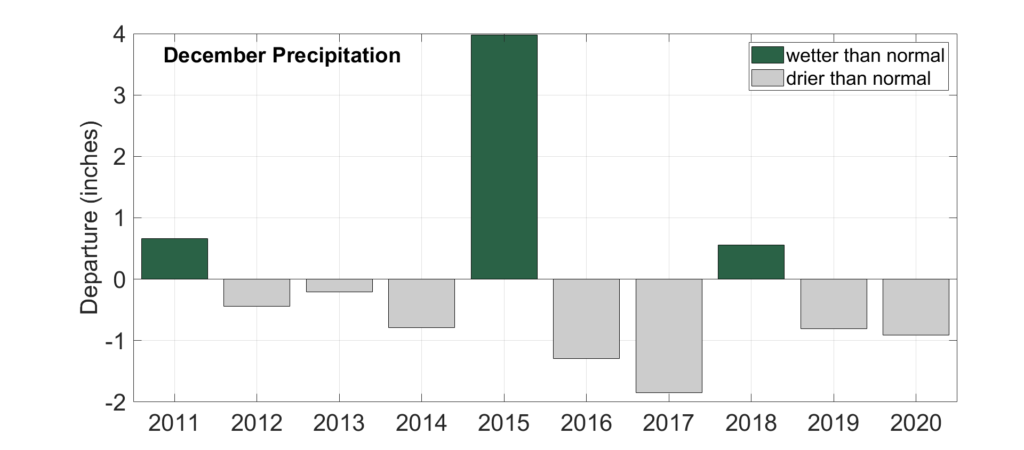
In terms of hydrology, December is considered a recharge month because precipitation is typically much larger than evaporation. This allows soil moisture to recharge prior to soils freezing. However, statewide, four out of the past five and seven out of the past ten Decembers have been drier than the current 30-year normal (see figure below).
Statewide total December precipitation was 1.78 inches, approximately 0.91 inches below the 30-year normal and the 43rd driest on record.
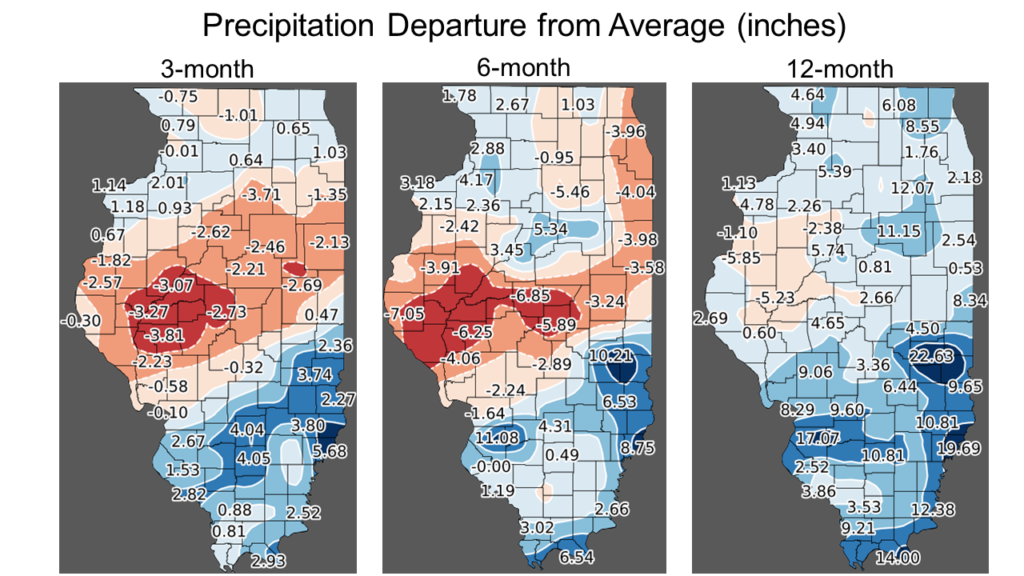
Central Illinois Drought
December continued a dry latter half of 2020 for central and northern Illinois. The maps below show precipitation departure from average over the past 3, 6, and 12 months. A broad area of the state from Pike County to Cook County has experienced a 3-inch precipitation deficit since the start of July, with some areas of western and central Illinois experiencing 6- to 7-inch deficits. These deficits represent between 65 percent and 75 percent of normal over the past 6 months. The 12-month departures are more moderate due to the very wet start to 2020.
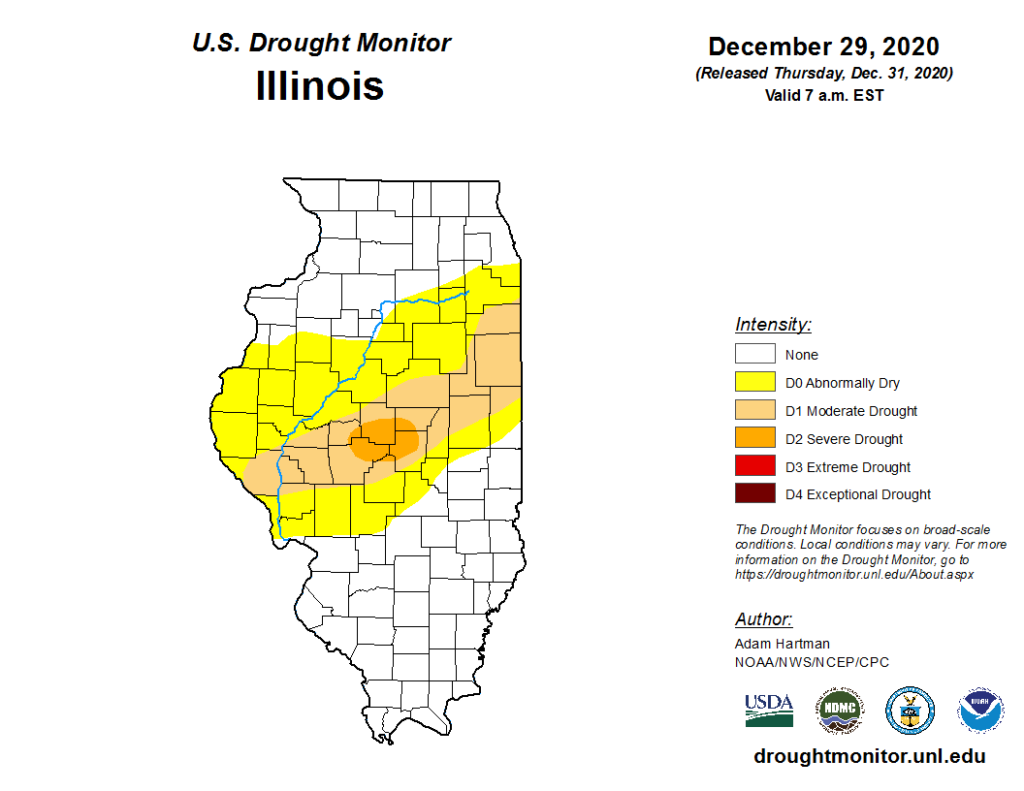
The December 29 version of the U.S. Drought Monitor showed continued moderate drought across western and central Illinois, and severe drought persisting along the Interstate 72 corridor between Springfield and Decatur. These areas have significantly depleted soil moisture, and a wet end to winter and start to spring will be necessary to return soil moisture to near normal conditions.
Most of the state experienced below normal snowfall in December, following largely snow-free months of October and November. As the maps below show, all but the northwest corner of Illinois had less than 5 inches of snowfall in December. These totals were between 1 and 10 inches below average, with the largest departures in northeast Illinois.
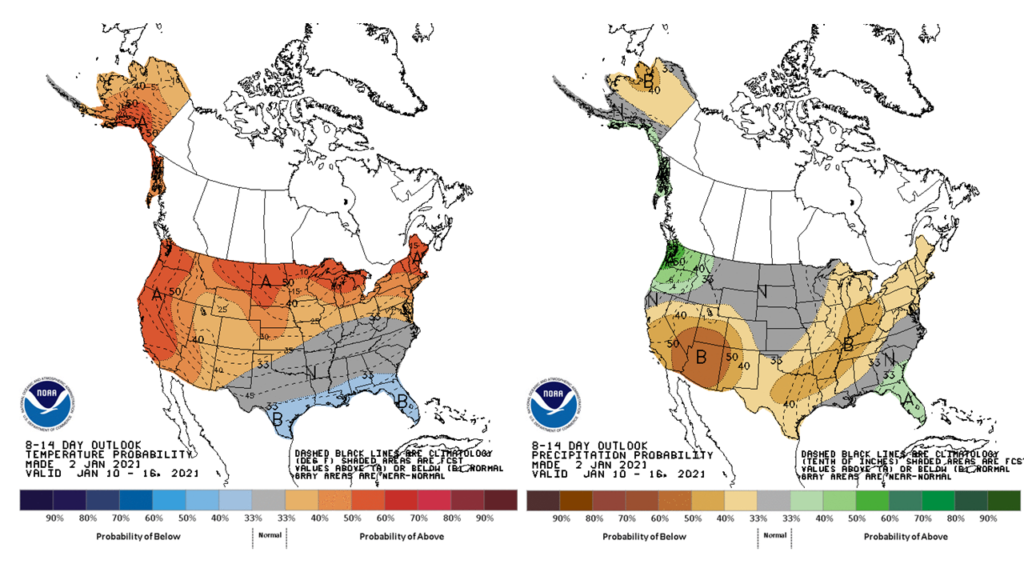
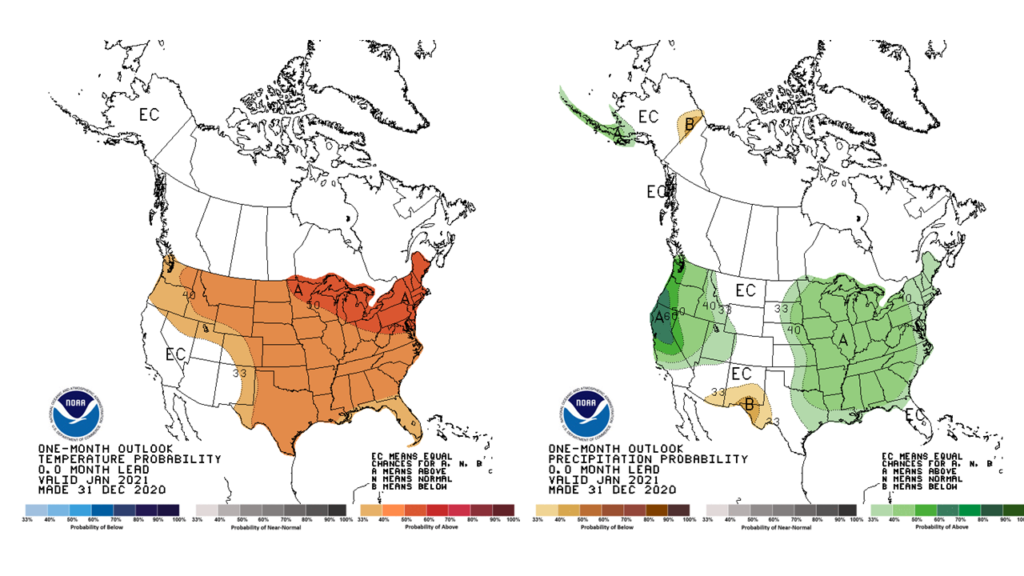
Outlooks
After an active start to January, the Climate Prediction Center’s 8- to 14-day outlooks indicate the highest odds of a change to warmer and drier than normal conditions across the state into the second week of January.
The outlooks for the entire month of January lean toward warmer and wetter than normal conditions, suggesting a change to more active winter weather around the middle of the month.
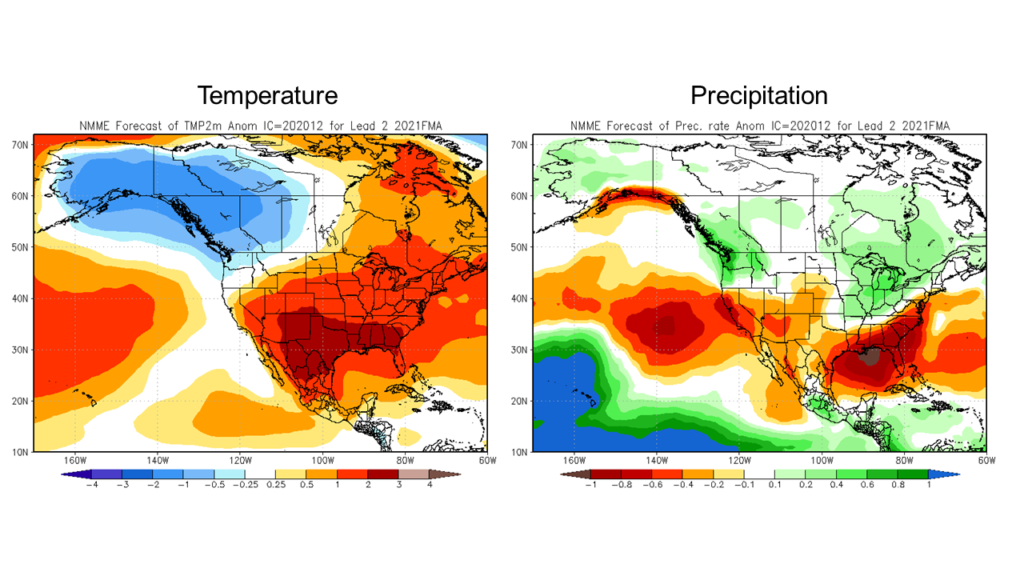
As La Niña conditions are expected to persist into early spring, forecasts from the North American Multi-model Ensemble for February through April favor warmer and wetter conditions through the winter-spring transition.