Illinois was both warmer and wetter than average in 2020. The statewide average yearly temperature was 53.3 degrees, 1.7 degrees above average and the 21st warmest year on record. Statewide total precipitation in 2020 was 41.84 inches, 4.37 inches above average and the 23rd wettest year on record.
2020 Temperatures
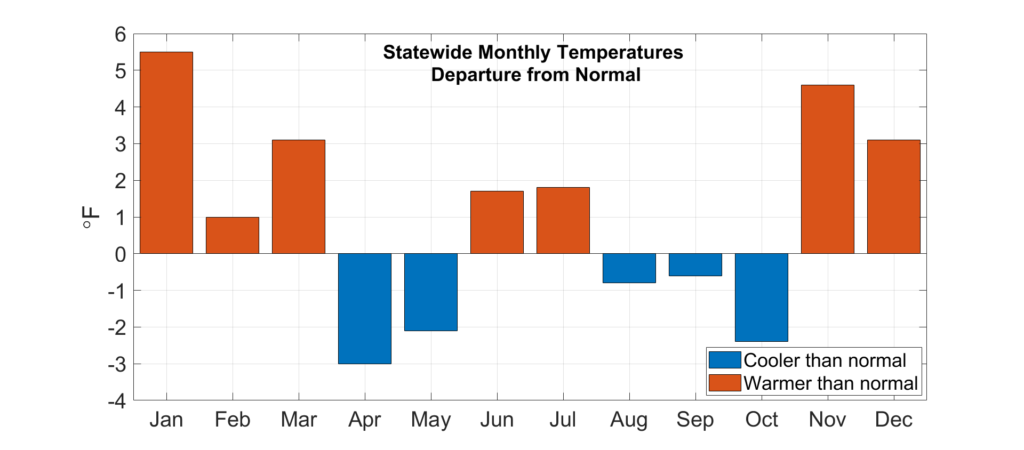
Calendar year 2020 began very warm, with January average temperatures more than 5 degrees above the 1981–2010 normal. This was followed by warmer than normal months in February and March; however, April and May were both more than 2 degrees below normal. June and July were warmer than normal, followed by three consecutive cooler than normal months in August, September, and October. The year ended with very warm months of November and December, relative to normal conditions. November, for example, was the seventh warmest on record statewide.
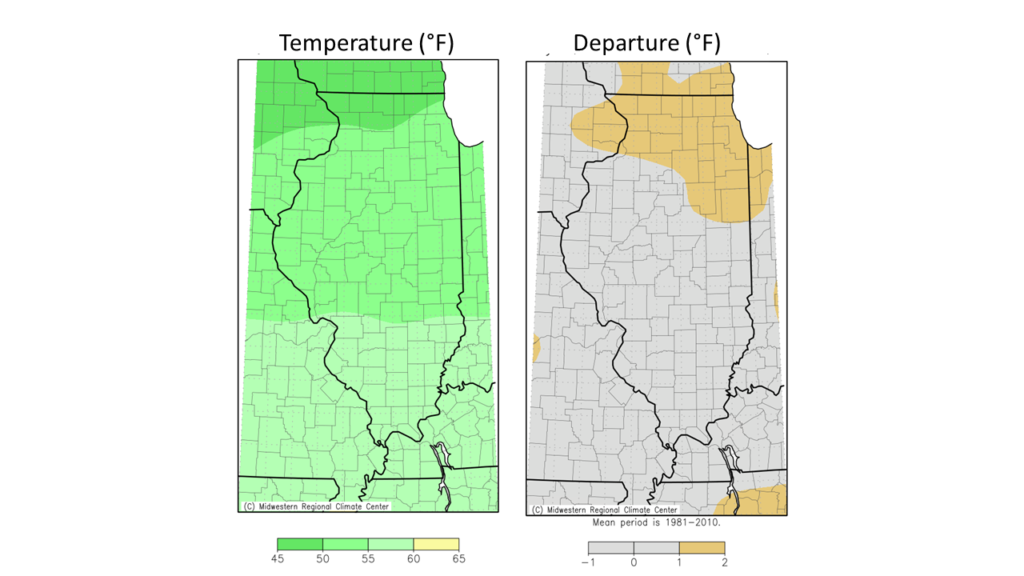
The maps below show 2020 average temperatures and departures from normal across the state. Average temperatures ranged from the high 40s in far northern Illinois to the high 50s in the southern half of the state. Most of northern Illinois was 1 to 2 degrees warmer than the 30-year normal, whereas the southern two-thirds of the state was within 1 degree of normal. 2020 was a top 10 warmest year in most counties in northeast Illinois, including the 6th warmest on record in McHenry County.
The table below shows the number of daily weather records broken at Illinois Cooperative Observer stations in each month of 2020. November led with the most high daily maximum and minimum temperature records broken, with 112 and 85, respectively. Daily low maximum and low minimum temperature records were broken at over 70 stations in September and October. However, over the entire year, twice as many low maximum temperature records were broken as low minimum temperature records. Illinois’ climate has warmed over the past 100 years, but daily minimum temperatures have increased at a larger rate than daily maximum temperatures. This disproportionate change results in fewer daily low minimum temperature records broken.
| Daily | High Maximum Temperature | High Minimum Temperature | Low Maximum Temperature | Low Minimum Temperature | High Precipitation |
| January | 21 | 37 | 1 | 0 | 163 |
| February | 36 | 8 | 24 | 33 | 21 |
| March | 1 | 5 | 2 | 0 | 61 |
| April | 13 | 3 | 20 | 33 | 42 |
| May | 0 | 6 | 42 | 37 | 60 |
| June | 20 | 37 | 1 | 4 | 30 |
| July | 1 | 3 | 3 | 0 | 93 |
| August | 11 | 17 | 44 | 7 | 25 |
| September | 0 | 0 | 73 | 4 | 51 |
| October | 11 | 8 | 70 | 19 | 64 |
| November | 112 | 85 | 0 | 3 | 43 |
| December | 34 | 1 | 2 | 0 | 26 |
| Total | 260 | 210 | 282 | 140 | 679 |
There were also 679 daily total precipitation records broken across Illinois in 2020. This includes 163 records in January, most of which were caused by a large system that brought heavy rain over multiple days to a large area of the state from the St. Louis Metro-East to Champaign-Urbana.
2020 Precipitation
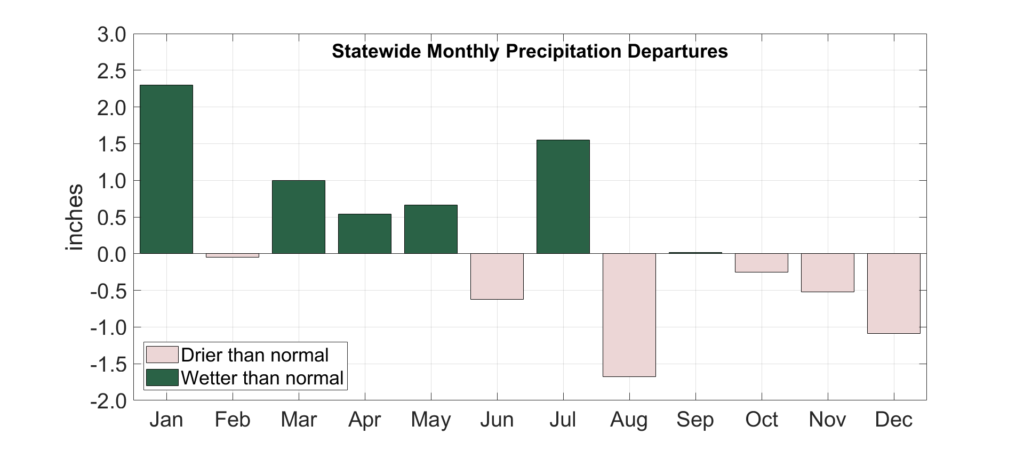
Calendar year 2020 began much as 2019 ended: wet. Statewide total precipitation was more than 2 inches above the 1981–2010 normal in January, followed by wetter than normal months in March, April, and May. However, a switch to a very dry pattern in most of central and northern Illinois resulted in drier than normal conditions statewide in four of the past six months of the year.
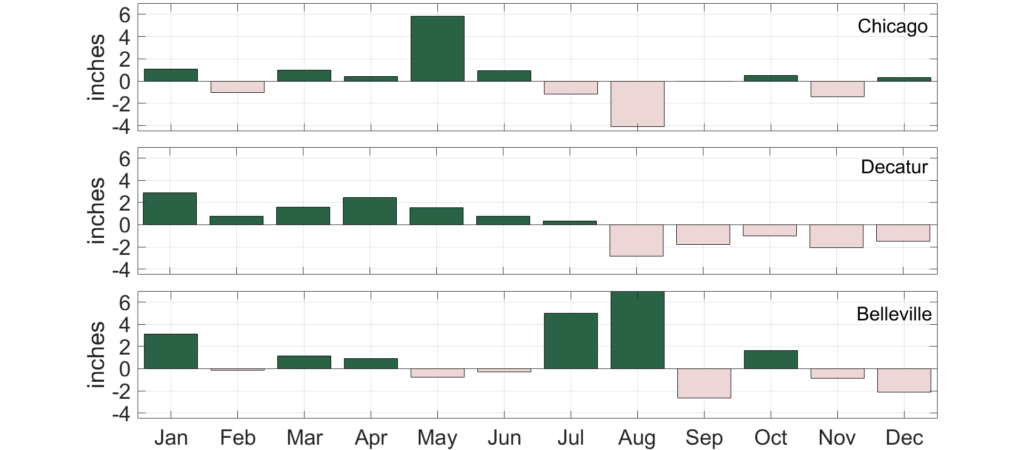
The plot below shows the 2020 monthly precipitation departure from normal in Chicago, Decatur, and Belleville. The first seven months of the year were wetter than normal in Decatur, followed by five consecutive drier than normal months. The year was more mixed in northern and southern Illinois. Both July and August were more than 4 inches wetter than normal in Belleville, leading to the second wettest climatological summer on record there.
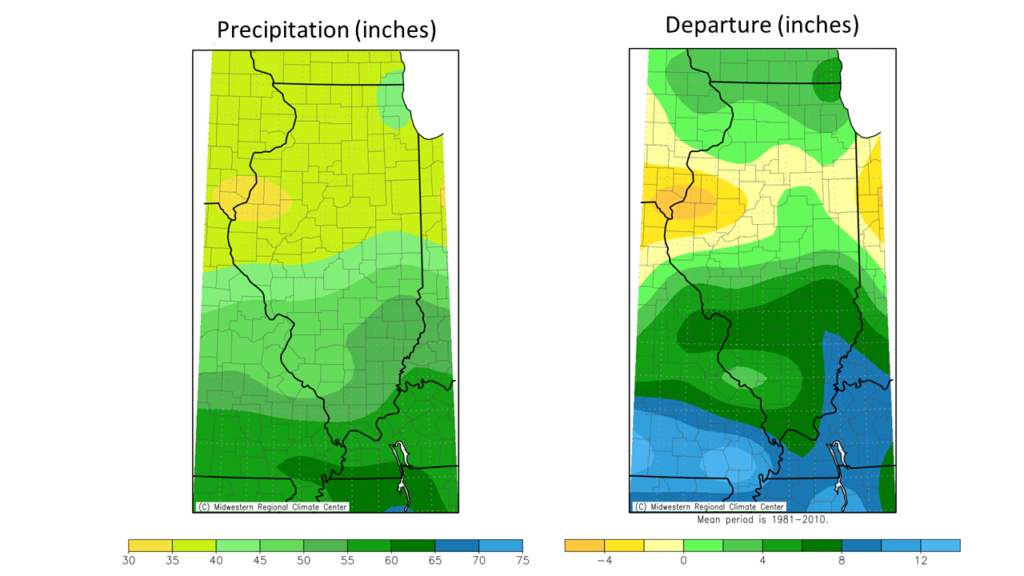
The maps below show spatial variability of 2020 precipitation in more detail. Total annual precipitation ranged from less than 35 inches in western Illinois to nearly 60 inches in southeast Illinois. A large area of western Illinois was 2 to 4 inches drier than average, while most of central Illinois was within 1 inch of the long-term average. Much of northern and southern Illinois was 1 to 6 inches wetter than average, and a small area of southeast Illinois was 8 to 12 inches wetter than average. White County in southeast Illinois was nearly 12 inches wetter than average in 2020, making it the 8th wettest year on record there.
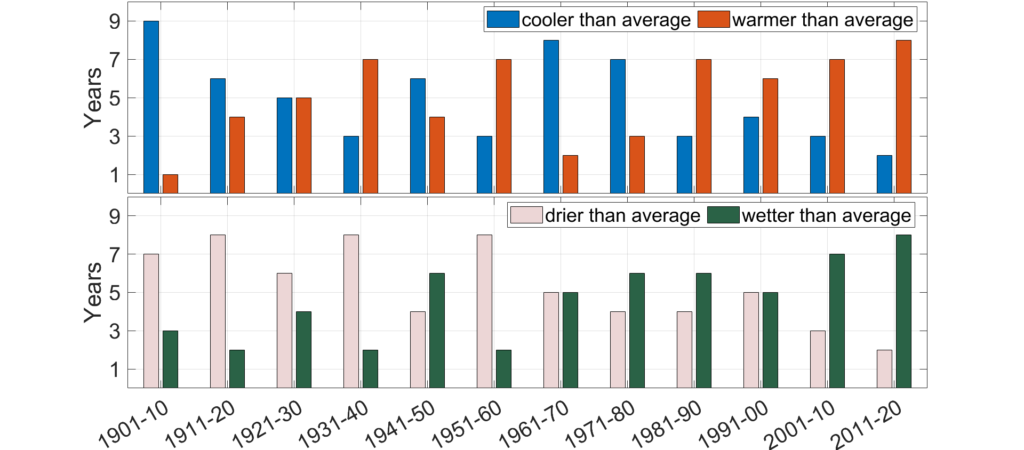
2020 Consistent with Long-term Trends
Both temperature and preciptiation have increased across the state over the past century, which define climate change in Illinois. The plot below shows the number of years in each decade between 1901 and 2020 in which the statewide average temperature and total precipitation were above and below the 1901–2020 average. Recent decades have tended to have more warmer and wetter than average years, and the most recent decade (2011–2020) had the highest incidence of both warmer than average and wetter than average years, eighth out of ten each.