

Our first month of 2021 was quite a bit warmer and slightly wetter than average across the state. The preliminary statewide average January temperature was 28.8 degrees, 2.4 degrees above the 1981–2010 normal and tied for the 36th warmest on record going back to 1895. Preliminary statewide average total January precipitation was 2.56 inches, 0.49 inches above the 1981–2010 normal and tied for the 32nd wettest on record going back to 1895.
Data are provisional and may change slightly over time
Above Average January Temperatures
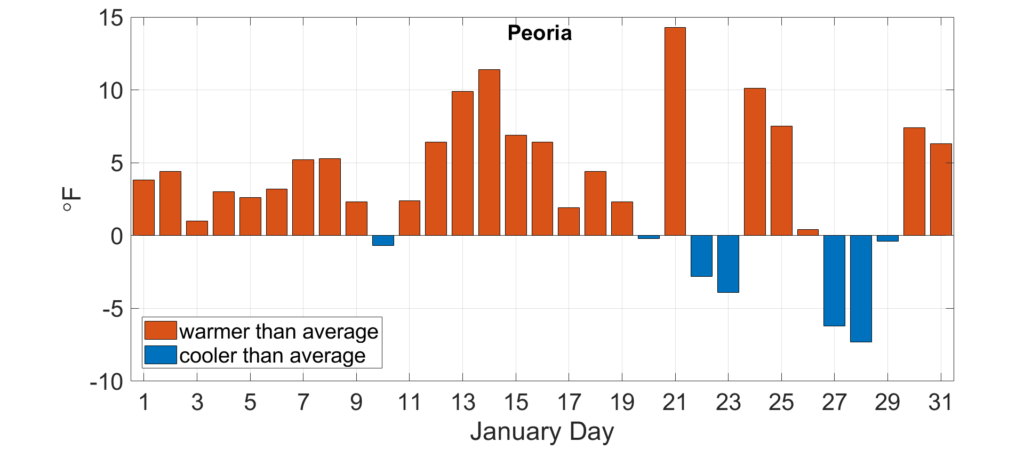
Following a warmer than average December, temperatures remained persistently above average throughout January. Figure 1 (below) shows January daily average temperature as a departure from average in Peoria. Only 7 out of 31 January days were cooler than average in Peoria. The lack of very cold days and nights this winter season has resulted in below average heating degree days, a metric often used to estimate and predict energy demand for heating. For example, Marengo in McHenry County has accumulated just over 3,600 heating degree days in the winter season to date, compared to a 30-year normal of 4,100 by this time.
Despite the consistency of warmer than average conditions last month, only one daily temperature record was broken. This was the daily high minimum temperature record in Rockford. As the maps below show, January average temperatures ranged from the mid-20s in northern Illinois to the high 30s in southern Illinois, which was between 3 and 5 degrees above the 1981–2010 normal (Figure 2).
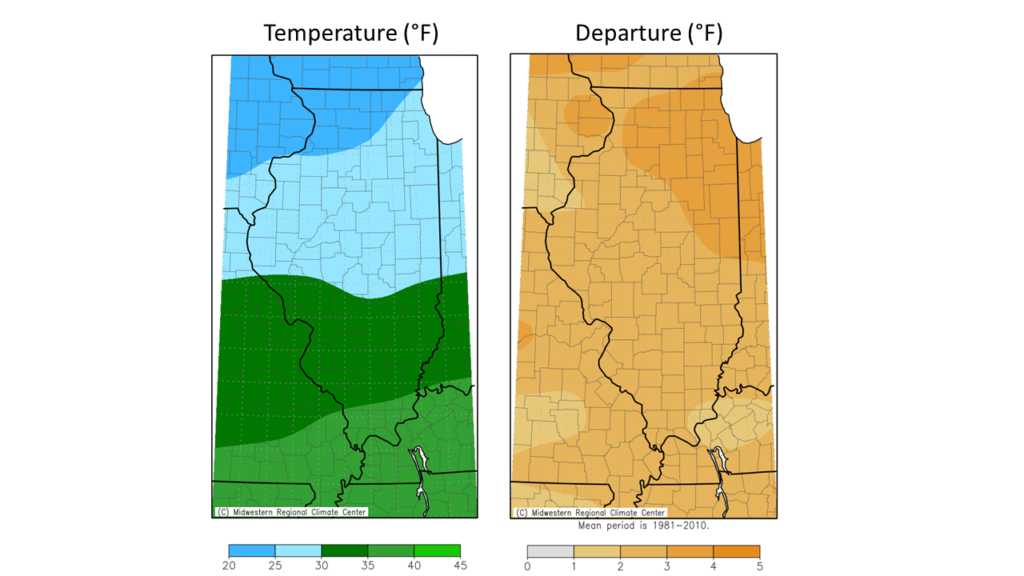
The preliminary statewide average January temperature was 28.8 degrees, 2.4 degrees above the 1981–2010 normal and the 36th warmest on record going back to 1895.
January Precipitation
Climatologically, January is one of the drier months of the year in Illinois. Last month started with rain and snow for most of the state, followed by two weeks when most of the state received less than half an inch of total precipitation. However, the last week of January brought more active winter weather, including multiple large winter storms that produced heavy precipitation and impressive snow totals across the state.
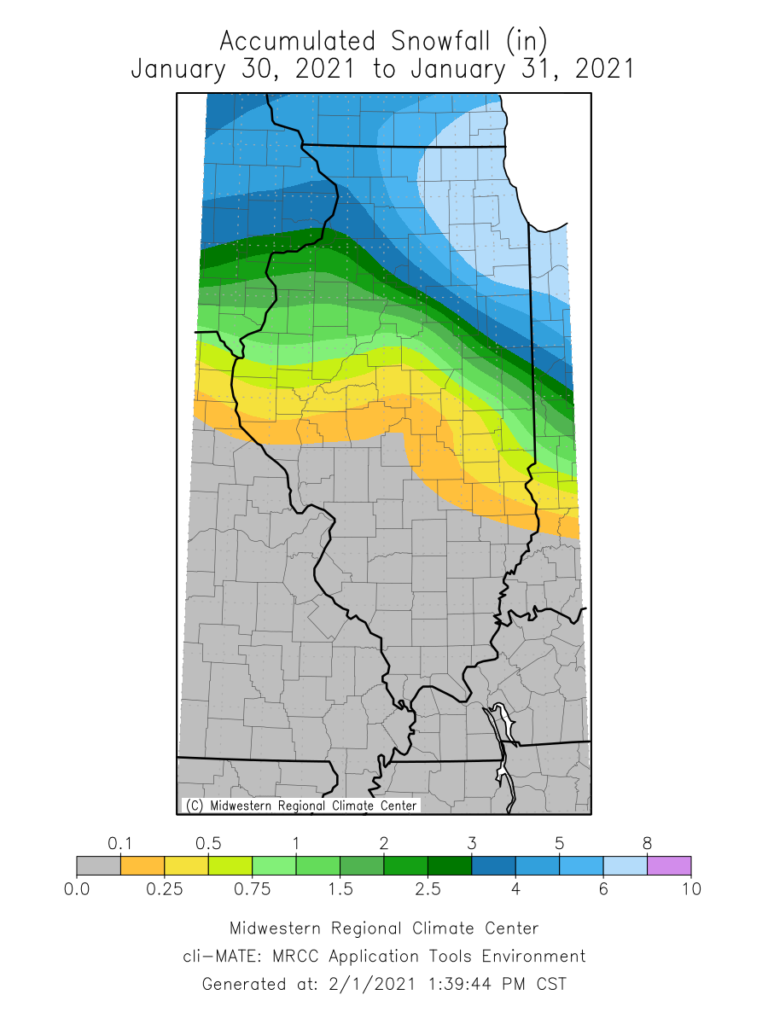
The map below shows snowfall totals on January 30–31 ranged from less than a tenth of an inch in south-central Illinois to over 10 inches in the Chicagoland area. The National Weather Service Chicago office reported isolated totals of over 12 inches in Romeoville, Peotone, and Thornton. Chicago’s O’Hare Airport reported 10.8 inches, which was the 26th largest two-day snowfall total on record there and the largest since 2015.
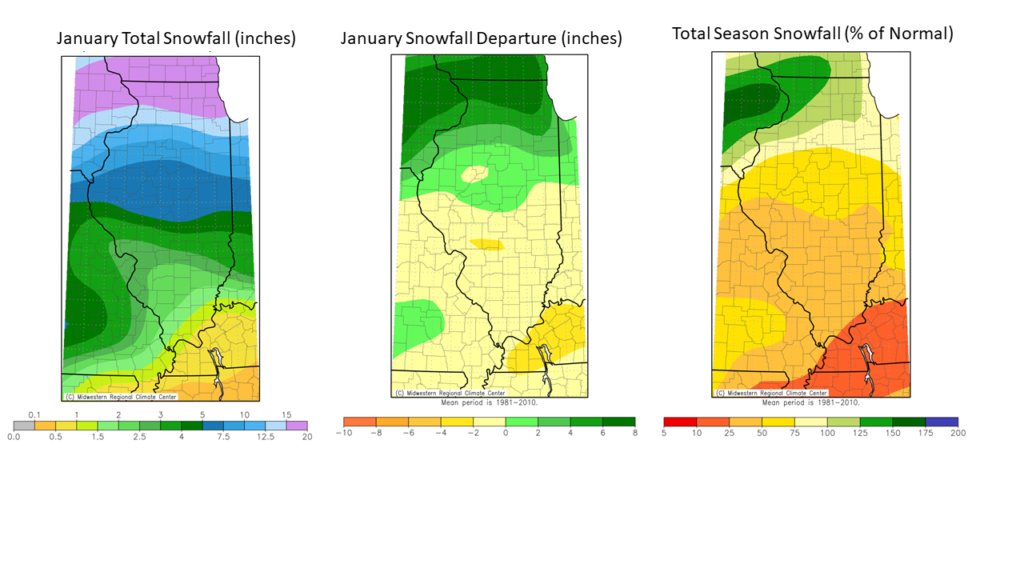
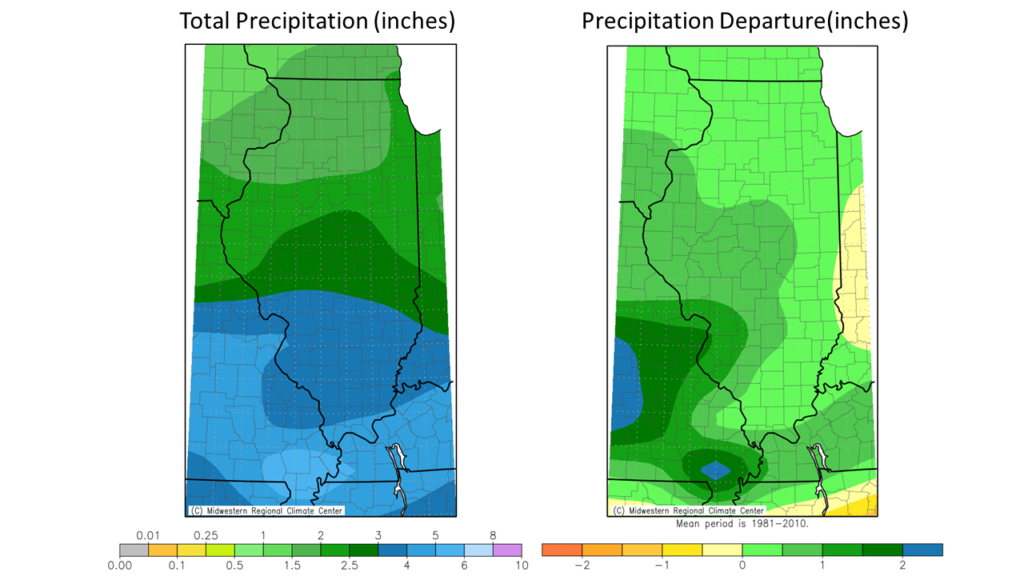
The late-month snow helped boost January totals above the 1981–2010 normal across most of northern and north-central Illinois, while the southern two-thirds of the state were within 2 inches of normal (Figure 4). January total snowfall ranged from less than half an inch in southern Illinois to over 20 inches in northern Illinois. Most folks south of Interstate 80 have seen below average snowfall for the winter season to date. Total snowfall is 10 to 50 percent of average in southern and central Illinois and above average only in northwest and far northern Illinois.
Overall, total January precipitation ranged from nearly 6 inches in far southern Illinois to just under 2 inches in northwest Illinois, wetter than the 1981–2010 normal virtually everywhere in the state (Figure 5). Preliminary statewide average total January precipitation was 2.56 inches, 0.49 inches above the 1981–2010 normal and tied for the 32nd wettest on record going back to 1895.
Outlooks
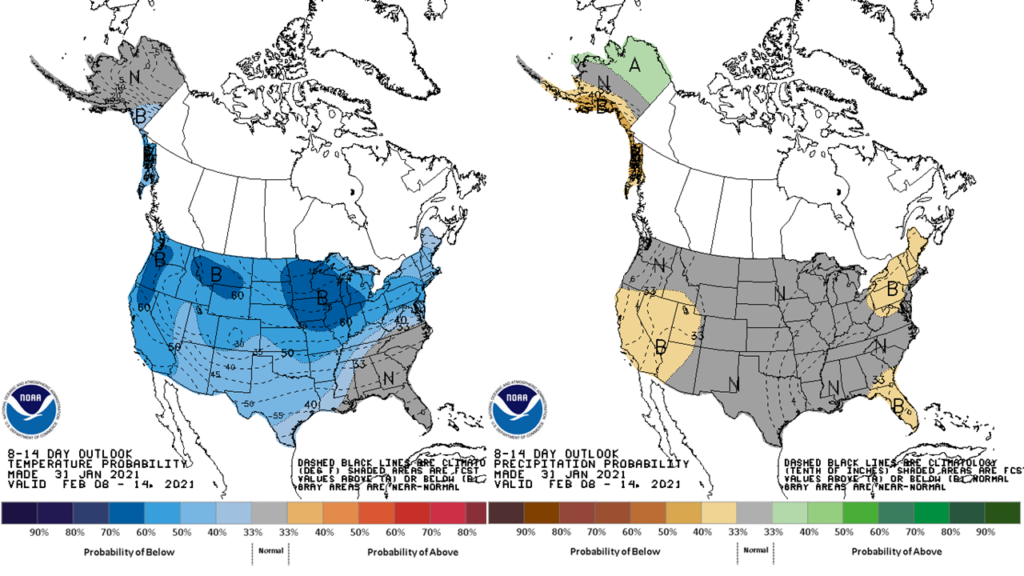
Short-term 8–14-day outlooks from the NOAA Climate Prediction Center show strongly elevated odds of below normal temperatures in the second week of February as a push of Arctic air makes its way southeast. Short-term precipitation outlooks show slightly elevated odds of near normal precipitation totals over this time period. Climatologically, February is the driest month of the year in Illinois.
Longer-term outlooks for February as a whole month continue to show elevated odds of below normal temperature, but slightly elevated odds of wetter than normal conditions. This suggests the expectation of a wetter middle to later part of February as we move toward climatological spring.
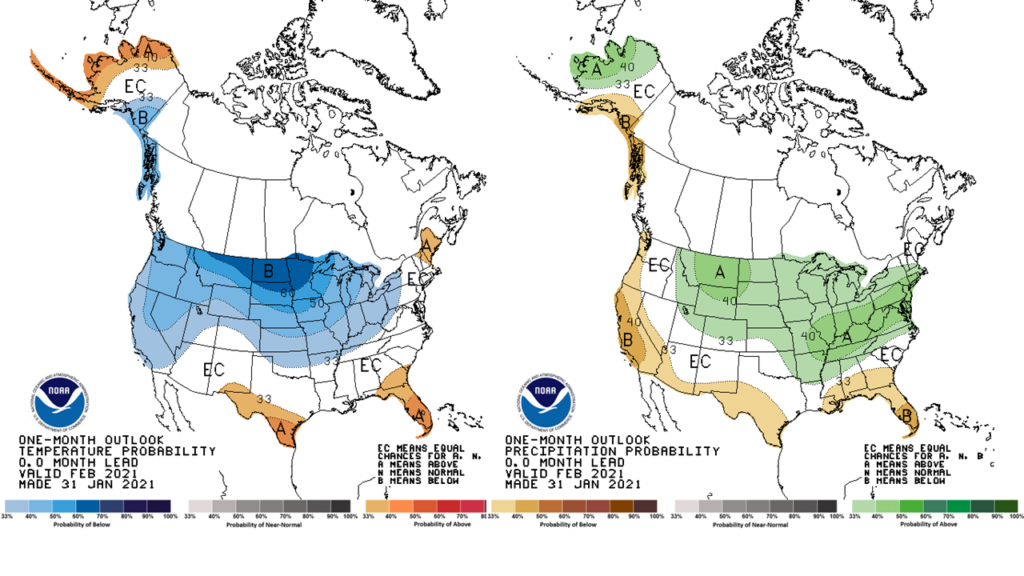
Finally, three-month outlooks for February through April lean more toward a long-term warming trends and ongoing La Niña conditions in the Pacific, showing elevated odds of warmer and wetter than normal conditions to transition from winter into spring.
