November brings a warm end to Fall

November was much warmer and slightly drier than average across Illinois. The preliminary statewide average November temperature was 46.6 degrees, 4.1 degrees above the 30-year normal and tied for the 9th warmest on record. Preliminary statewide average total precipitation for November was 2.94 inches, 0.53 inches less than the 30-year normal, and the 70th driest on record.

Data are provisional and may change slightly over time

November Temperatures

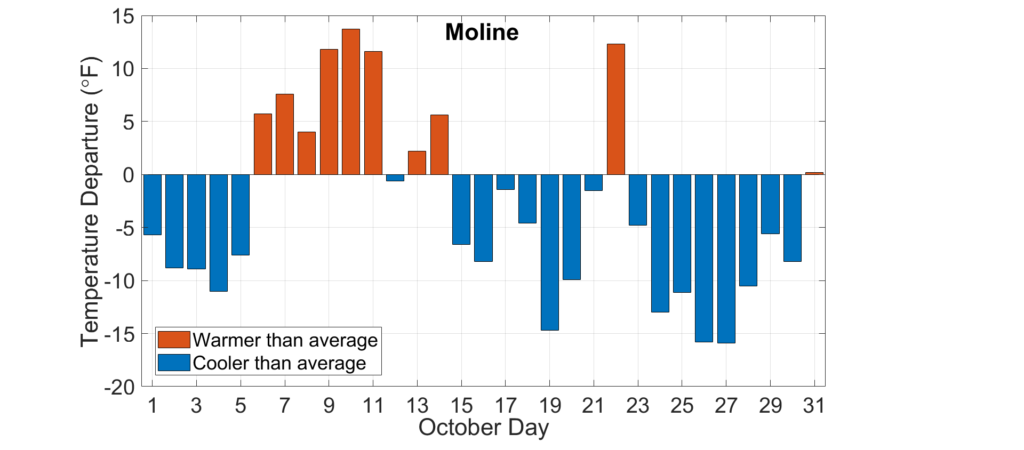
Following cooler than normal months in September and October, a broad upper-level ridge established over the central U.S. and brought warm air into the Midwest. This resulted in well above average temperatures across Illinois. The plot below shows daily average temperatures in Rockford between November 3rd and 10th were 5 to 25 degrees above average. The station in Rockford recorded its highest November daily average temperature on record last month, 69 degrees on November 9th. This temperature is close to the climatological average for late September!

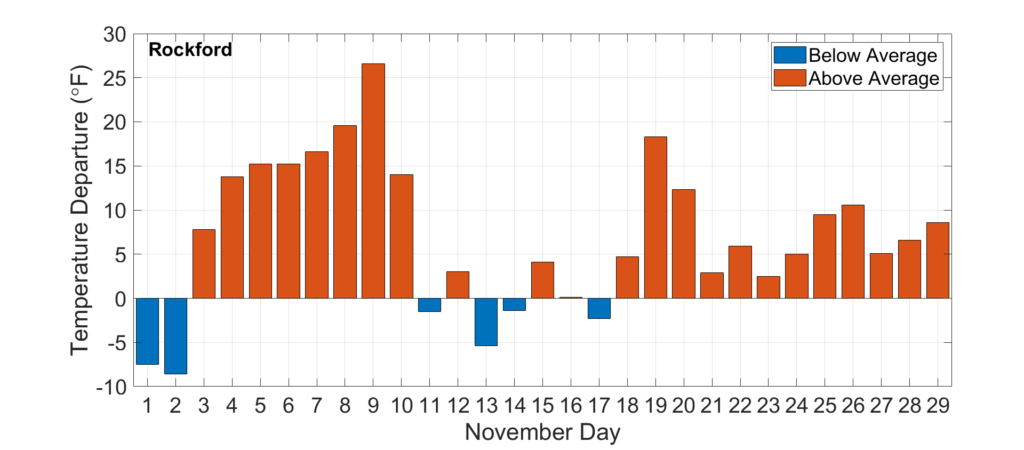
Between November 9th and 12th, 103 Illinois stations broke their daily high maximum temperature records, and 79 stations broke their daily high minimum temperature records. The Streator station in Livingston County broke its 126-year daily high minimum temperature record by 14 degrees on November 10th. Impressively, 19 stations in Illinois broke their all-time November high minimum temperature records last month. This included in Rock Island, where the 65-degree minimum temperature on November 10th was the highest minimum temperature recorded since observations began there in 1872.

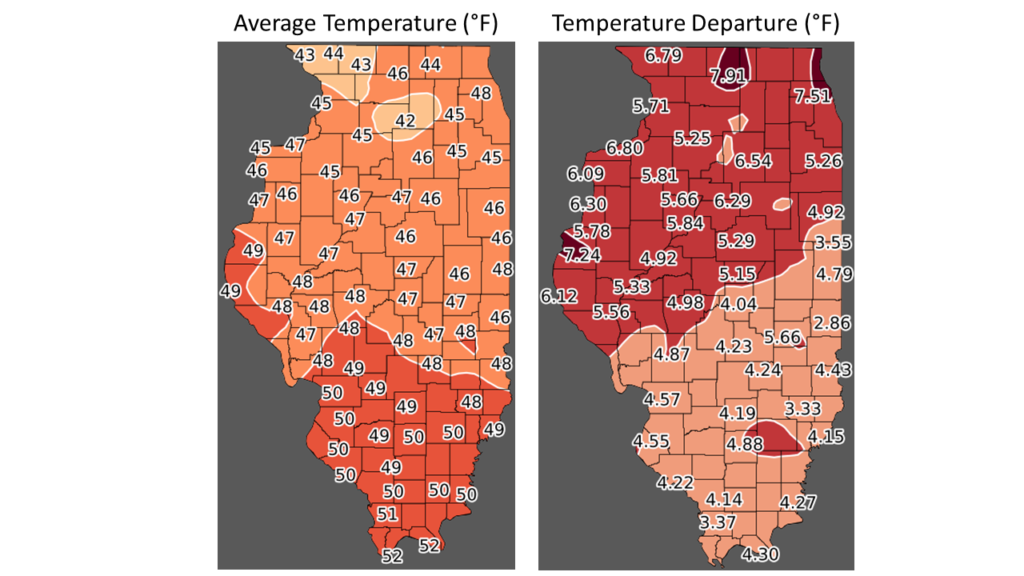
Although temperatures moderated in the second and third weeks of November, temperatures mostly remained above normal throughout the rest of the month. The maps below show November average temperatures and departures across the state. Average temperatures ranged from the low 40s in northern Illinois to the low 50s in southern Illinois, between 4 and 8 degrees above average. The statewide average November temperature was 46.6 degrees, 4.1 degrees above the 30-year normal and tied for 9th warmest on record.

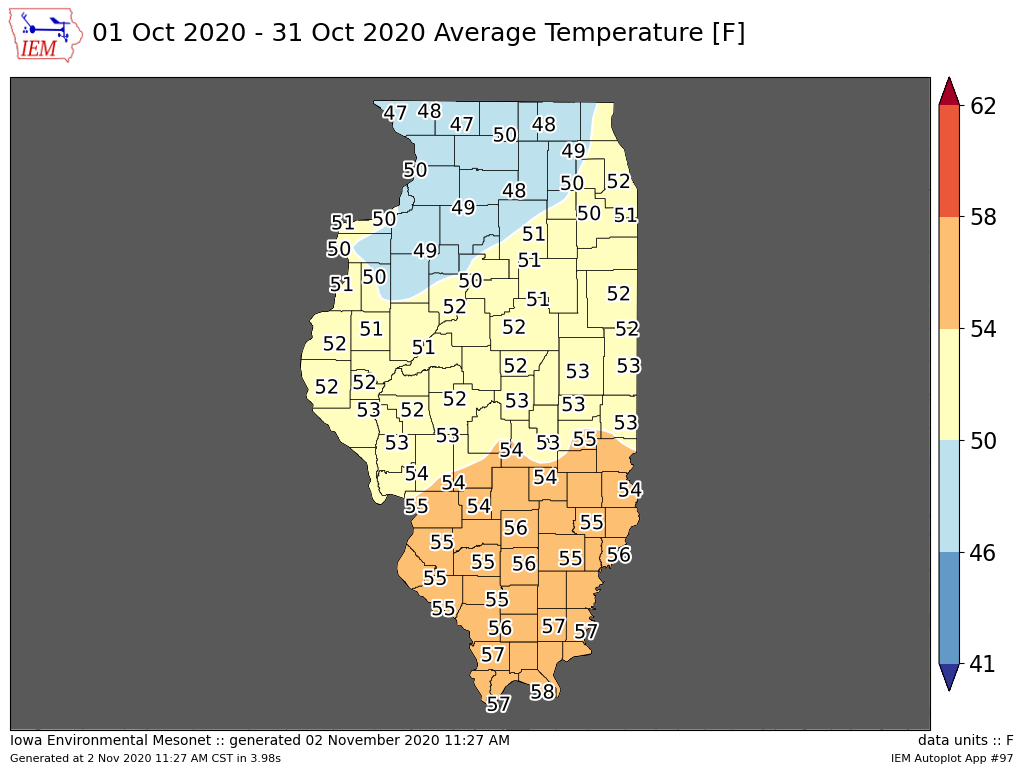
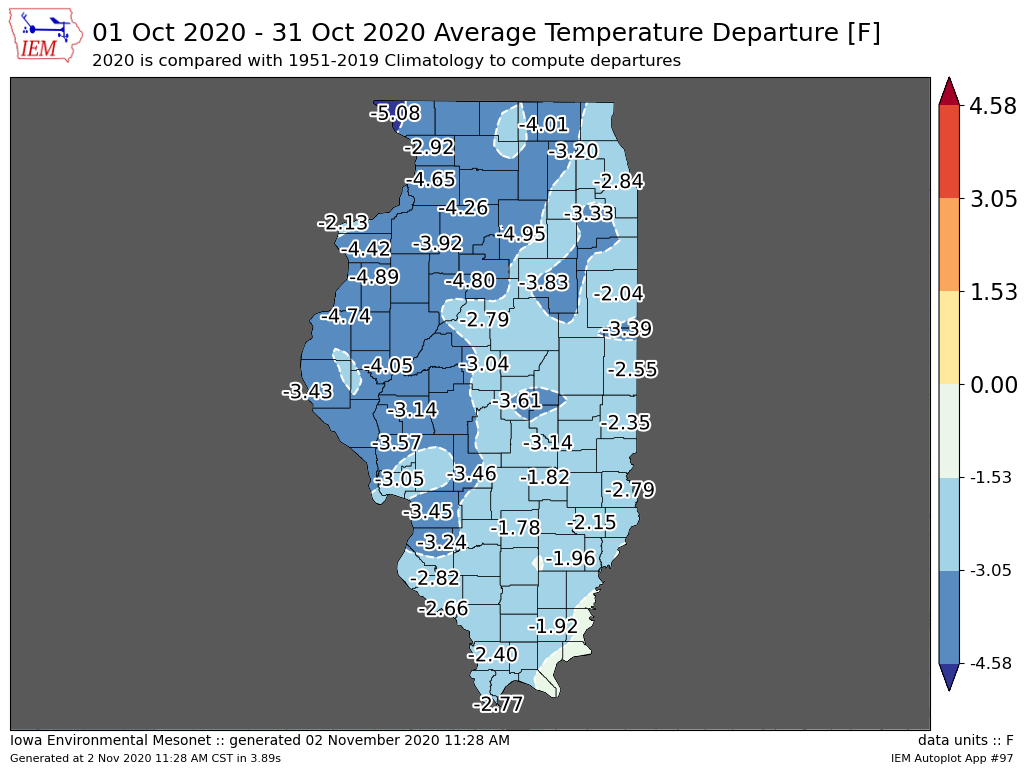
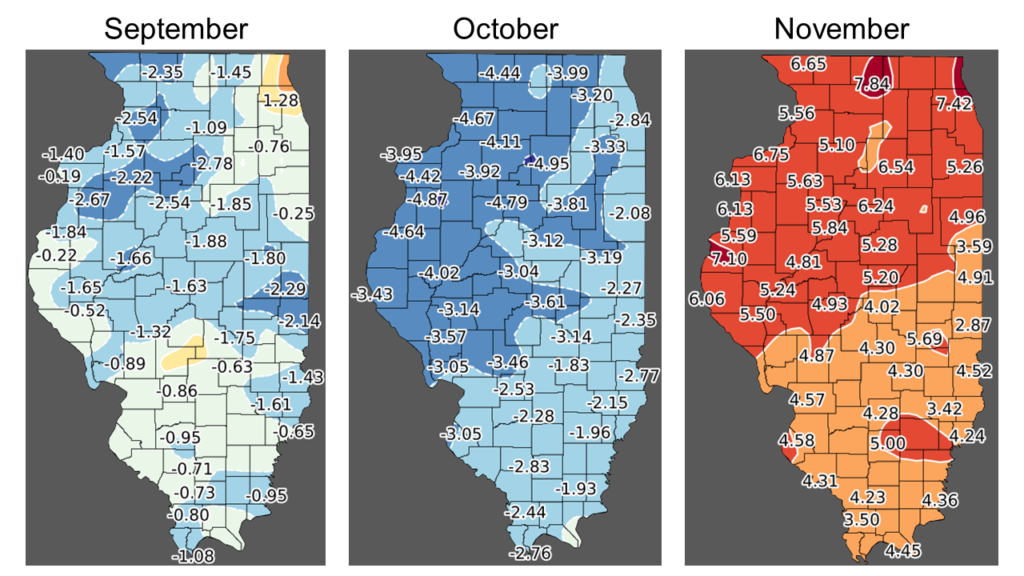
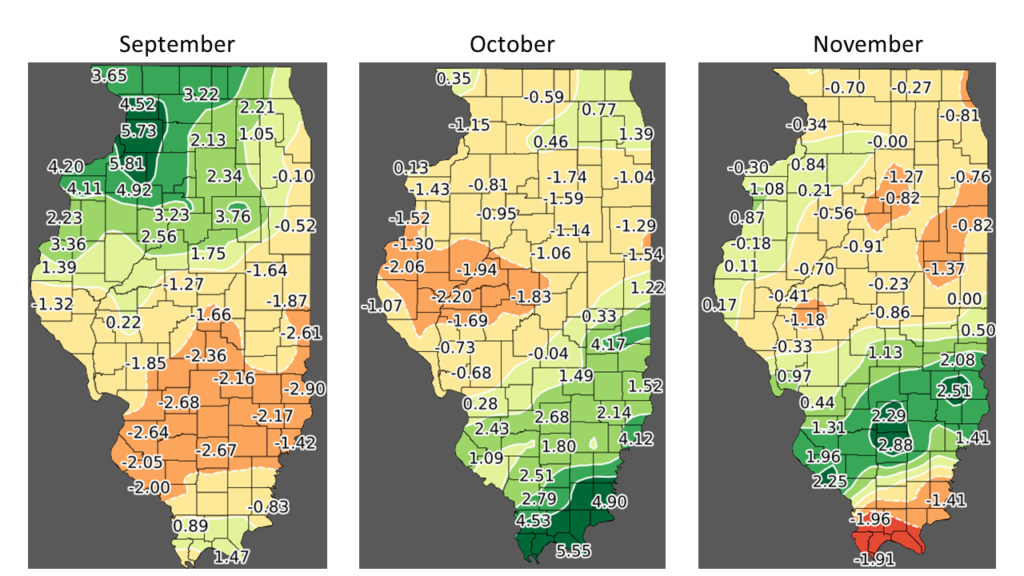
November was the temperature outlier this climatological fall season, as both September and October were cooler than normal statewide. The maps below show monthly average temperature departures in each of the three fall months. Overall, the preliminary 2020 climatological fall season average temperature was 54.7 degrees, which was 0.3 degrees above the 30-year normal and tied for 46th warmest fall on record.

November Precipitation

Last month began with the end to daylight savings time. The ensuing onslaught of 4:30 p.m. sunsets has me quoting the great philosopher Axl Rose: “So never mind the darkness, we can still find a way. ‘Cause nothin’ lasts forever, even a cold November rain.”

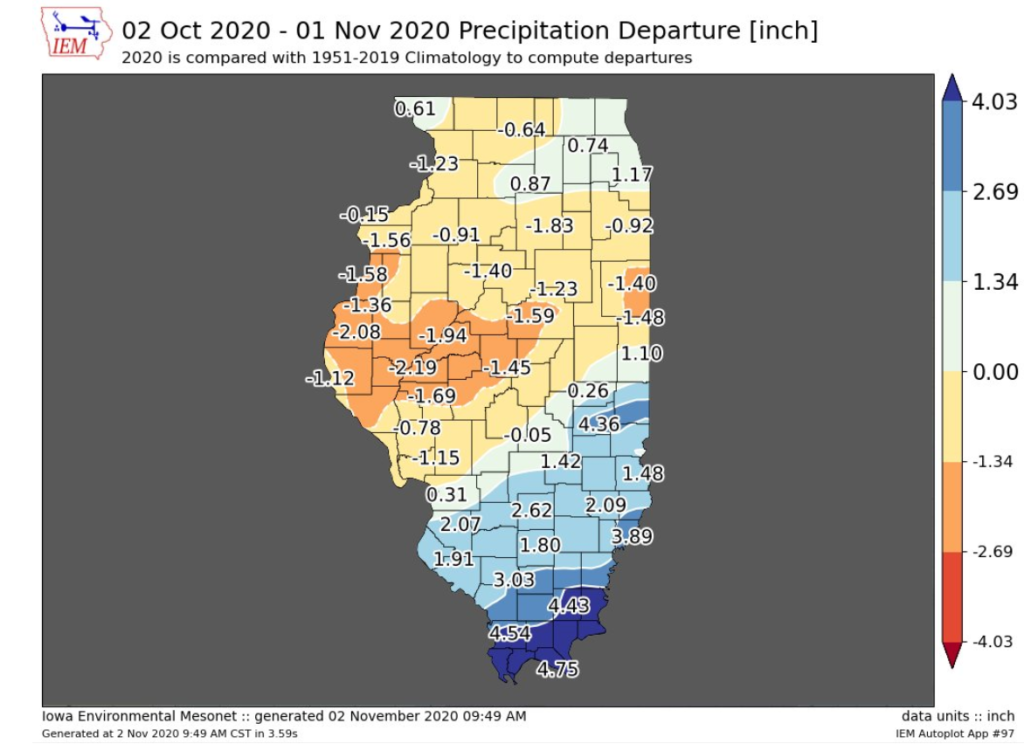
As the maps below show, November total precipitation ranged from less than an inch in Iroquois and Kankakee counties in eastern Illinois to nearly 8 inches in southern Illinois. A broad area of the state from Jacksonville to Chicago was 1 to 2 inches drier than average last month, while the Interstate 64 corridor was 1 to 2 inches wetter than average.  Statewide total November precipitation was 2.94 inches, approximately 0.53 inches below the 30-year normal and 70th driest on record.

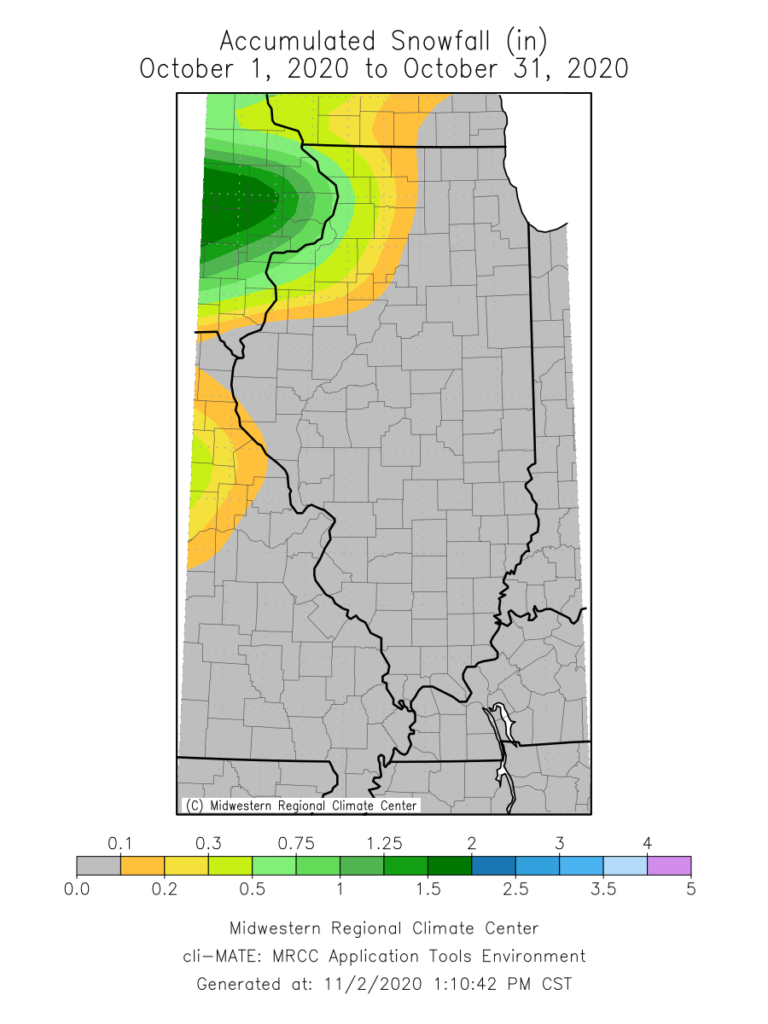
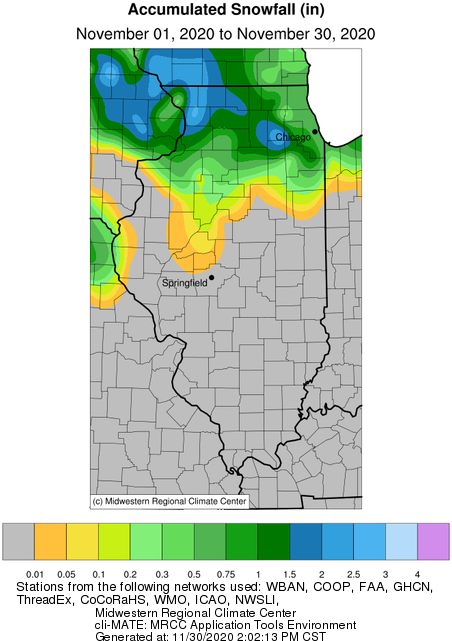
As the map below shows, measurable snowfall stayed north of Interstate 72 last month, with the exception of small accumulation in Hancock and Adams counties. Areas in northwest Illinois and the far western Chicago suburbs recorded over 3 inches of November snowfall, while totals farther south remained less than an inch. A snow-free November is not unusual in central and southern Illinois, but the very high temperatures last month certainly played a role in keeping the white stuff in the northern third of the state.

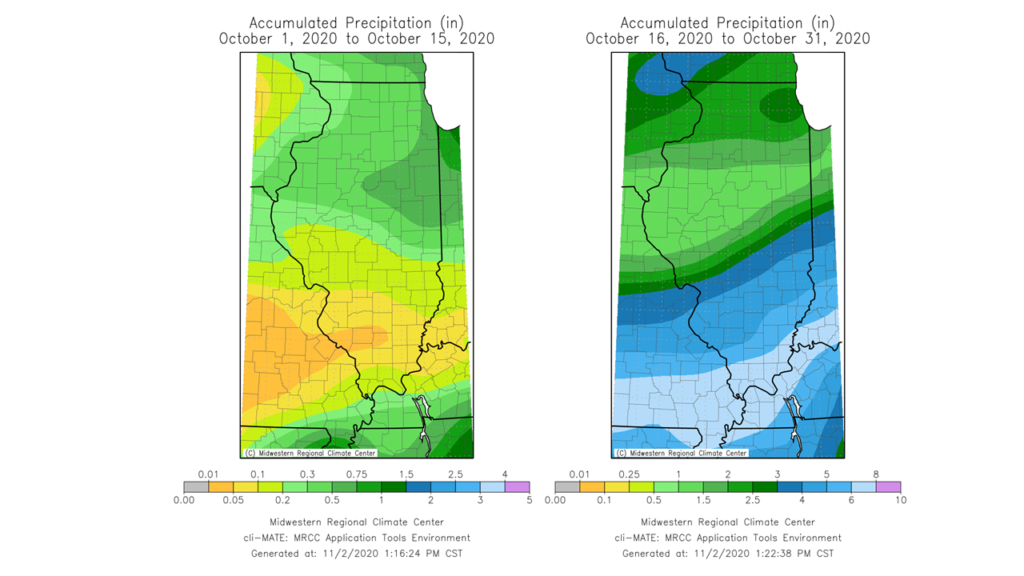
Precipitation this climatological fall season has been quite variable in northern and southern Illinois, as the maps below show. Northwest Illinois was 4 to 6 inches wetter than normal in September, while most of southern Illinois was 1 to 3 inches drier than normal. This pattern flipped in October, and far southern Illinois observed 4 to 6 inches of additional precipitation.

Overall, the preliminary 2020 climatological fall season total precipitation was 9.07 inches, which was 0.87 inches below the 30-year normal and 65th driest fall on record.

Drought Continues in Central Illinois

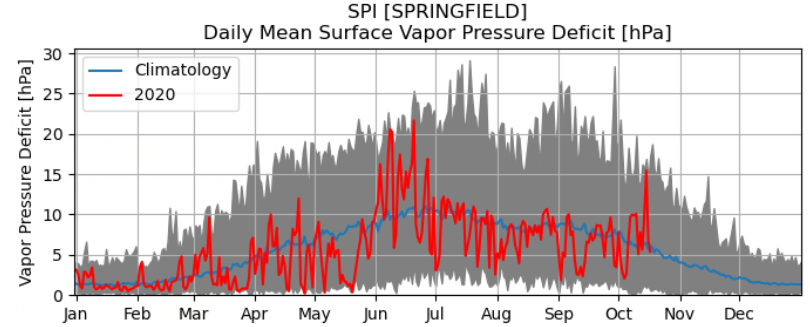
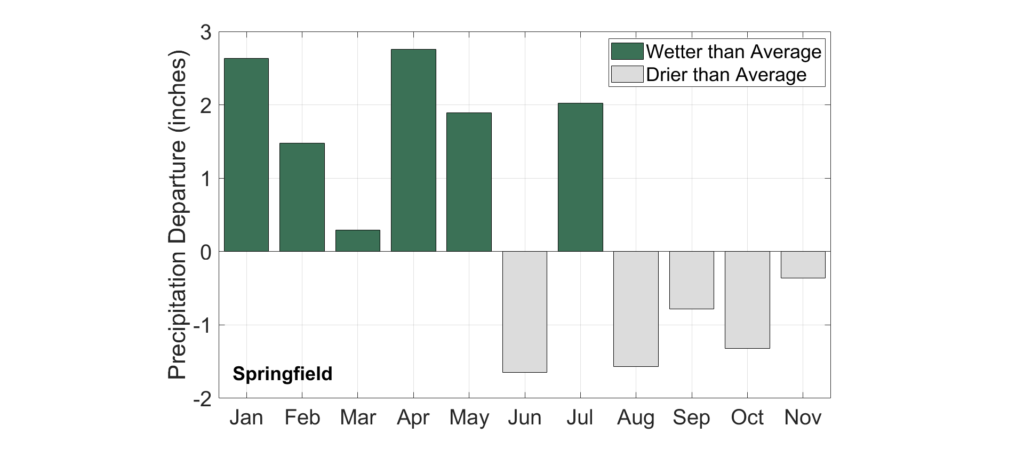
Climatological summer was drier than average for most of central Illinois, and this pattern continued throughout fall. The plot below shows that Springfield has experienced four consecutive drier than average months, with a cumulative precipitation departure over 5 inches since Aug. 1.

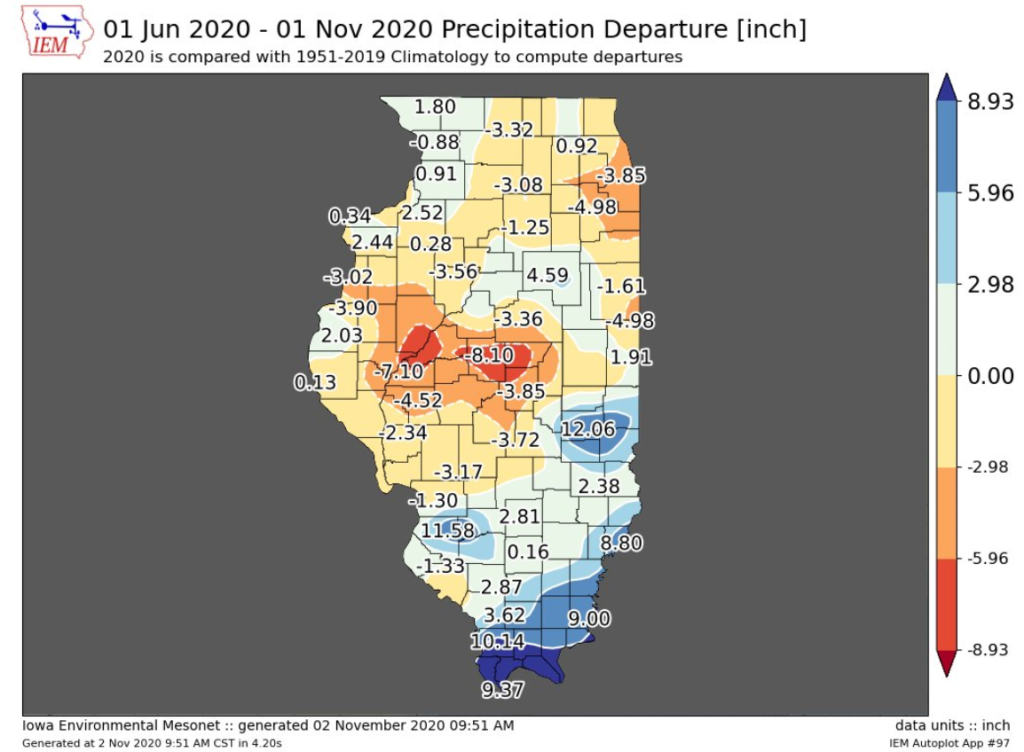
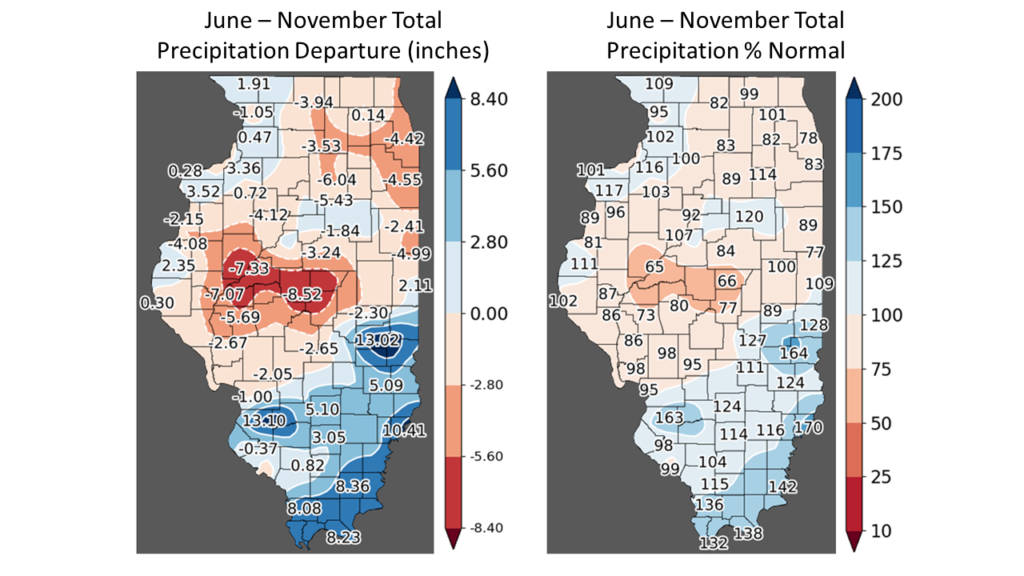
The maps below show 6-month (June–November) precipitation departure from average and percent of average statewide. An area from Fulton County to DeWitt County in central Illinois has experienced a 7 to 9 inch precipitation deficit since June 1, representing between 65% and 75% of normal 6-month precipitation.

The most recent (Nov. 24) version of the U.S. Drought Monitor showed widespread moderate drought from Sangamon County to Kankakee County and severe drought in the driest area of central Illinois. Most of the state between Interstates 70 and 80 is considered abnormally dry, following below average precipitation in October and November.

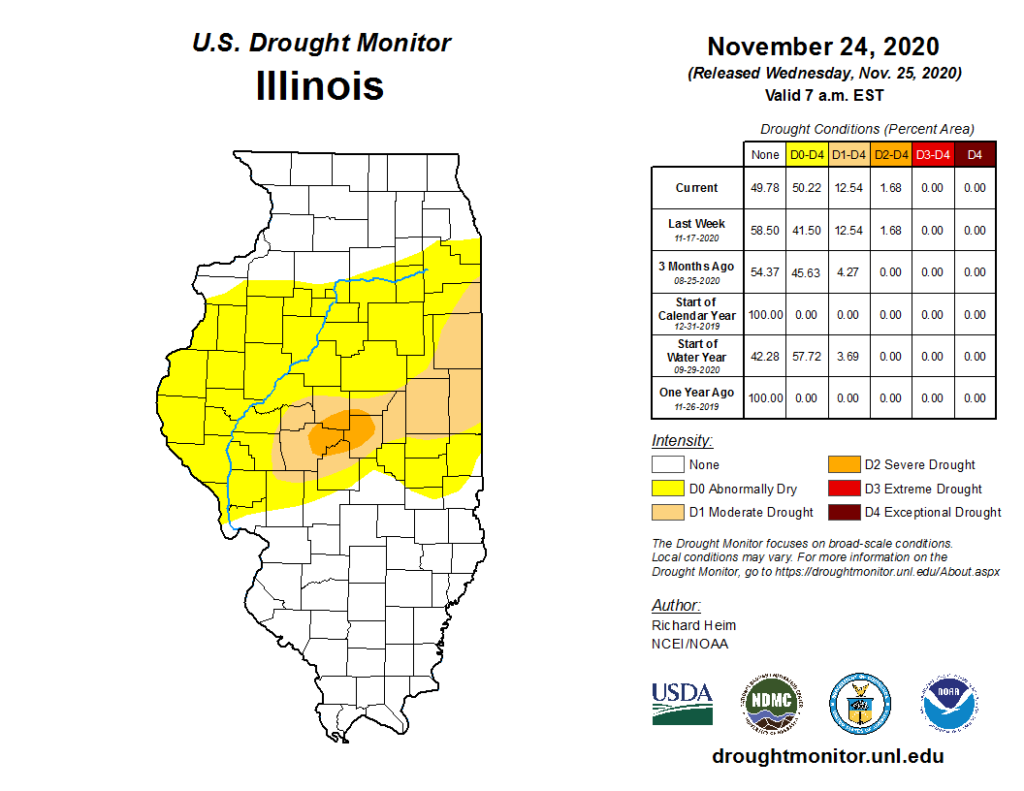
Soil moisture across the central part of the state is near normal to well below normal in response to precipitation deficit. However, despite the prolonged dryness, the figure below shows the total estimated amount of water in the top 40-inch soil column in Springfield is right at the 18-year median level. The soil water estimates are based on observations from the Illinois Climate Network.

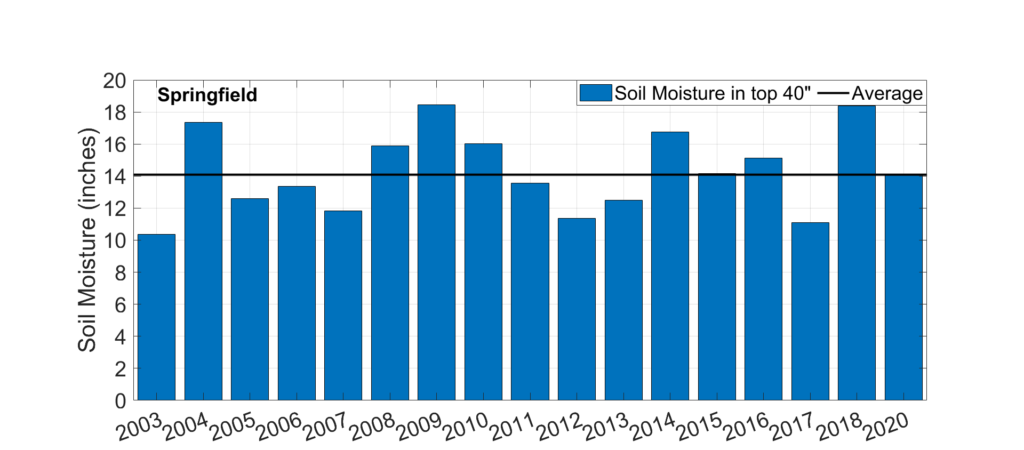
Although both top- and sub-layer soil moisture are less than in each of the last two years in central Illinois, soil moisture levels are still near to slightly below average. Therefore, a normal to wetter than normal winter season could help recharge soil moisture and reduce drought concern moving into next spring.
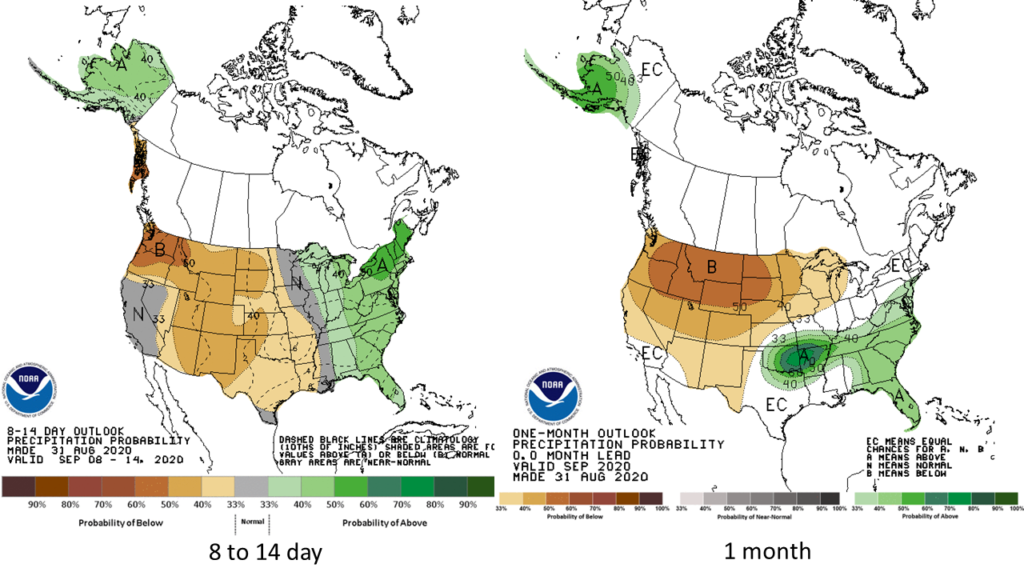
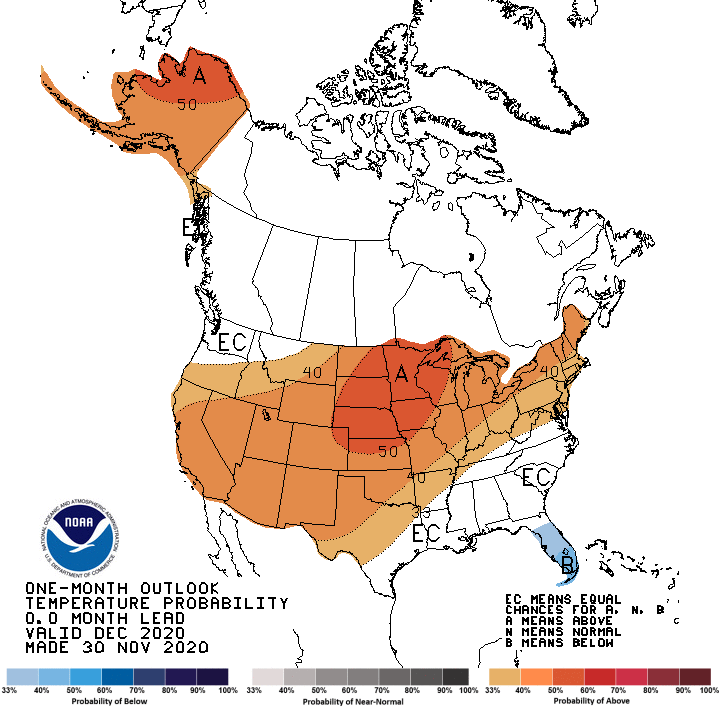
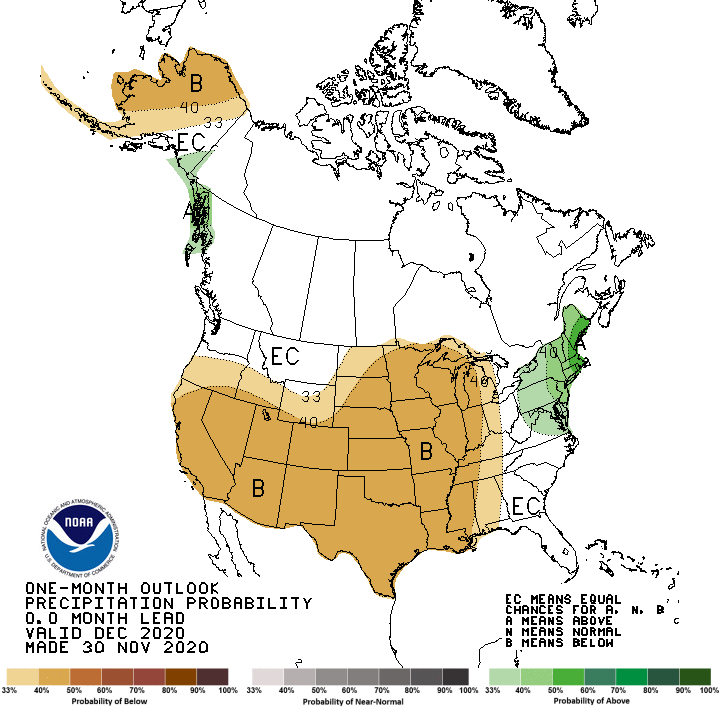
Outlooks

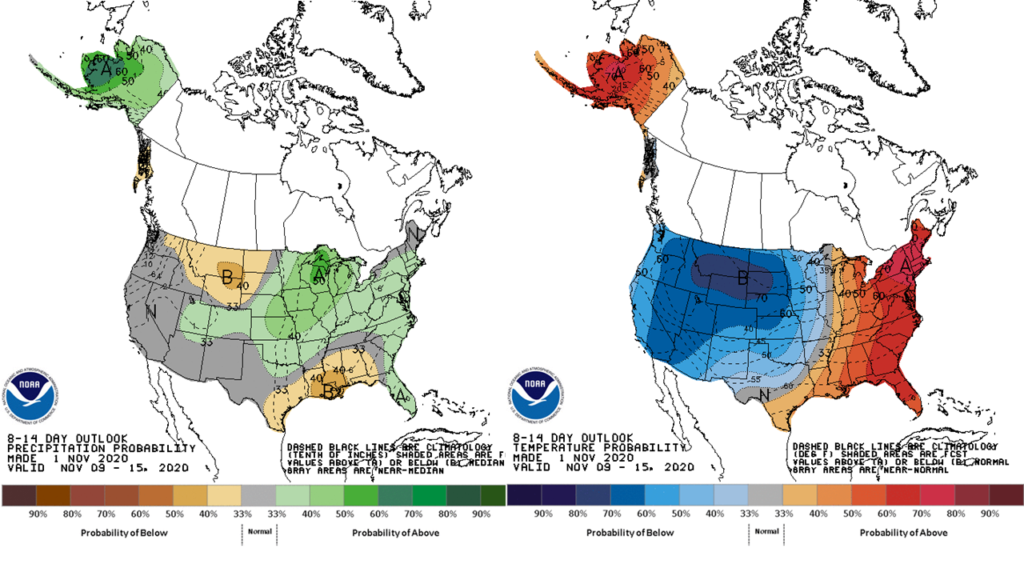
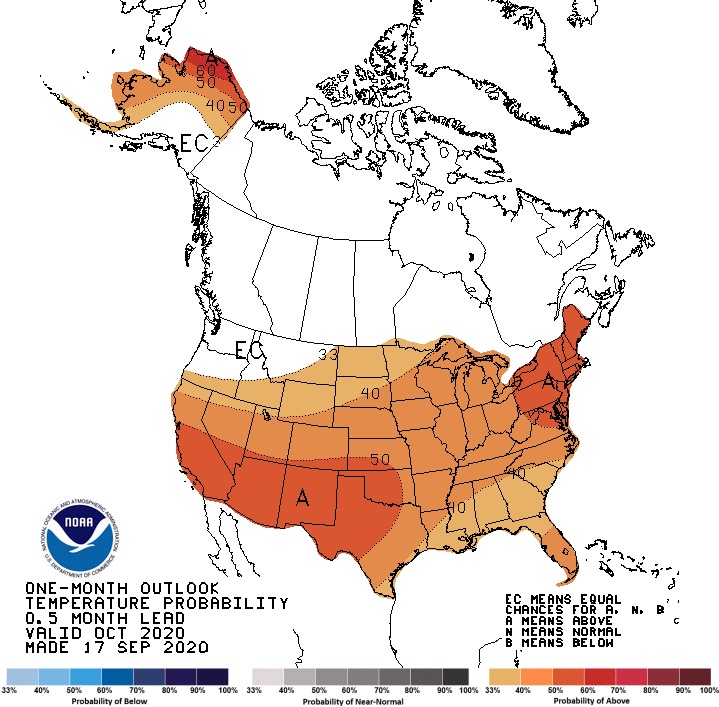
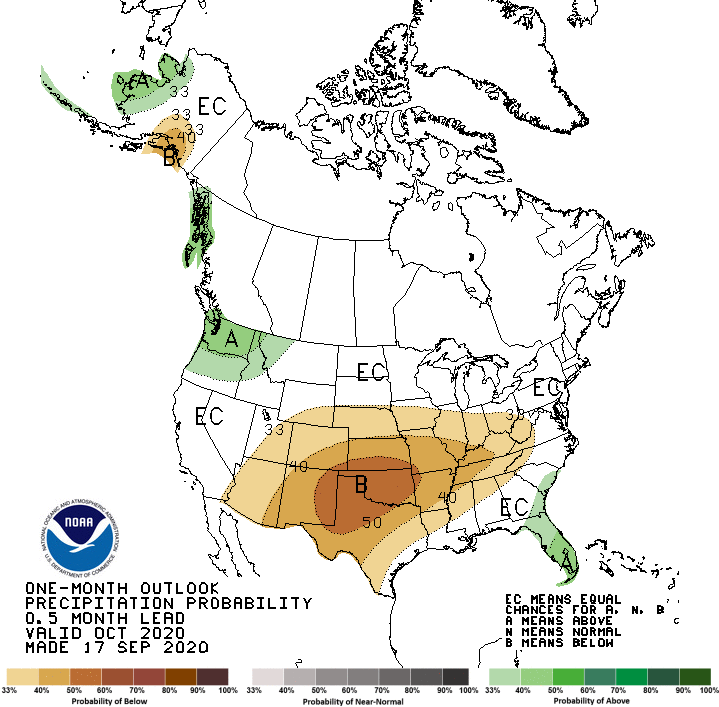
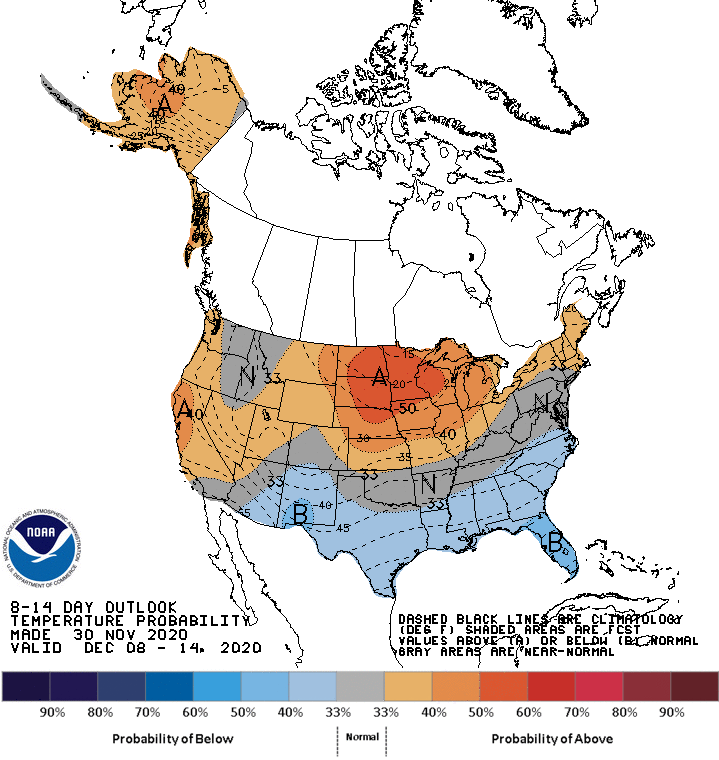
The Climate Prediction Center’s 8- to 14-day outlooks indicate highest odds of a continuation of warmer and drier than normal conditions across the state in the second week of December.

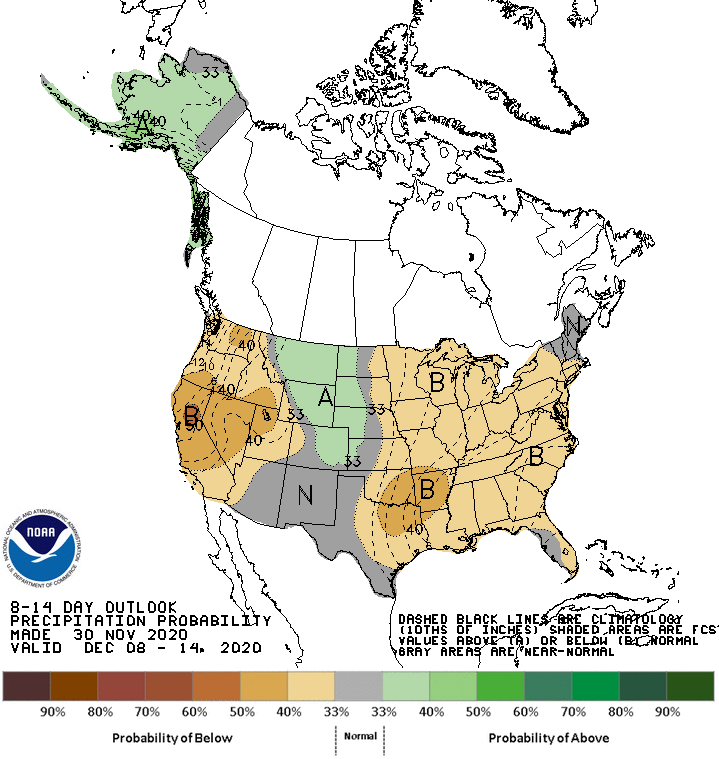
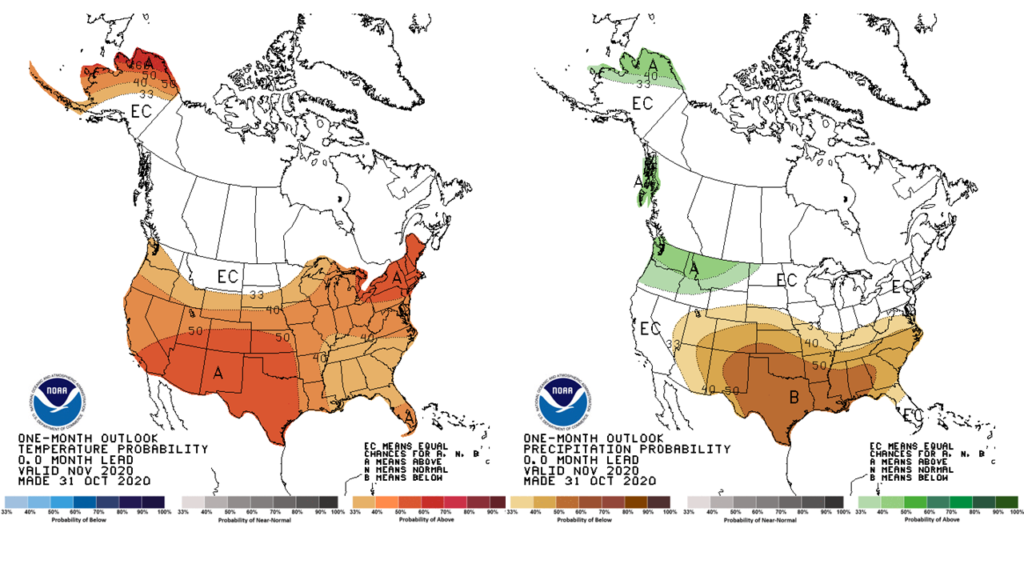
The outlooks for the entire month of December are similar, with elevated odds of above normal temperatures and below normal precipitation statewide.

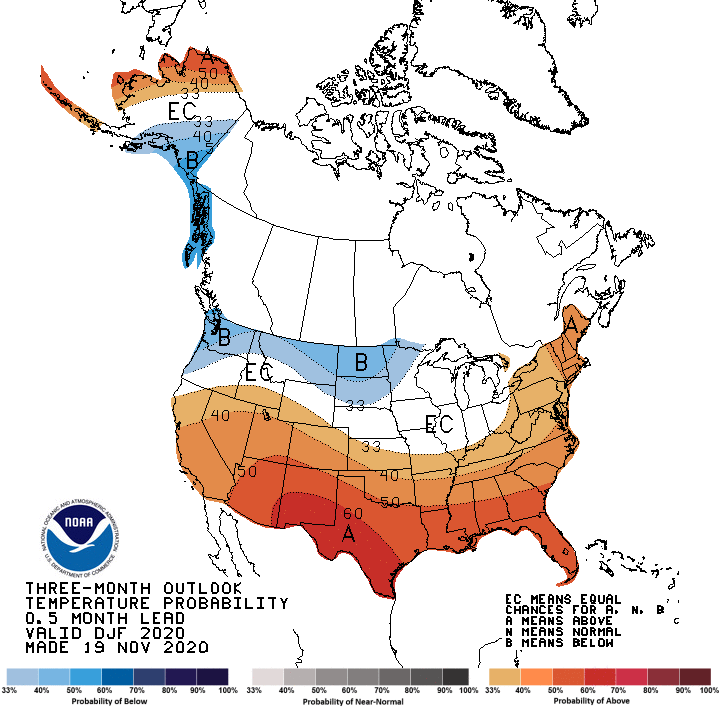
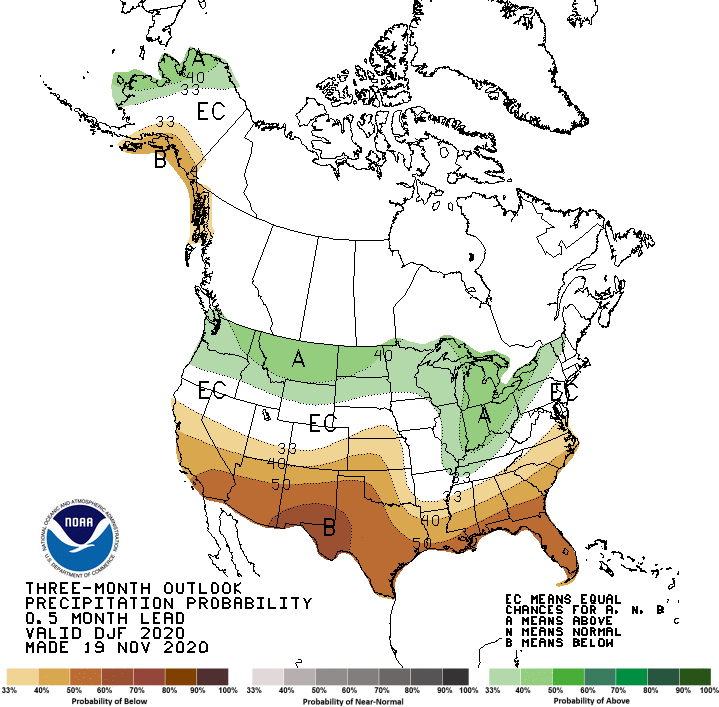
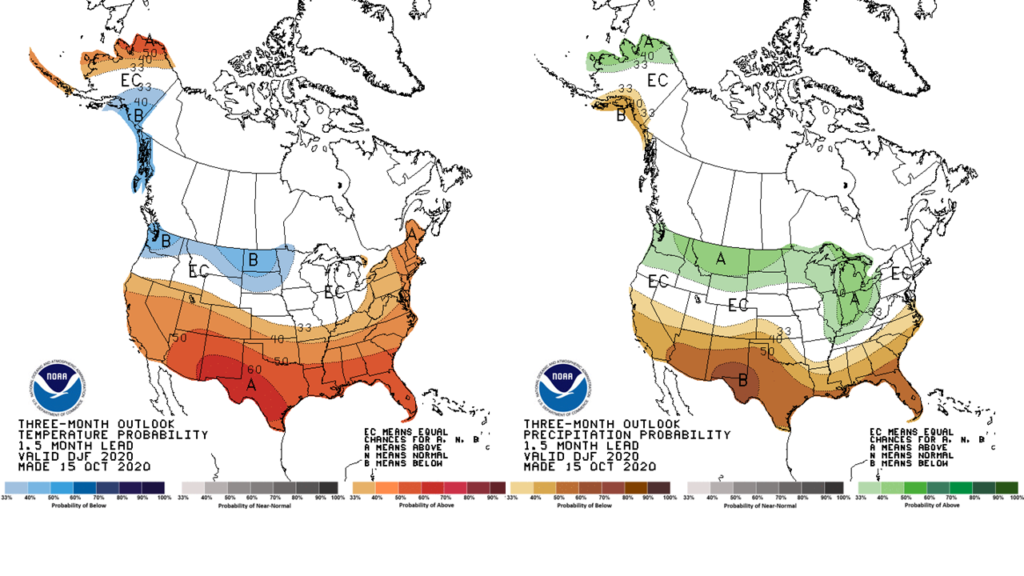
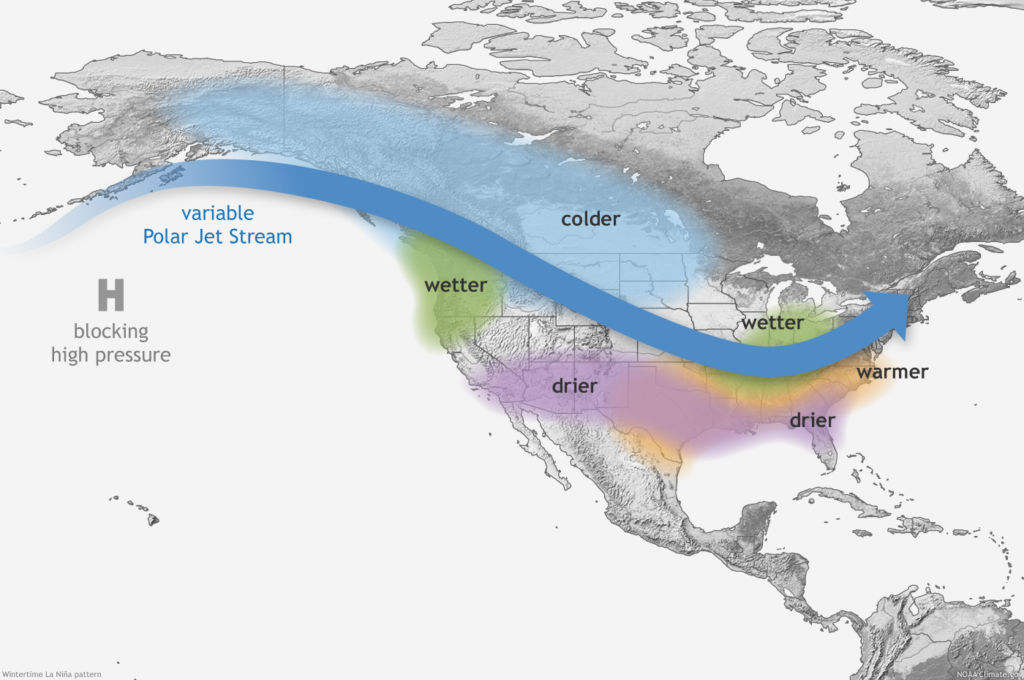
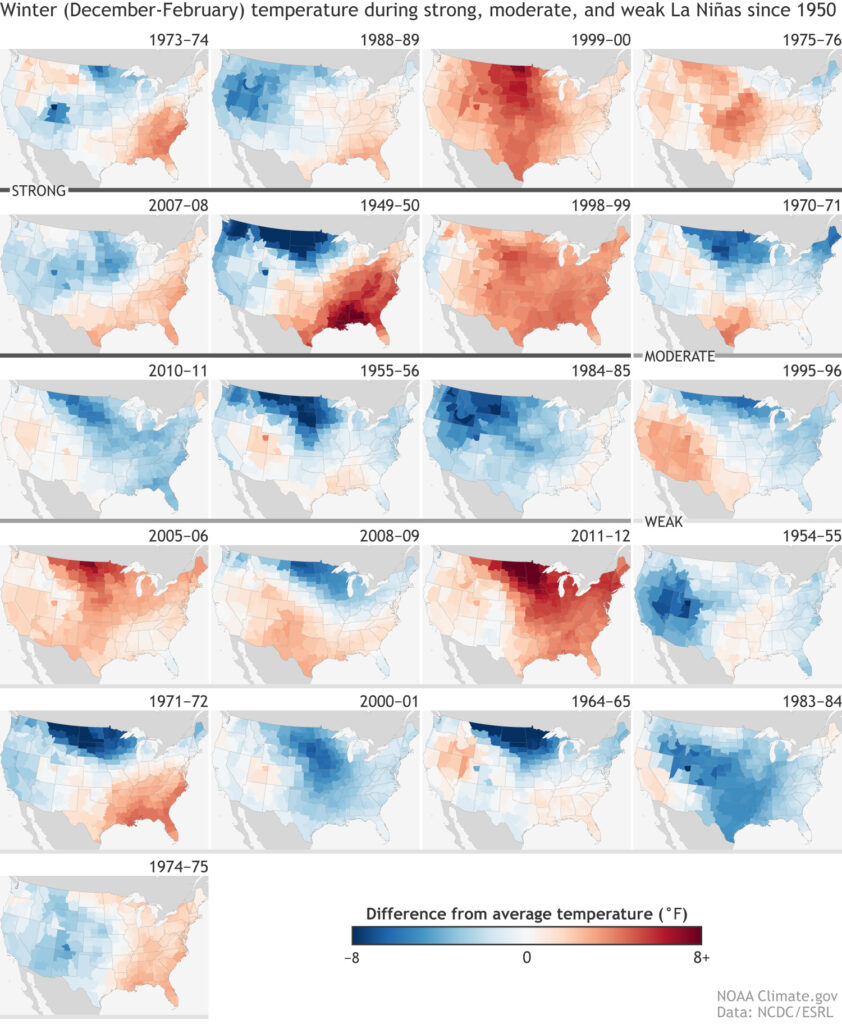
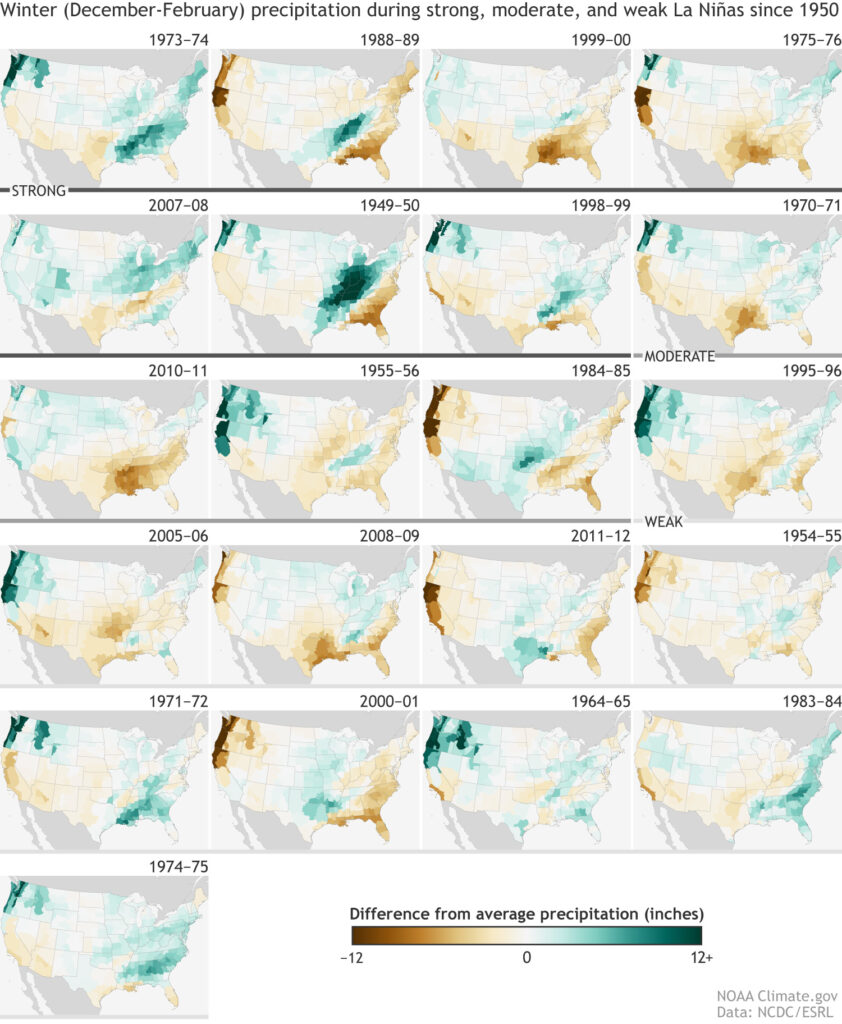
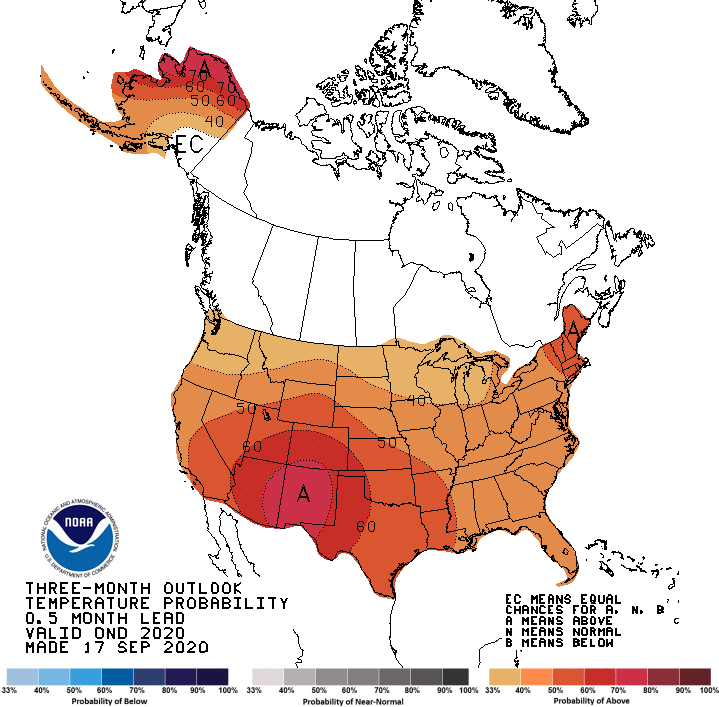
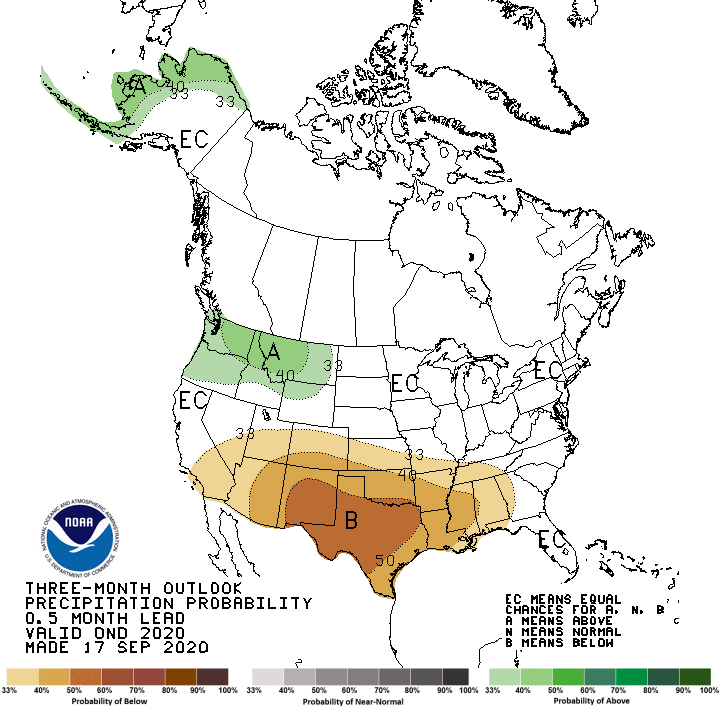
Finally, the most recent three-month outlooks for climatological winter, December–February, lean into La Niña conditions with highest odds for wetter than normal weather and equal chances of warmer or colder than normal weather in Illinois.

Cool Fall Temperatures Continued in October

October was much cooler and slightly drier than average across Illinois. The preliminary statewide average October temperature was 51.8 degrees, 2.6 degrees below the 30-year normal, and tied for the 19th coolest on record. Preliminary statewide average total precipitation for August was 3.03 inches, 0.21 inches less than the 30-year normal, and the 54th wettest on record.

Data are provisional and may change slightly over time

October Temperatures

Cool weather persisted from the end of September to the first week of October across the state. As the plot below of daily temperature departures from normal in Moline shows, the second week of October was 5 to 10 degrees warmer than average across the state. However, this was followed by a predominantly cooler than average second half of the month.

Eleven daily high maximum temperature records and eight daily high minimum temperature records were broken last month. Concurrently, 66 daily low maximum temperature records and 19 daily low minimum temperature records fell in October. The cool, cloudy day of October 27 broke the month’s low maximum temperature records at seven locations in Illinois. This included the 34-degree high in Kewanee in Henry County, which broke the previous October low maximum temperature record of 36 degrees, set just last year on Halloween.

The maps below show October average temperatures and their departure from the long-term average. October average temperatures ranged from the high 40s in northwest Illinois to the high 50s in southern Illinois, between 2 and 5 degrees below average. The preliminary statewide average October temperature was 51.8 degrees, 2.6 degrees below the 30-year normal and tied for the 19th coolest on record. This follows the cooler than normal months of August and September statewide.

Harvest Fires

The combination of high temperatures, very low humidity, and strong winds created a significant fire risk during the second week of October. The plot below shows a daily mean surface vapor pressure deficit, a measure of atmospheric humidity, at Springfield between January 1 and October 18 of this year (red line) compared to all previous years (gray shaded area). A vapor pressure deficit has been linked to wildfire risk, with higher vapor pressure deficit values indicating a higher risk of wildfire outbreak.

The very high values of vapor pressure deficit in Springfield, near record values on October 14, indicated a warm, dry atmosphere. Existing drought and crops drying down in fields provided ample, dry fuel for wildfire potential. Indeed, several small- to medium-sized field fires broke out across central and south-central Illinois during the second week of October.

First Snow of the Season

The map below shows the climatological earliest first measurable snowfall on record at stations across the state. The dates range from early to mid-October in northern Illinois to mid-November in southern Illinois.

The map below shows the climatological earliest first measurable snowfall on record at stations across the state. The dates range from early to mid-October in northern Illinois to mid-November in southern Illinois.

A Wet End to the Month in Southern Illinois

The first half of October was very dry for the southern half of the state, continuing a very dry September. However, around the middle of the month the atmosphere moved into a pattern more conducive to bringing precipitation into southern Illinois. Areas that received less than a tenth of an inch of rainfall in previous weeks saw widespread 4- to 9-inch precipitation totals during the final two weeks of October.

Belleville, for example, recorded its third wettest October with a total of 7.38 inches, following its wettest August and its second wettest July on record. At the end of October, Belleville was only 4 inches away from its wettest year on record, which was 2008 with 56.83 inches of rain.

Drought Continues in Central Illinois

In contrast to the wet end of October in southern Illinois, much of central Illinois ended yet another month with below average precipitation. The maps below show 30- and 180-day precipitation deficits across the state. Most of central and western Illinois received between 1 and 3 inches below average precipitation in October, adding to existing precipitation deficits from dry months in August and September.

Total six-month precipitation deficits in central Illinois exceed 7 inches in Fulton and Mason Counties and 8 inches in parts of Logan and Macon Counties. At Mount Pulaski in Logan County, for example, the June 1 to November 1 precipitation deficit of 8.47 inches is the third largest on record, smaller only than 1988 and 1893. However, it should be noted that Mount Pulaski and the surrounding areas of Logan and Macon Counties received more precipitation in the first four months of this year than in all of 1988. Therefore, drought conditions, although severe, are not nearly to the extent of those in 1988.

The most recent, October 27th version of the U.S. Drought Monitor showed continued widespread moderate drought across central Illinois in response to the rainfall deficits and below normal soil moisture and streamflow.

Outlooks

Pleasant weather is in store for the state during the first week of November. However, the Climate Prediction Center’s 8- to 14-day outlooks indicate an imminent pattern change in the second week of November, with odds moving back to below average temperatures, especially to the northwest, and above average precipitation statewide.

The most recent one-month outlooks for the entire month of November continue to show a strong La Niña influence, with elevated odds of warmer than normal conditions throughout the central U.S. and drier than normal weather in the south.

Finally, the three-month outlooks for climatological winter, December–February, show equal chances of warmer or colder than normal conditions in Illinois. However, the odds increase for wetter than normal conditions later in winter.

La Niña Conditions for Fall & Winter

A couple of weeks ago the NOAA Climate Prediction Center issued a La Niña advisory, which indicates that La Niña conditions were observed during the month of August and have a 75% chance to continue through climatological winter (December – February). Information on the advisory and a more diagnostic discussion can be found here: https://www.cpc.ncep.noaa.gov/products/analysis_monitoring/enso_advisory/ensodisc.shtml.

La Niña refers to one phase of the El Niño-Southern Oscillation or ENSO, the interaction between the ocean and atmosphere in the tropical Pacific that results in variations in sea surface temperatures, air temperatures, and precipitation. Because of the importance of the Pacific Ocean in the global climate, ENSO not only affects tropical climates but also climates of regions outside of the tropics, including here in the Midwest.

The following websites contain more deailed information on La Niña and ENSO more generally.

NOAA Climate.gov: https://www.climate.gov/enso

Columbia University: https://iridl.ldeo.columbia.edu/maproom/ENSO/ENSO_Info.html

North Carolina Climate Office: https://climate.ncsu.edu/climate/patterns/enso

Typical La Niña Winter

Ocean-atmosphere interactions modulated by ENSO can modify atmospheric circulation and affect remote climates, including the Midwest. These impacts are typically largest in climatological winter. The graphic below shows the typical La Niña impacts to winter climate across North America. La Niña winters tend to be wetter than average in the eastern Midwest, particularly in the Ohio Valley, whereas they tend to be colder than average in the northwest Midwest.

Typical La Niña impacts on winter weather in North America. Taken from NOAA Climate.gov: https://www.climate.gov/news/features/featured-images/how-el-ni%C3%B1o-and-la-ni%C3%B1a-affect-winter-jet-stream-and-us-climate.

The maps below show a different perspective on the impacts of La Niña on Midwest Winter climate. Specifically, the maps show the correlation between temperature/precipitation and the Southern Oscillation Index, a common indicator of ENSO conditions that is based on the observed sea level pressure differences between Tahiti and Darwin, Australia. Positive SOI values typically coincide with La Niña conditions. The top map shows correlations between SOI and winter air temperature across the U.S. The areas shaded in green exhibit a negative correlation between SOI and temperature, meaning that La Niña winters in these areas tend to be colder than average. The bottom map shows correlations between SOI and winter precipitation across the U.S. In this case, the eastern half of Illinois is shaded yellow, indicating a positive correlation. This suggests that La Niña winters tend to be wetter than average in northern and eastern Illinois.

The previous maps imply La Niña winters in Illinois tend to be colder and wetter. However, ENSO is only one of many features that influence winter weather in Illinois. Other impactful features include sea surface temperature and sea level pressure in the north Pacific, temperatures and sea ice extent in the Arctic, and long-term trends in both winter temperature and precipitation. The maps below are taken from NOAA’s Climate.gov website and show winter temperature and precipitation anomalies across the U.S. during every La Niña since 1950. Although most La Niña winters tend to be wetter than average in Illinois, we have also experienced drier than average La Niña winters as well.

Fall to Winter Outlooks

ENSO is an important part of seasonal climate forecasting, and the latest outlooks from the Climate Prediction Center are influenced by ongoing La Niña, while also showing influence from long-term trends and current soil moisture conditions. One-month outlooks show elevated odds of both warmer than drier than normal conditions in October.

The three-month outlooks show continued elevated chances of warmer than normal conditions, but equal chance of above, below, and normal precipitation for the period October through December.

Cool, Warm, Wet, Dry, and a Derecho: A Wild August Ends Climatological Summer

August was slightly cooler and much drier than average across Illinois. The preliminary statewide average August temperature was 72.7 degrees, 0.9 degrees below the 30-year normal and the 45th coolest on record. Preliminary statewide average total precipitation for August was 2.01 inches, 1.58 inches below than the 30-year normal and the 15th driest on record.

Data are provisional and may change slightly over time

August Temperatures

Following the warmer than average months of June and July, August began much cooler than average. The below average temperatures persisted through the third week of the month in response to a persistent atmospheric trough over the central U.S. The map below shows temperatures were between 1 and 4 degrees below average through the first three weeks of August.

Between August 1 and 21, 43 daily low maximum temperature and 6 daily low minimum temperature records were broken across the state. This included a 70-degree high temperature in Salem in Marion County, which broke the previous record by 10 degrees.

As the ridge in the western U.S. broke down in the third week of August, heat spread east, and Illinois temperatures switched to considerably above average. As the map below shows, temperatures in the week of August 22 were 1 to 10 degrees above average with the highest departures in northern Illinois.

During this fourth week of August, 10 daily high maximum temperature and 6 daily high minimum temperature records were broken. Mount Carroll in Carroll County broke or tied their daily high maximum temperature records on three consecutive days between August 25 and 27. Most stations observed daily high temperatures in the 90s this week, including five consecutive 90+-degree days in Rockford. This was the longest such streak in Rockford in August since 2011. The station at Chicago’s O’Hare Airport observed 10 days with a high temperature at or above 90 degrees last month. This is tied for the sixth most 90+-degree days at O’Hare, going back to 1959, and the most since 2012. The climatological average August frequency of 90+-degree days at O’Hare is 4. This is compared to the station in Carbondale that typically experiences 11 90+-degree days in August, but only observed 4 this last month.

Although the fourth week of August was unusually warm in northern Illinois, temperatures were closer to average in southern Illinois. The plot below shows daily temperature departures in Rosiclare in Hardin County. The southeast Illinois climate division, containing Rosiclare, experienced its eighth coolest August on record.

The statewide August temperature was 72.7 degrees, nearly 1 degree below the 30-year normal. The maps below show that average temperatures were in the mid- to high 70s across the state last month, very close to the long-term average in northern Illinois, and between 1 and 4 degrees below average in southern Illinois.

The maps below show the climatological summer (June–August) 2020 maximum, average, and minimum temperature departures from average. June and July this year were both in the top 30 warmest months on record, resulting in an overall warmer than average summer in northern Illinois. However, the cooler August pushed summer temperatures within a degree of the long-term average in most of southern and south-central Illinois.

August Derecho

August was not without its fair share of severe weather. On August 10, a strong mesoscale convective system moved across the Upper Midwest. The system intensified in the eastern Dakotas and caused a derecho–a widespread, long-lived windstorm–that impacted areas of Iowa, Illinois, Wisconsin, and Indiana. A derecho is characterized by strong straight-line winds that can exceed 75 mph and often affect areas between 250 and 500 miles. Dr. Marshall Shepherd at the University of Georgia provides an excellent description in his piece in Forbes: https://www.forbes.com/sites/marshallshepherd/2020/08/10/what-is-a-derecho/#44cb250c3b8e.

The derecho on August 10 produced observed winds exceeding 100 mph and estimated (from damage) wind gusts up to 140 mph across east-central Iowa. Based on initial reports, the derecho damaged between 6 and 10 million acres of crops across Iowa and northern Illinois. In addition, the winds caused significant damage and destruction in residential and urban areas. The city of Cedar Rapids, Iowa was hit particularly hard. The local newspaper reported estimates of over 20,000 trees downed in Cedar Rapids alone (https://www.thegazette.com/subject/news/derecho-by-the-digits-numbers-help-tell-the-story-of-the-storm-20200830), causing hundreds of thousands to lose power and remain without power for several days. The storm also resulted in four fatalities, three in Iowa and one in Indiana.

Along with the derecho, the storm produced 15 confirmed tornadoes in the Chicagoland area. The figure below is from the Chicago National Weather Service, showing the tracks of these tornadoes, including a couple that moved through the city of Chicago.

More research is necessary to better understand the environment that produces a derecho, and the corresponding warning of these events and risks they pose. One paper by Guastini and Bosart in Monthly Weather Review (https://journals.ametsoc.org/mwr/article/144/4/1363/72372) found northern Illinois experiences a derecho once every two years. However, not all derecho events are as large, long-lived, and intense as the event earlier last month.

Southern Illinois Remains Wet

Statewide August total precipitation was 2.01 inches, 1.58 inches below the 30-year normal and the 15th driest on record. However, like the varying temperatures, the southern and northern halves of the state experienced two very different August precipitation patterns. The maps below show August total precipitation and departures from average across the state. August totals ranged from less than a quarter of an inch in northwest Illinois to over 8 inches in southwest Illinois. In general, the northern half of the state experienced 1 to 4 inches below average, while most of southern Illinois experienced a 1 to 3 inches above average rainfall last month.

We can contrast the two halves of the state by comparing total rainfall in the Quad Cites with that in the St. Louis Metro East. The station at the Quad Cities Airport in Moline observed just 0.15 inches of total rain in August, which was less than half the previous low August total record of 0.35 inches in 1971 (see plot below).

As the Quad Cities experienced their driest August on record, the station at the SIU Research Farm in Belleville observed their wettest at over 10 inches of total rainfall last month. Of particular note was a strong thunderstorm that moved through the St. Louis area on August 12, producing heavy rainfall for the Metro East area. The station at Scott Air Force Base near Belleville recorded 5.36 inches in only three hours from this storm. The heavy rain produced flash flooding across the area, including multiple hangars on the base that were flooded. According to new estimates from the Illinois State Water Survey’s Bulletin 75 (https://www.ideals.illinois.edu/handle/2142/106653), this was approximately a 125-year rainfall event.

Northern Illinois Drought

July was slightly drier than average across most of northern Illinois. The first week of August was somewhat wet across the state; however, for most areas of northern and central Illinois, more rain fell in the first week of August than in the last three weeks of the month. The rainfall deficit was somewhat offset by below average temperatures during the first few weeks of the month. However, as heat began to set in and the northern half of the state experienced multiple, consecutive 90-degree days, the lack of moisture became quite apparent.

The plot below shows the daily accumulated difference between precipitation and reference evapotranspiration–an indicator of atmospheric evaporative demand–at the Illinois Climate Network Monmouth station. Looking at dry conditions through this lens provides a water balance perspective. The Monmouth record shows a positive water balance at the beginning of the month due to precipitation. However, the subsequent lack of rainfall after August 5 results in a negative water balance that is accelerated in the final weeks of the month. The station in Monmouth ended the month with an over 4-inch moisture deficit.  

In response to pervasive dry conditions in northern Illinois, most of the area is considered abnormally dry in the August 25 edition of the U.S. Drought Monitor (below). There are also pockets of moderate drought in western and northeast Illinois in response to agricultural and ecological impacts of the dryness.

Climatological summer (June–August) precipitation patterns are like those in August, with contrasting conditions in northern and southern Illinois. The northern half of the state finished summer with between 1 and 4 inches below average precipitation, while southern Illinois was 1 to 6 inches wetter than average this last season. The official summer season rankings will be released later this month, but it is worth mentioning that statewide total summer precipitation has only been below the 30-year normal 3 out of the last 10 years (2017, 2013, and 2012).

Outlooks

The late August heat will likely be replaced by cooler than average conditions throughout September. The Climate Prediction Center’s 8- to 14-day outlook and 1-month outlook both indicate strongly elevated odds of below normal temperatures.

Precipitation outlooks are mixed. The 8- to 14-day outlook indicates weakly elevated odds of wetter than normal conditions in the eastern half of the state to start September, with near normal precipitation elsewhere. The one-month September outlook indicates weakly elevated odds of drier than normal conditions in northern Illinois, but equal odds of above and below normal precipitation elsewhere.

Cooler weather in September will help to temper ongoing drought in northern and central Illinois. However, September is one of the drier months in Illinois, and given the outlooks, it is unlikely that dry conditions will be completely alleviated.