As the western U.S. fights record drought conditions, northern Illinois has endured a significant dry spell of its own. Here is an update of current conditions and a look ahead into this summer.
U.S. Drought Monitor
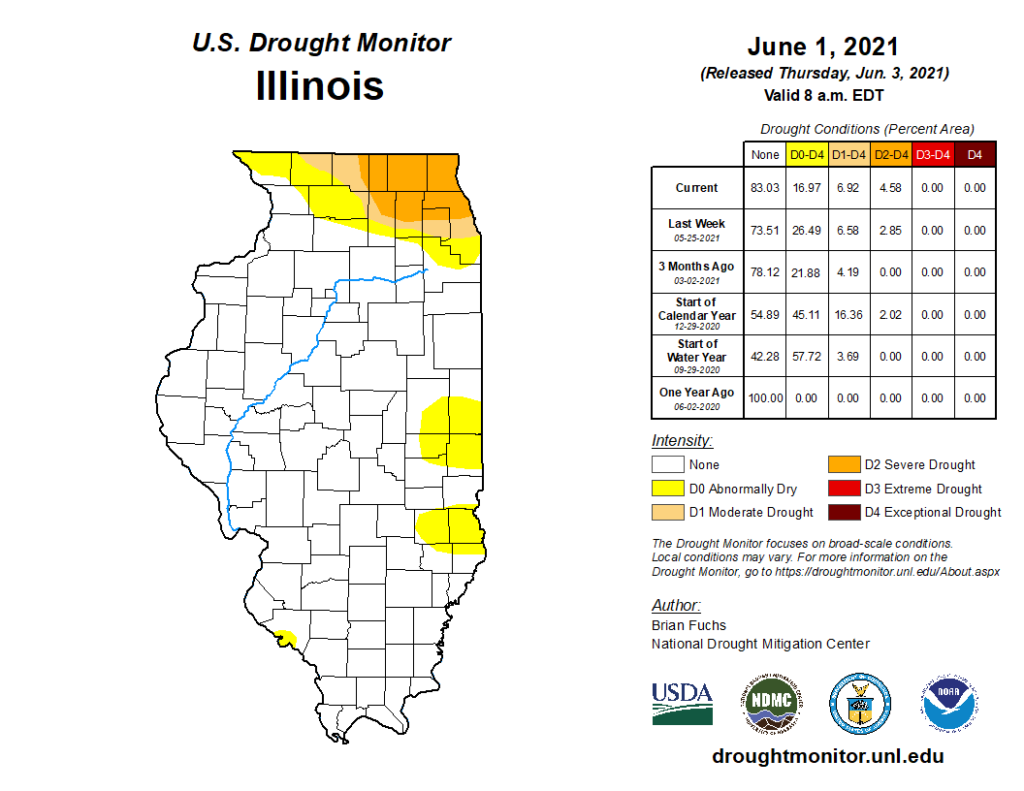
The latest version of the National Drought Mitigation Center’s U.S. Drought Monitor, which was current as of June 1st, showed an expansion of both moderate drought (D1) and severe drought (D2) across northern Illinois. Currently, nearly 6% of the state is in at least moderate drought and over 4% of the state is suffering from severe drought, according to the U.S. Drought Monitor.
Precipitation Deficits
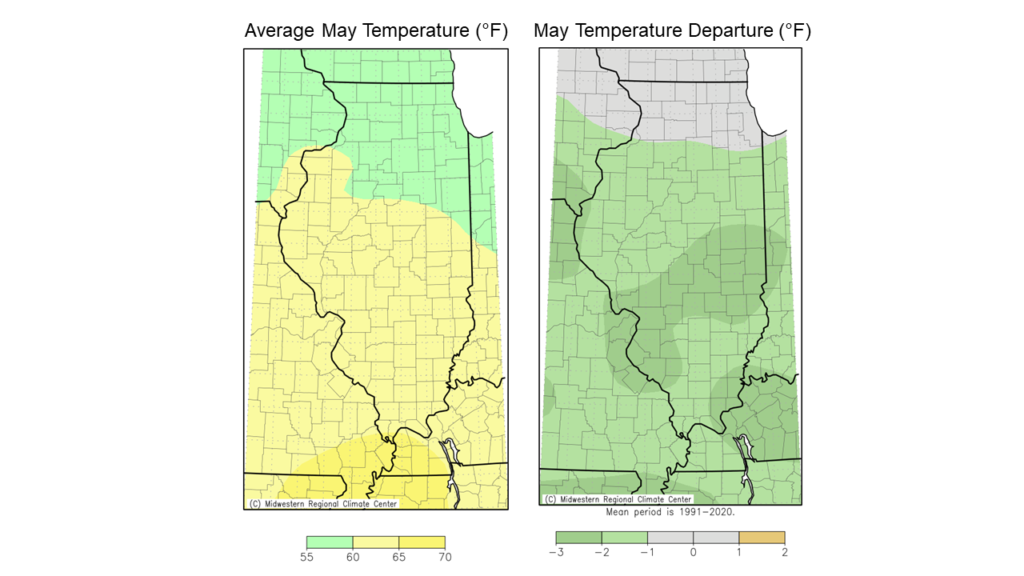
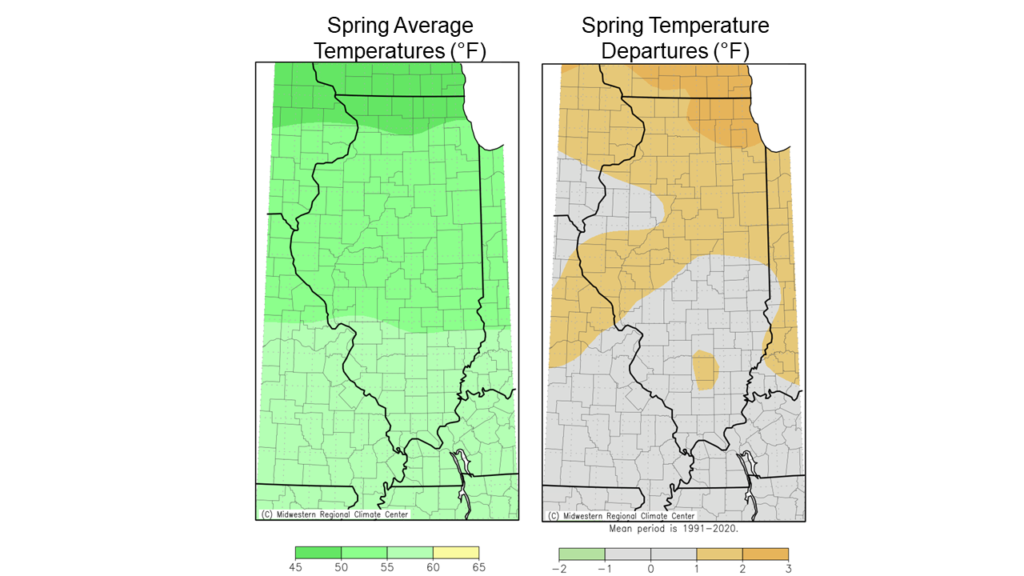
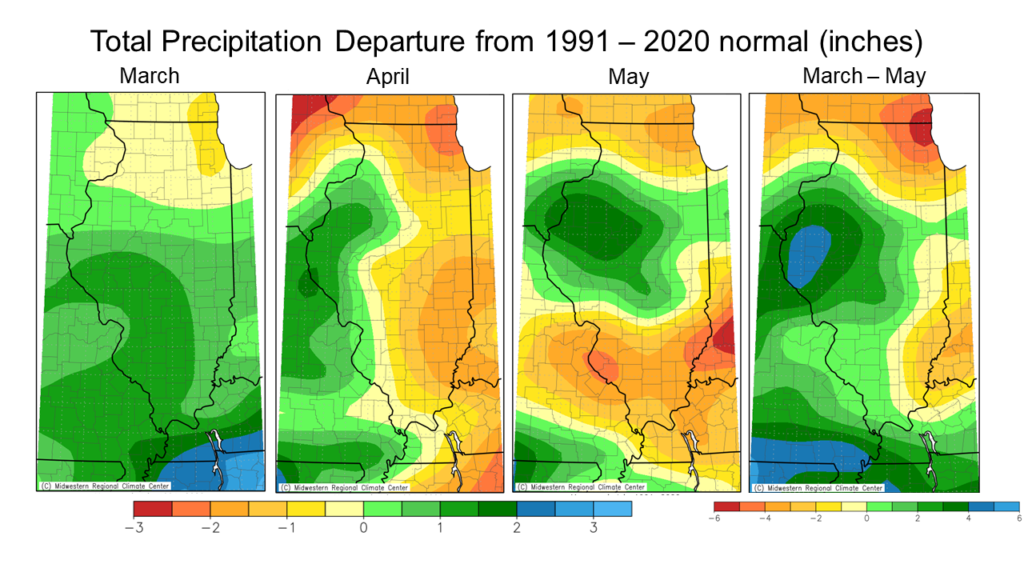
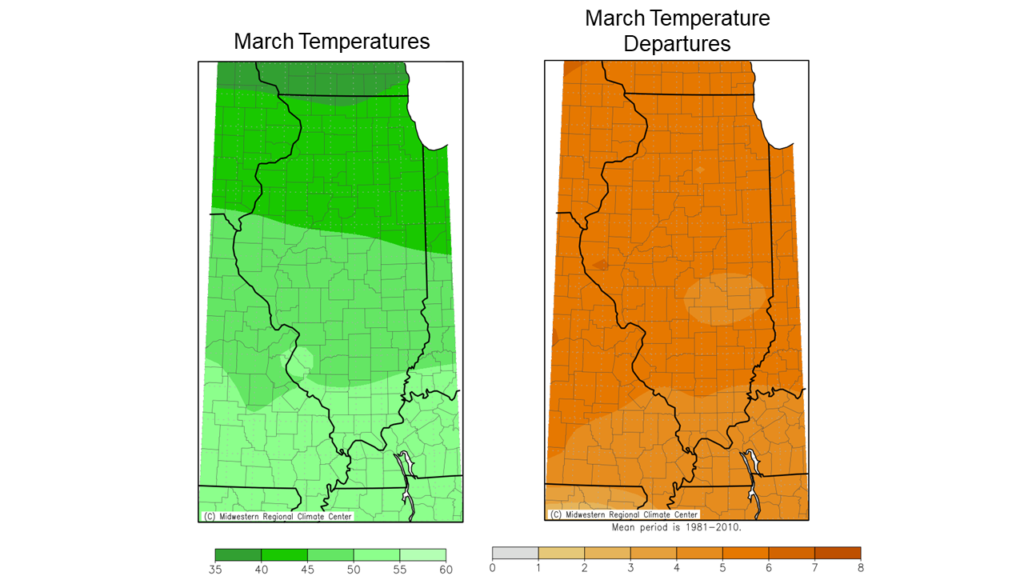
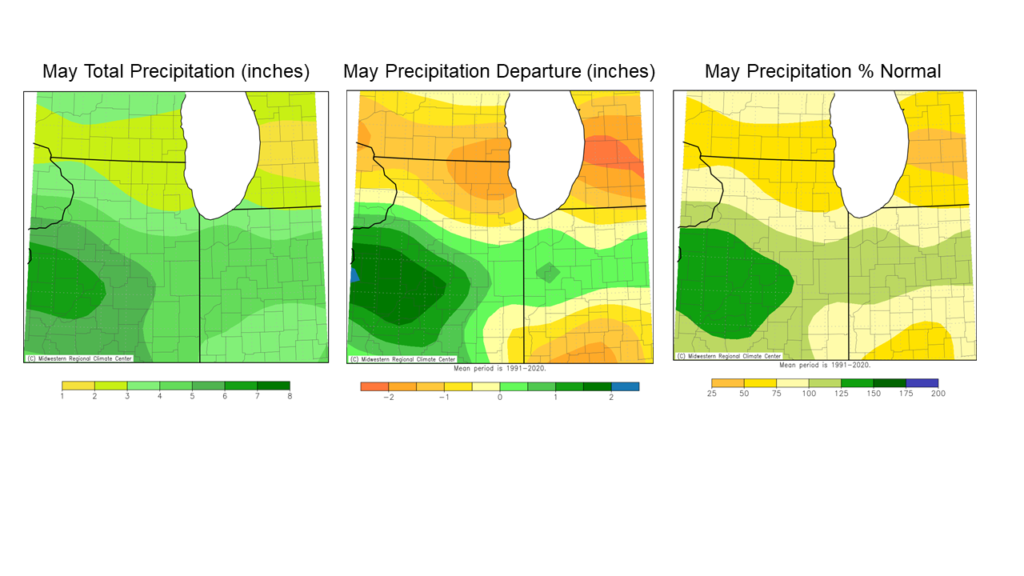
May was unusually dry across much of northern Illinois, with the largest deficits of 2 to 3 inches below the 1991 to 2020 average in northeast Illinois. May followed very dry months in March and April, and climatological spring precipitation ranged from 25% to 60% of the 1991 to 2020 average in northeast Illinois.
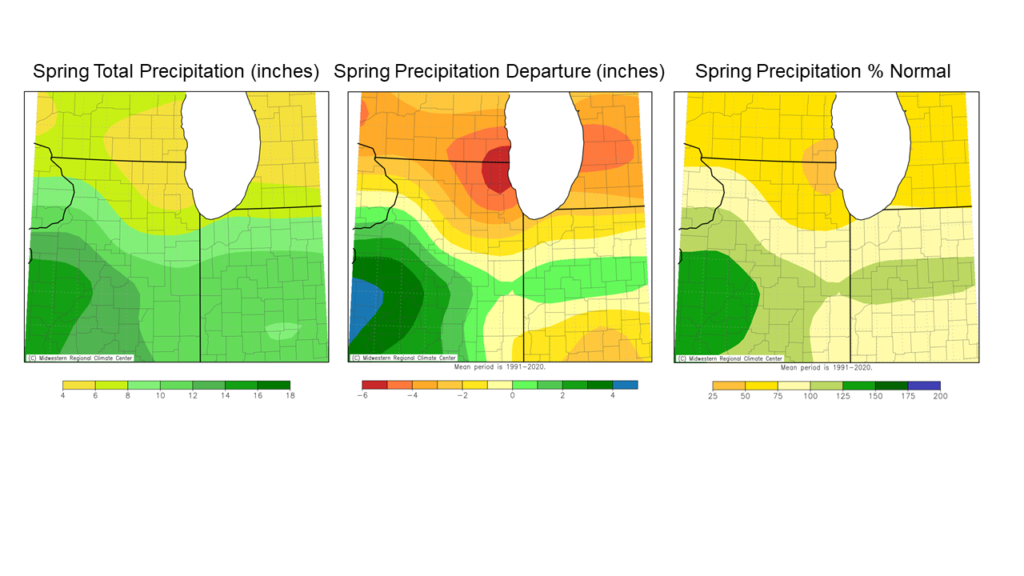
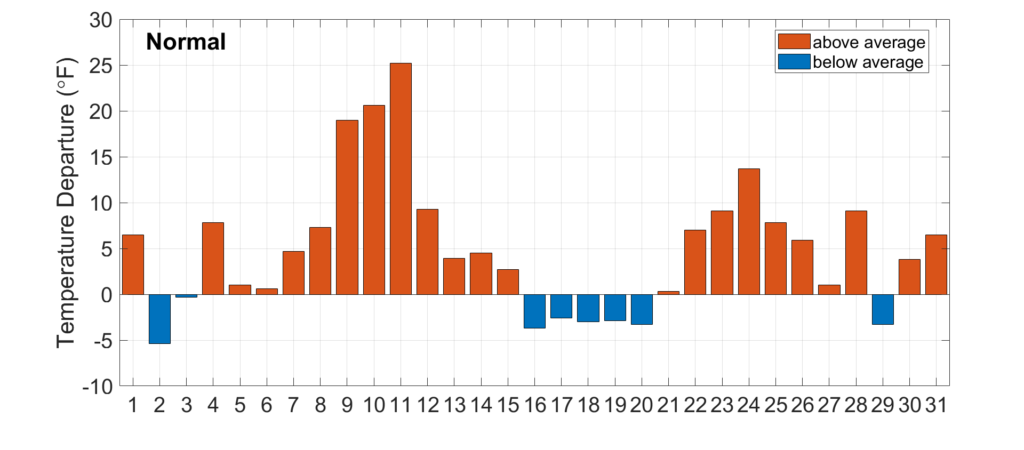
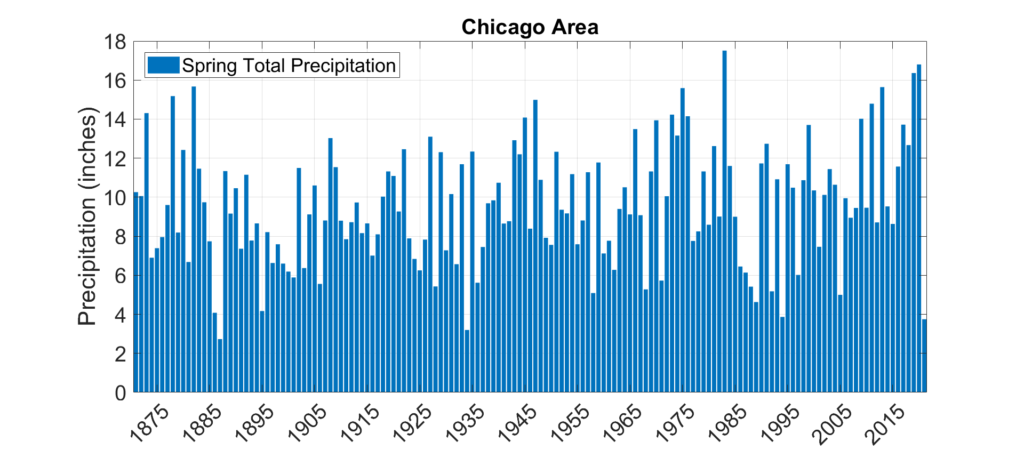
This spring ended as the third driest on record in Chicago (back to 1871) and the driest since 1934 with only 3.75 inches of total precipitation between March and May (Figure 3). For reference, the long-term average spring precipitation total in Chicago is 9.36 inches. Incredibly, this extremely dry spring followed the very wet springs of 2019 and 2020, which were the 2nd and 3rd wettest on record in Chicago.
Soil Moisture Conditions
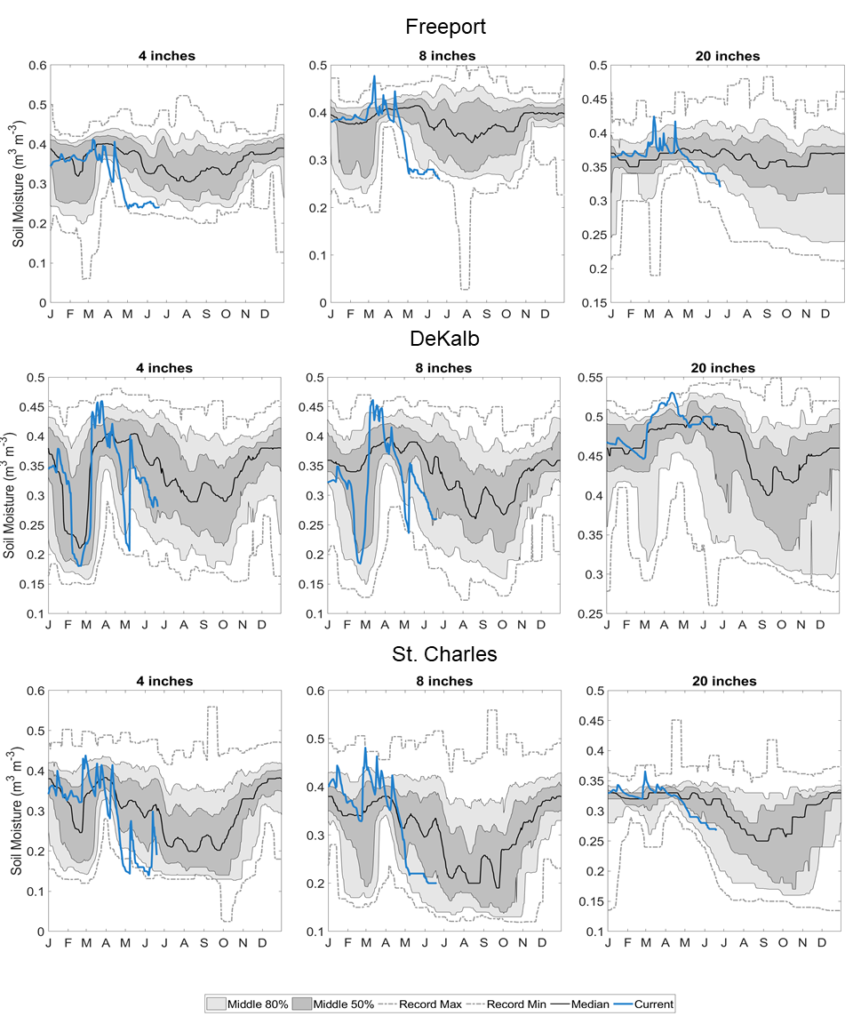
Soil moisture is depleted across northern Illinois in response to the lack of spring precipitation. The plots below show current soil moisture conditions at Illinois Climate Network stations in Freeport (Stephenson County), DeKalb (DeKalb County), and St. Charles (Kane County). Current soil moisture is shown in the blue line and depicted in volumetric water content units (m3/m3). In the background of each of these plots is the soil moisture climatology at each of these stations to better understand the climatological context of current soil moisture. Soil moisture at 4 inch and 8 inch depths are near or below the climatological 10th percentile at all three locations. Soil moisture at 4 inch depth at both Freeport and St. Charles is approaching a value of 0.20 or approximately 20% moisture by volume, which is close to the permanent wilting point of these soils. Once soils dry to or beyond the permanent wilting point, plants are unable to effectively extract water out of the soil, and we typically see impacts to crops and natural ecosystems as soil moisture approaches the wilting point. Importantly, deeper layer soil moisture at 20 inch depth is still abundant at both Freeport and DeKalb. This deeper layer moisture tends to be less affected by short-term drought and is more reflective of climate conditions at 6 to 18 month periods. The abundant deeper layer moisture at Freeport and DeKalb can help alleviate significant moisture stress for established trees and shrubs; however, the relatively more severe drought conditions in northeast Illinois has left 20 inch soil moisture more depleted at St. Charles.
A Look Ahead
Unfortunately, the near-term forecasted weather is not conducive for alleviation of drought conditions in northern Illinois this upcoming week. Temperatures are forecasted to reach into the high 80s and low 90s across northern Illinois this weekend and throughout next week. High temperatures will increase evaporative demand and evaporation from already moisture-stress soil and plants, exacerbating ongoing drought impacts to agriculture and ecosystems.
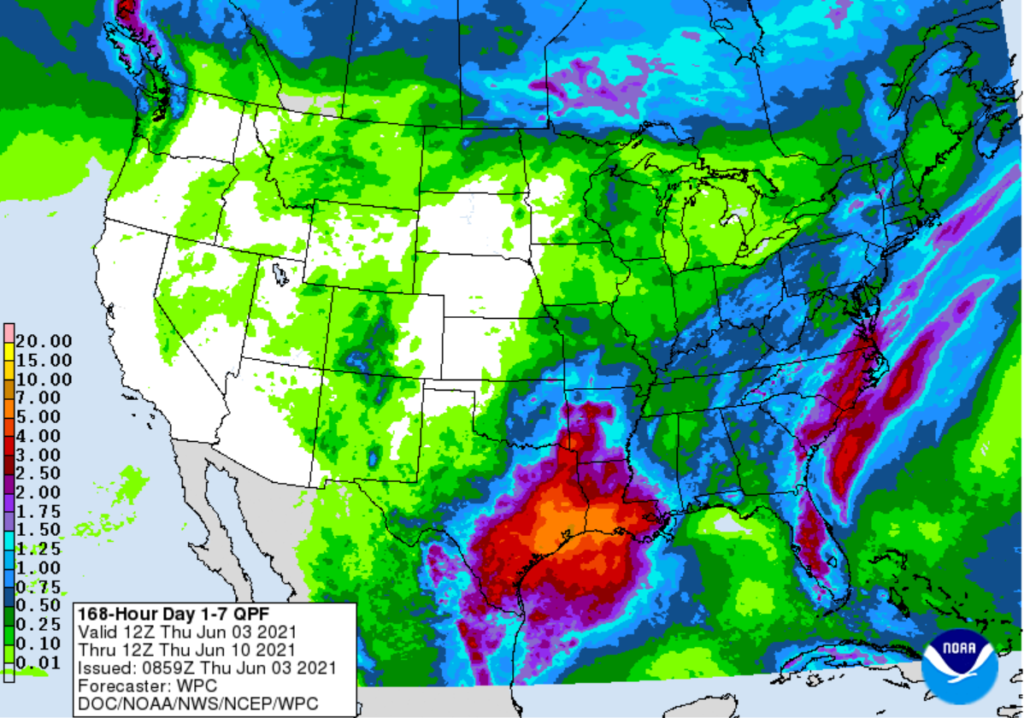
Meanwhile, National Weather Service precipitation forecasts (below) call for mostly less than half an inch of rain over the next 7-days across northern Illinois. The combination of very high temperatures and evaporation with little to no rain will likely degrade dry conditions and heighten drought impacts across northern Illinois this upcoming week.
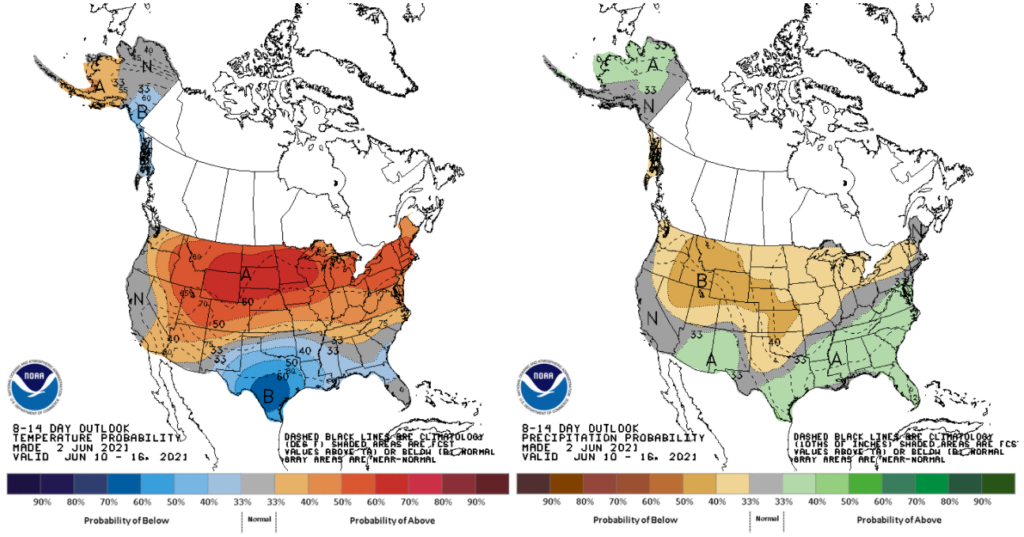
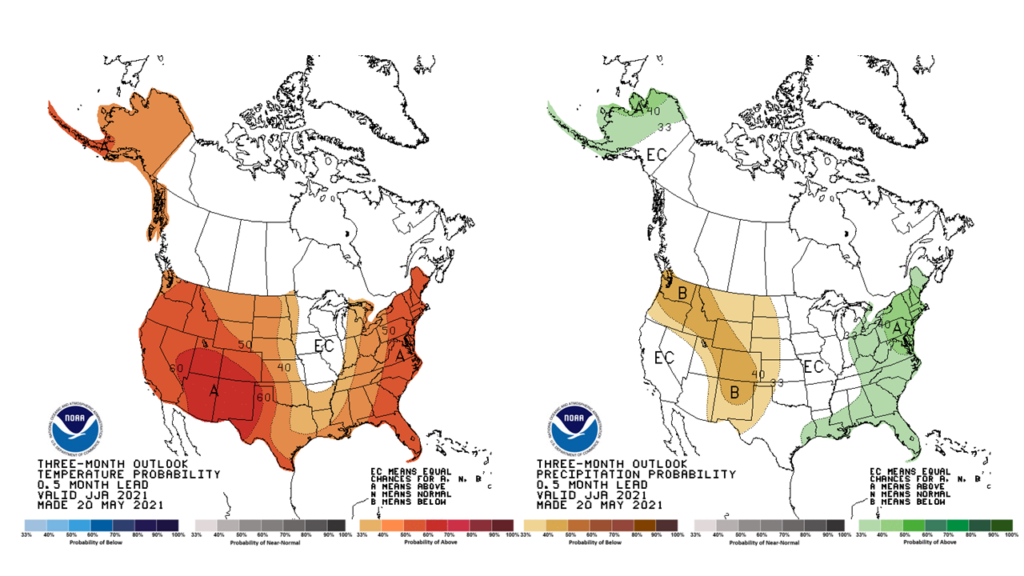
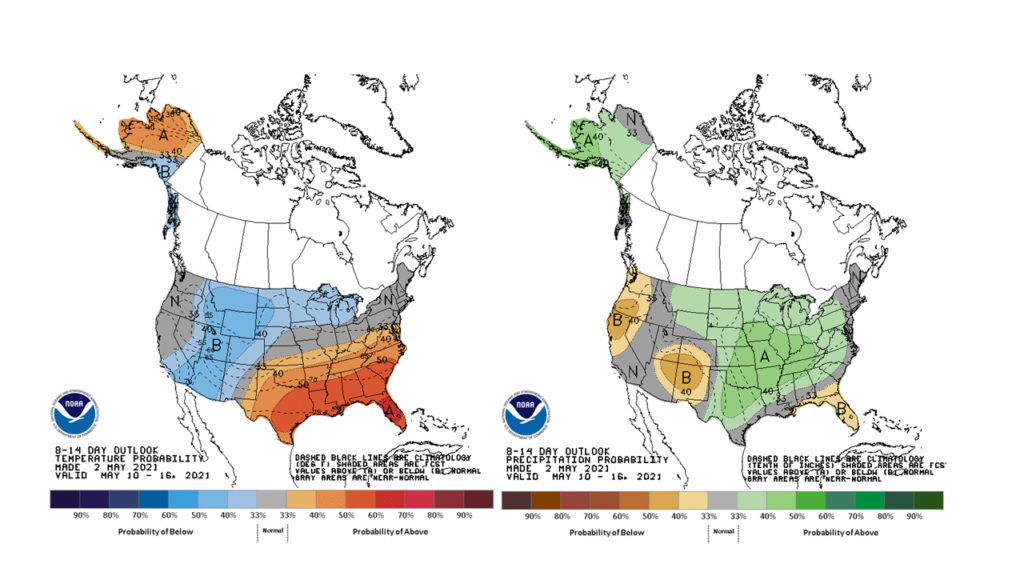
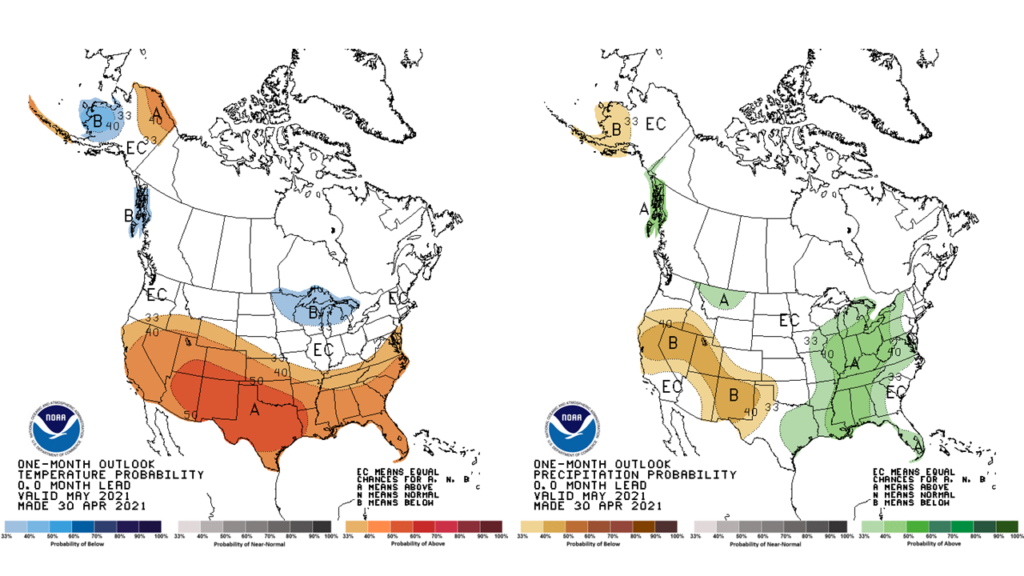
Outlooks from the Climate Prediction Center for week 2, the period June 10th through June 16th, are also showing highest probabilities of warmer and drier than normal conditions across the state. Given the current conditions and predictions for the next two weeks, it is very unlikely drought will be alleviated in northern Illinois in the first half of June.