Stormy, wet, and chilly February for Illinois

February 2019 will be a month remembered for an unseasonably active storm pattern, a majority of the month was characterized by a seemingly constant succession of storms resulting in moderate snow accumulations for the northern counties, and persistent rain events and widespread flooding for the far southern counties.  Between storm systems we experienced noticeable temperature swings, and periods of seasonable weather.

Statewide, February ended colder and substantially wetter than the long term average.  The preliminary average statewide February temperature was 28.6°F, which is 2.3°F below the long term average.  The preliminary average statewide precipitation was 3.33 inches, which is 1.27 inches above the long term average.

Data are provisional and may change slightly over time.

Temperature

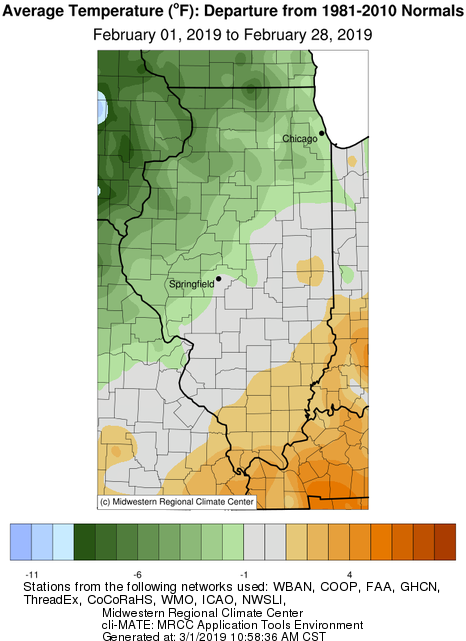
Preliminary results show that February 2019 finished with a statewide average temperature of 28.6°F which is 2.3°F below the long term average.

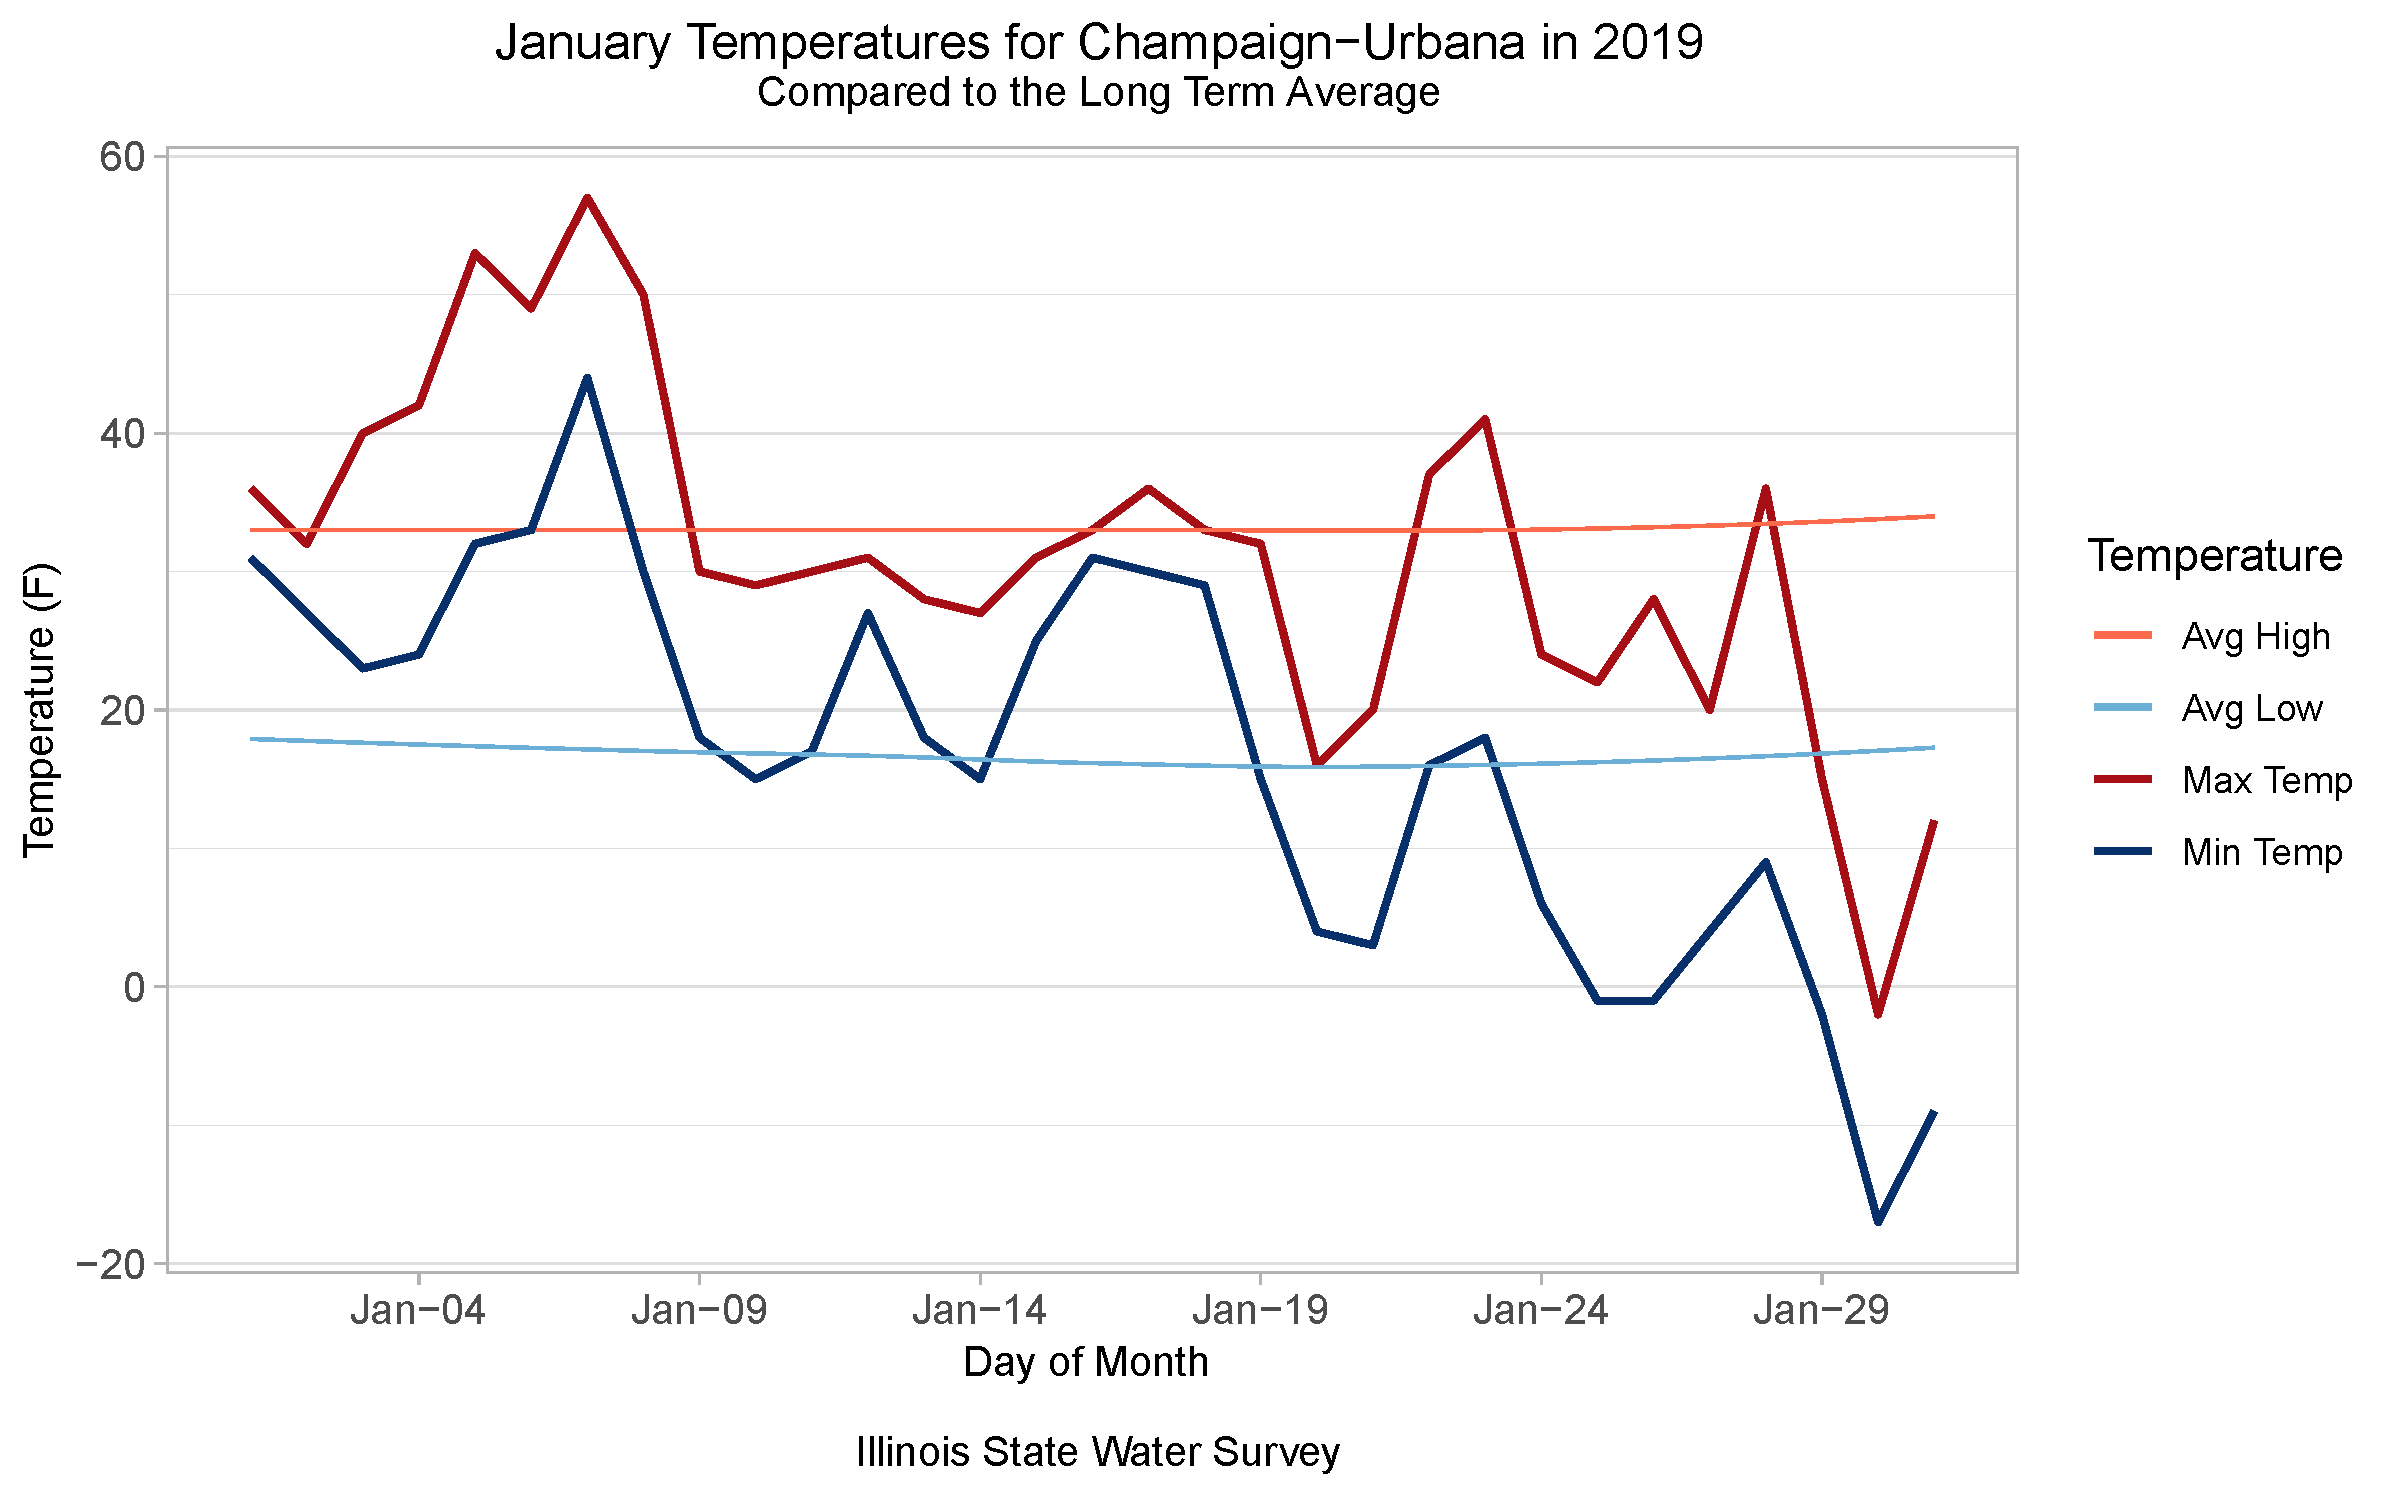
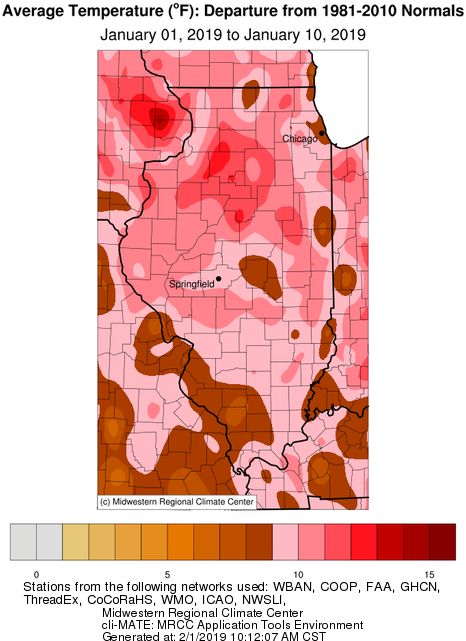
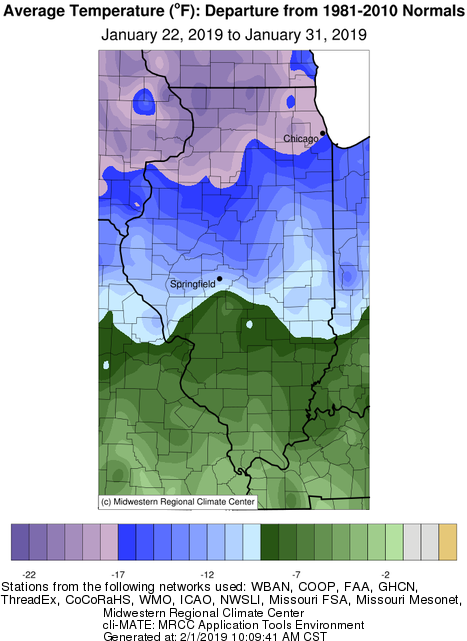
The maximum February temperature of 70°F was reported at two stations, Dixon Springs (Pope County) on February 3rd, and Kaskaskia River Lock (Randolph County) on February 4th.  These temperatures came less than a week after the historic Arctic outbreak in late January, which shattered numerous all time station and daily record lows across Illinois.  Over the course of five days many stations across the state saw temperature differences of around 70 degrees or more from Jan. 31 to Feb. 4.

The minimum state temperature was -36°F reported at the Mt. Carroll observation station (Carroll County) on February 1st, a day after the station recorded a potential record state minimum temperature of -38°F on last day of January 2019.

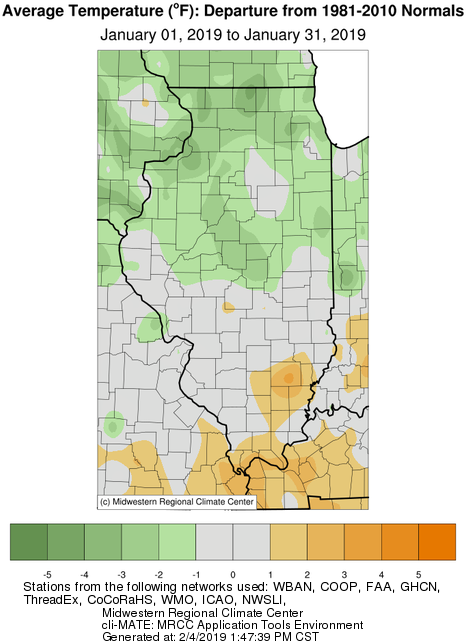
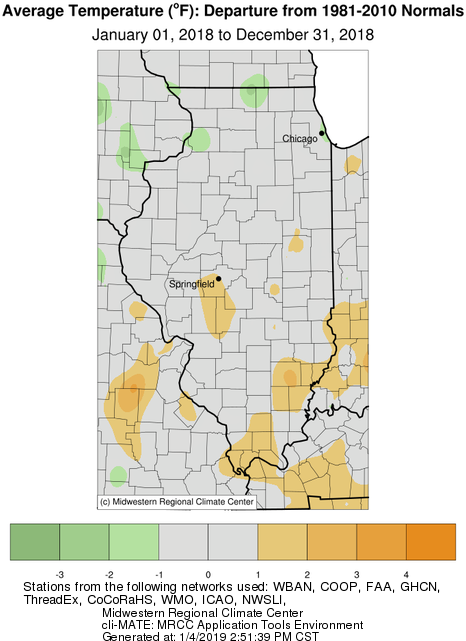
The map below depicts average monthly statewide temperature departures for Illinois.  In February, the departure gradients tended to align in a southwest to northeast fashion, following the larger scale storm tracks.   Overall, Southeastern Illinois saw temperature departures averaging one to three degrees above normal, while much of Central Illinois was near the long term average, and a larger region in the vicinity of Northwest Illinois saw temperature departures averaging two to five degrees below normal.

Precipitation

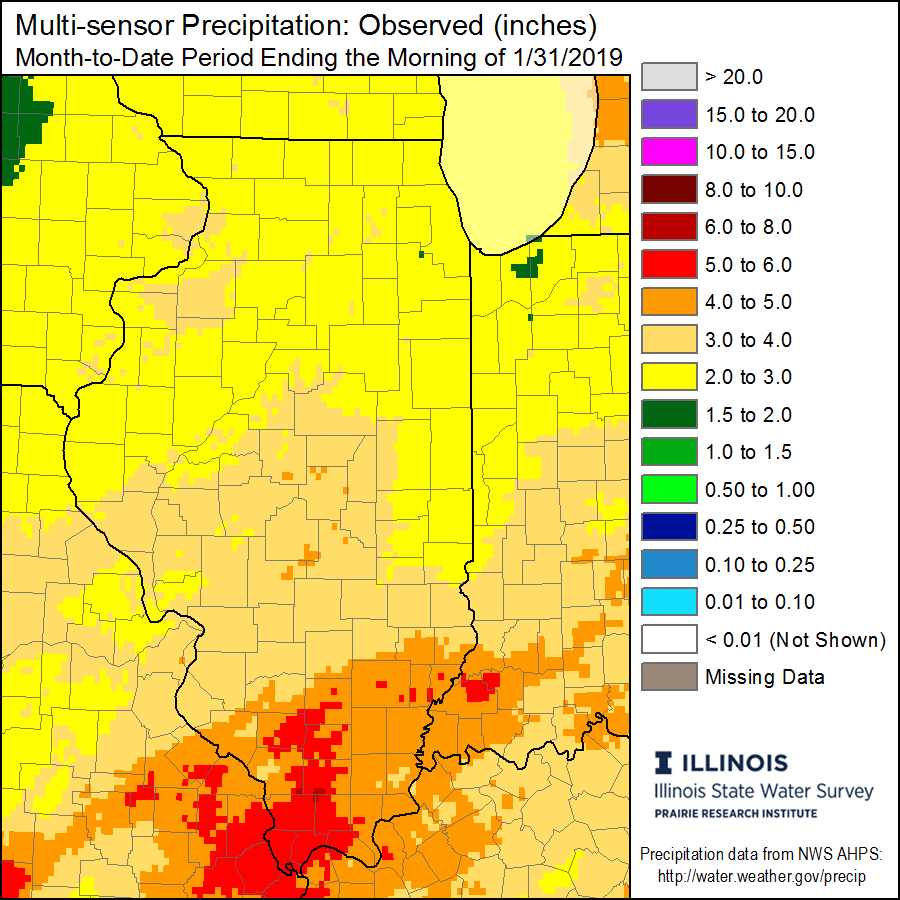
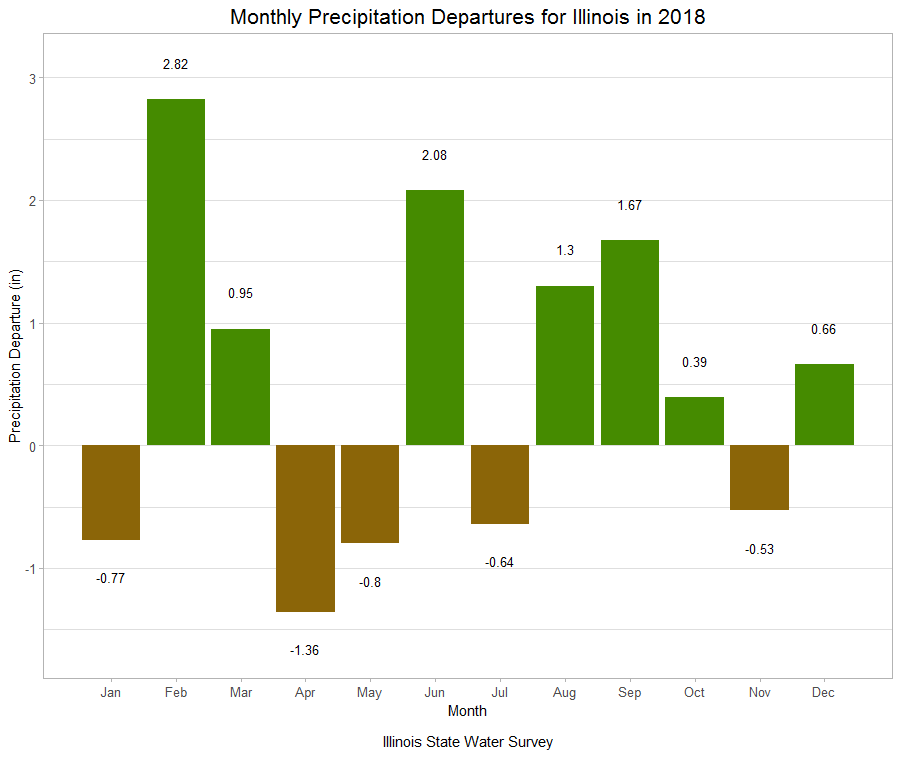
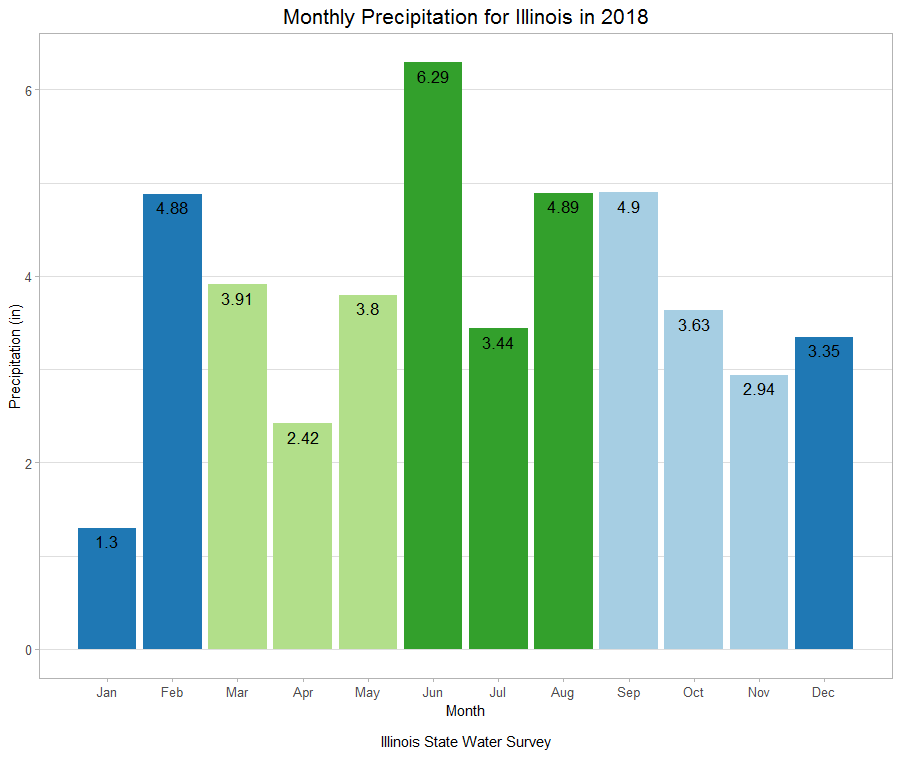
Preliminary statewide average precipitation for February was 3.33 inches, which is 1.27 inches above the long term average.

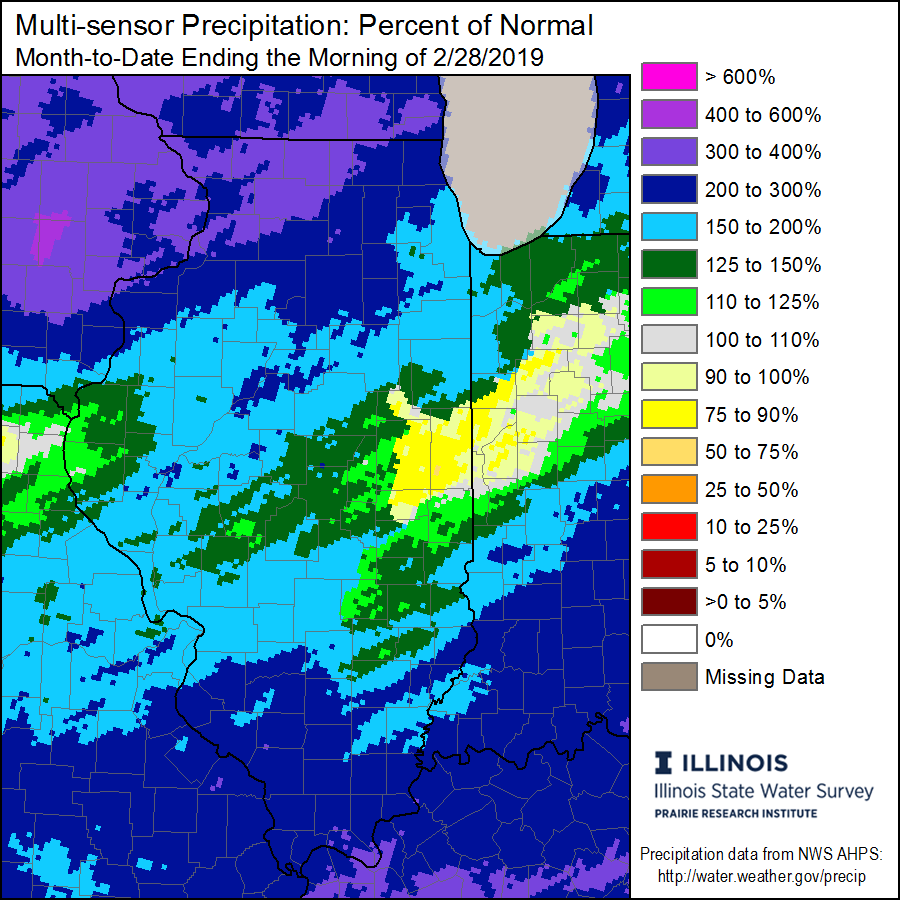
Total precipitation was one of the biggest weather concerns for February.  While locations in the center of the state, roughly between I-80 and I-70, received anywhere from 1.5-4.0 inches of precipitation for February, the most impressive totals fell in far Northwestern and Southern Illinois (see map below). In Southern Illinois February totals in excess of 6.0 inches were common, with five stations reporting over 8.0 inches of precipitation for the month.

The highest monthly total was reported at Smithland Lock and Dam (Pope County) with an impressive 10.68 inches.  This ranks as the wettest February on record for the station, with records going back to 1981.

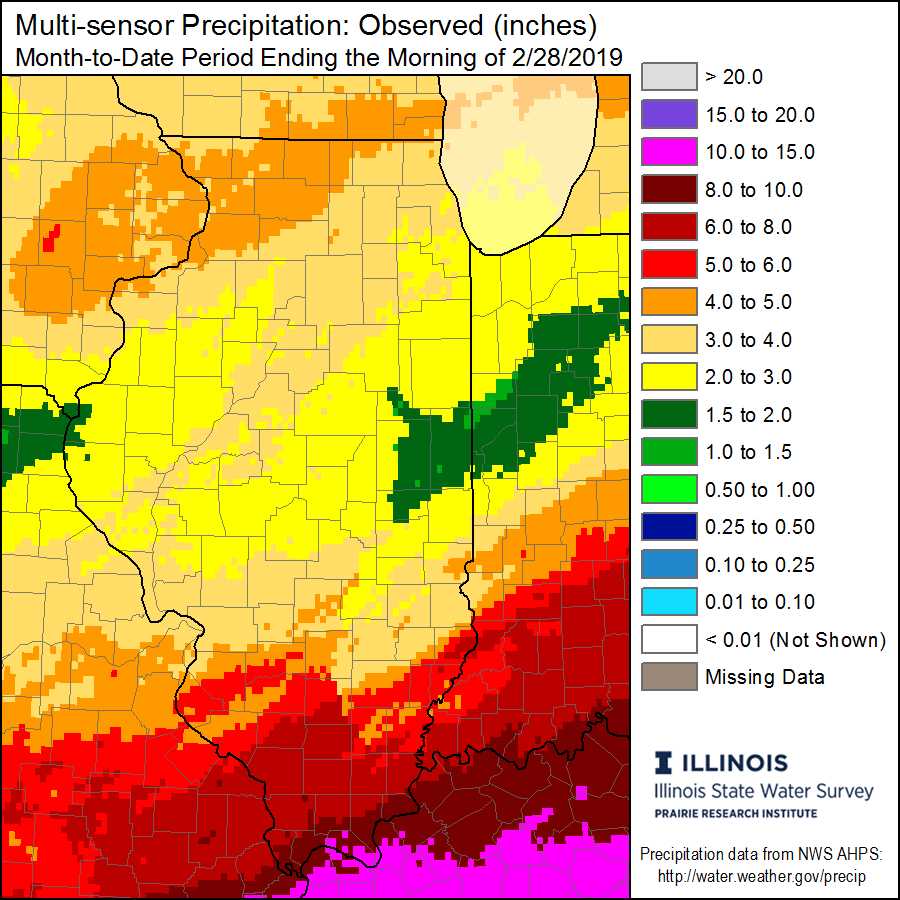
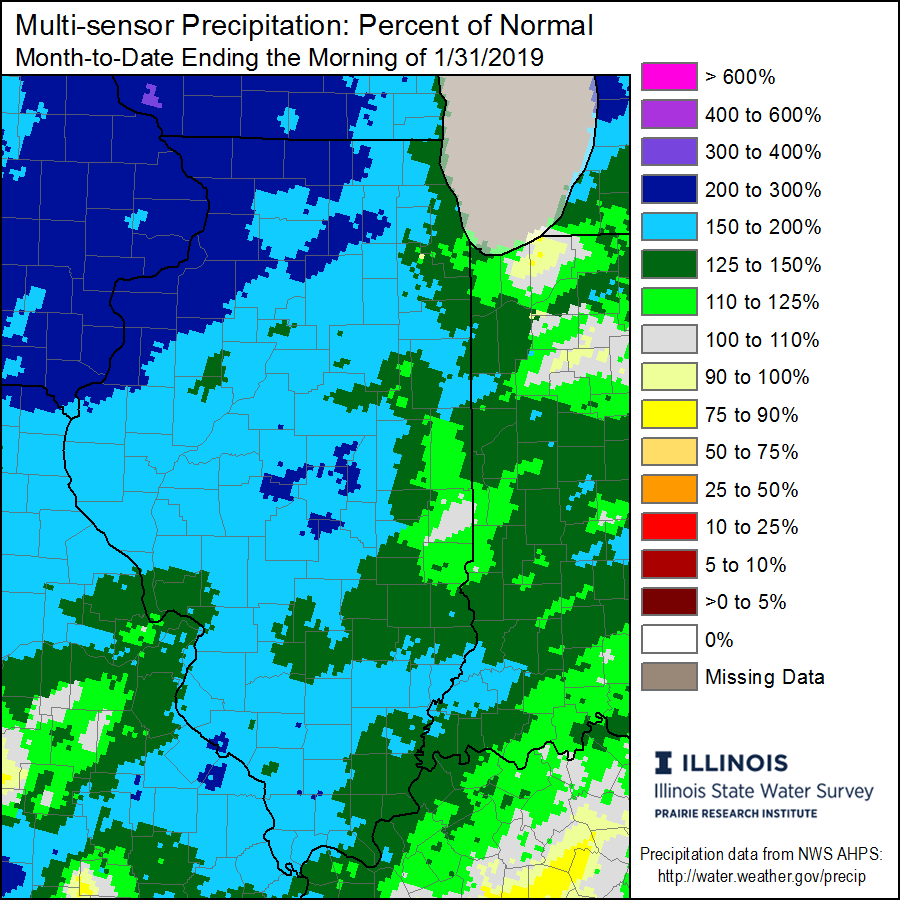
The persistent February precipitation corresponded to monthly totals of 300-400% percent of normal for Northwestern Illinois, and 200-300+% of normal for Southern Illinois (see map below).

Once final numbers are calculated, Feb. 2019 is on track to rank within the top 15 wettest statewide February’s on record.  Abundant regional February rainfall also contributed to a major flooding event in the lower Ohio River.  Both the Smithland Lock and Dam and Cairo river gauges crested at over 10 feet above flood stage during the last week in February. Maximum river stages are expected to be within the top 5 highest on record, according to data compiled by the National Weather Service.

Soil moisture percentiles for the month of February remained in the  90th percentile or higher across Illinois.

Snowfall

Snowfall occurred statewide during February, but was most plentiful in counties along the Illinois/Wisconsin border, where 10+ inches of accumulation were common (see map below)

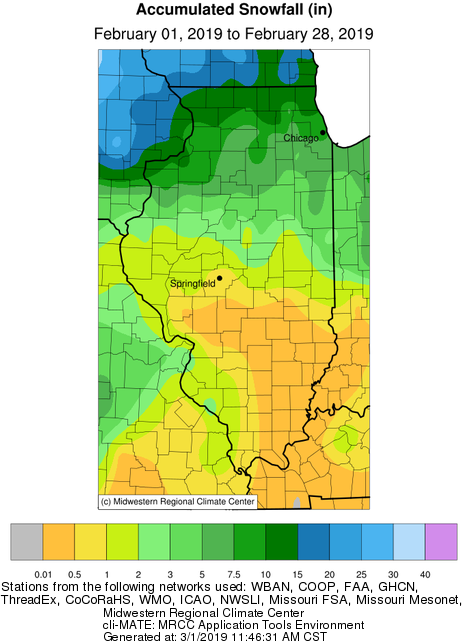
The highest point snowfall total of 25.7 inches was reported at a station in Galena (Jo Daviess County).

Outlook for March 2019

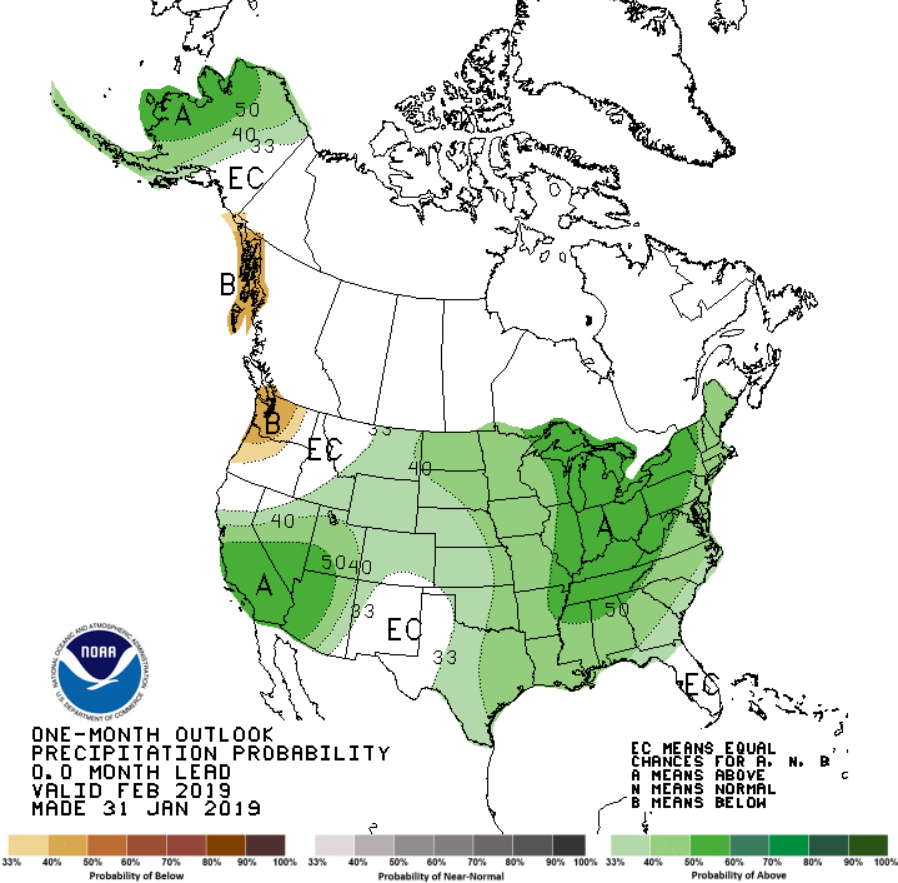
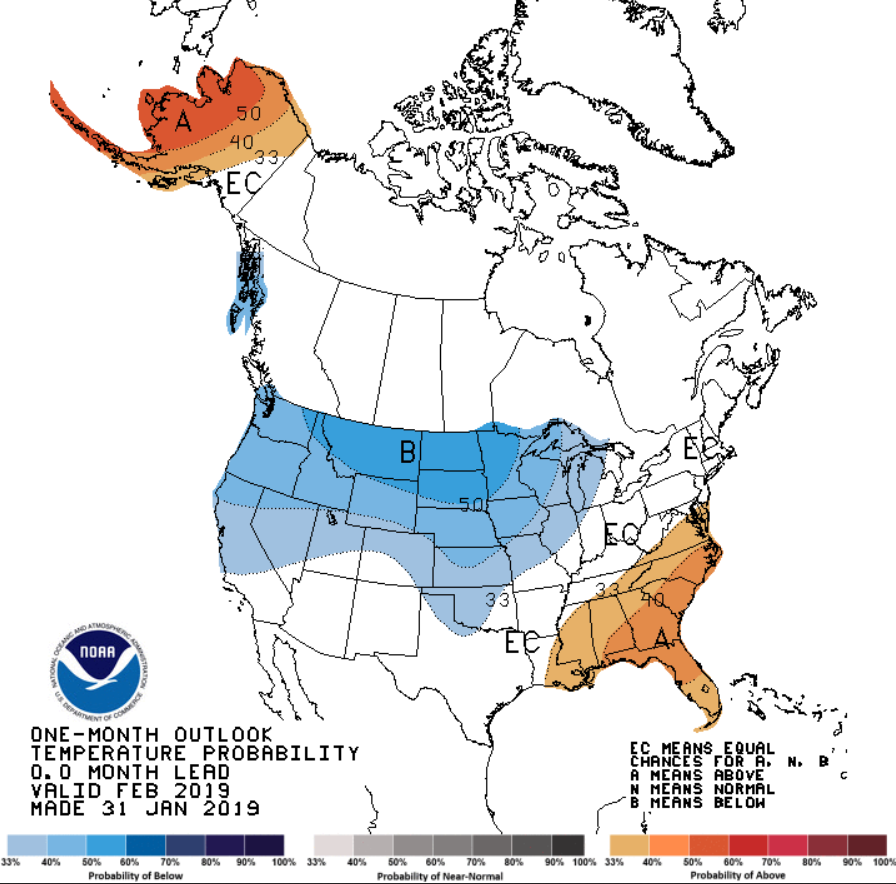
Looking ahead at the rest of March 2019, the Climate Prediction Center is favoring moderate probabilities of colder than average temperatures statewide.  The highest probabilities are located in the northwestern portion of the state.  Slightly increased probabilities of a wetter than normal March are forecast for extreme southern Illinois, the same regions that have already experienced unseasonably wet conditions for a majority of the winter.

Check back soon for a recap of the 2018-2019 meteorological winter season.

Previous records slashed with monumental cold conditions in Illinois

CHAMPAIGN, Ill., 1/31/19: Illinois has been experiencing some of the coldest weather that has been seen in decades and, in some locations, ever.

The National Oceanic and Atmospheric Administration cooperative weather observer at Mt. Carroll in northeastern Illinois reported a temperature of -38 degrees on the morning of Jan. 31.

“The temperature in Mt. Carroll may be a new state record, if officially confirmed,” said Brian Kerschner, spokesperson for the Illinois State Climatologist’s Office at the Illinois State Water Survey.

When it appears that a state record temperature may have been broken, a state climate extremes committee reviews the observations to assess its validity. This team typically includes the State Climatologist’s Office, the Midwestern Regional Climate Center, and federal climate experts, such as from the National Weather Service and the National Center for Environmental Information.

Most of Illinois has been in the deep freeze for the past two days. With a recording of -31 degrees, Rockford broke their all-time low temperature, which was previously -27 degrees on Jan. 10, 1982, the National Weather Service Forecast Office in Chicago reports.

During the mornings of Jan. 30 and 31, numerous locations in northern Illinois reported temperatures in the -20s and some locations going below -30 degrees. Minimum temperatures were below 0 degrees throughout most of the state, except for the southern regions. Daily mean temperatures were generally 15 to 20 degrees lower than the 30-year average temperature.

Some other notable temperatures included -35 degrees at Elizabeth, -32 at Galena, -30 at Rochelle, -33 at Aledo, -26 at DeKalb, -22 at Joliet, -21 at Galesburg, -17 in Champaign, and -16 in Decatur.

In the southern counties, Cairo reached 12 degrees and Carbondale and Rosiclare saw 4 degrees.

Numerous schools, businesses, and government offices were closed throughout the state because of the dangerously cold wind chills.

——-

Note: Data for this press release were obtained from the Office of the Illinois State Climatologist, Midwestern Regional Climate Center, and National Weather Service Offices responsible for the state.

Media Contacts: Brian Kerschner, (217) 333-0729, statecli@isws.illinois.edu

David Kristovich, head of the Climate and Atmospheric Science Section, Illinois State Water Survey, (217) 333-7399, dkristo@illinois.edu

A warm start to January, followed by an abundance of snow and record breaking cold!

January 2019 will be a month remembered by an unseasonably warm start, followed by several cold air outbreaks and a torrent of winter storms that finally made it feel like January in the Midwest. The last two days of the month brought a monumental Arctic air outbreak that shattered many record cold temperatures across the state.

January ended cooler, and substantially wetter than the long term average.  The preliminary average statewide January temperature was 24.7°F, which is -1.7°F below the long term average.  The preliminary average statewide precipitation was 3.51 inches, which is 1.44 inches above the long term average.

Data are provisional and may change slightly over time

Temperature

State Record Cold Temperature in Jeopardy:

A National Oceanic and Atmospheric Administration (NOAA) cooperative (COOP) weather observer at Mt. Carroll (Carroll County) reported a temperature of -38°F  on the morning of January 31st.  This unofficial temperature is currently under review by the State Extremes Committee, and if confirmed with be a new state record.  The current record is -36°F recorded in Congerville (Woodford County) on January 5, 1999.

In addition, multiple all time station record lows were set in Illinois on the morning of January 31st.  Some notable records include, Moline (Rock Island County) with a reading of -33°F , and Rockford (Winnebago County) with a reading of -31°F, as reported by the National Weather Service.

Preliminary results show that January 2019 finished with a statewide average temperature of 24.7°F which is -1.7°F degrees below the long term average.

January temperatures were a roller coaster over the course of the month, as depicted in the plot below, showing high and low temperatures and averages for Champaign-Urbana throughout the month.  Champaign-Urbana was chosen since the State Climate Office is located here, but this trend can be representative of the state as a whole.

Trends in temperatures across the entire state are depicted in the maps below.. The first 10 days of January saw statewide average temperature departures of around +9 to +14 degrees.  On the reverse end, looking at the last 10 days of the month, we experienced average temperature departures of around -5 to -21 degrees in a south to north pattern across the state.  The most extreme departures were in Northwest Illinois.

Temperatures for the month as a whole were closer to the long term average (see map below).  Regions near, and south of I-70 generally reported departures of one to three degrees above the long term average.  However, many locations in Northern Illinois reported departures of one to three degrees below the long term average, while the central portion of the state was near to slightly below average.

  • The highest temperature recorded for the month, was 66°F which occurred at two separate stations, Grand Chain Dam (Pulaski County) on January 2nd, 2019, and Jerseyville (Jersey County) on January 8th, 2019.
  • The lowest temperature recorded for the month was -38°F* at Mount Carroll (Carroll County) on January 31st, 2019 – *this recording is currently under review by the State Extremes Committee.

Precipitation

Preliminary statewide average precipitation for January was 3.51 inches, which is 1.44 inches above the long term average.

An active weather pattern beginning in the middle of the month allowed several large weather systems, and numerous smaller clipper type systems to traverse the state.  These storms were accompanied by heavy rains, accumulating snowfall, and sometimes icy precipitation.  The heaviest precipitation fell in the south/southwestern portion of the state where 5 to 6+ inches were measured (see first map below).  Many regions in Central and Northern Illinois received well over 100% of their average January precipitation, with Northwest Illinois receiving 200 to 300% (see second map below).

  • The highest monthly rainfall total of 6.50 inches occurred at a station near Cobden (Union County), 1.50 inches of which fell in a single day on January 5th, 2019.

Snowfall

Snow was abundant across the state in January, with all of Illinois recording at least some accumulating snowfall.  The highest snowfall totals of 15 to over 20+ inches were common in West-central and Northwest Illinois (see map below).

These same regions generally recorded accumulations on the order of 10 to 15+ inches above the long term average.

  • The highest monthly snowfall total was from Moline (Rock Island County) where 30.2 inches were reported, which is 20.8 inches above the long term average, ranking this as the snowiest January on record for the station.
  • Rockford (Winnebago County) received 24.9 inches, which is 14.7 inches above the long term average for January.
  • Chicago O’Hare reported a trace or more of snowfall for 15 consecutive days, from January 17th through January 31st.

Ice cover on Lake Michigan increased to nearly 35% by the end of the month, according to data from the Great Lakes Environmental Research Laboratory (chart below).

MODIS Imagery of Lake Michigan Ice Cover (Feb 1 2019)

Outlook for February 2019

Looking ahead at the rest of February 2019, the Climate Prediction Center is forecasting an above normal chance for a wetter than average February statewide. The highest probabilities are located toward the eastern side of Illinois.  Below average temperatures are favored for much of Central and Northern Illinois, with no strong signal further south.


2018 Illinois Climate Recap

 A Climatologic Review: 2018

Now that 2019 is well underway, lets take a moment to reflect back on the climate averages and departures from 2018.

Note:  Data are provisional and may change slightly over time

Temperatures

2018 was a year marked with several climatologically dramatic temperature swings.  The chart below shows monthly temperature departures from the 1980 – 2010 long term average for Illinois.  The most noteworthy feature is the -7.8°F departure that occurred in April, ranking April 2018 as the second coldest April on record for the state (records extend back to 1895).  And with the turn of a calendar page, May saw a +8.0°F departure from the long term mean, ranking May 2018 as the warmest May in state history.

The plot below shows the average statewide temperature (F) by month for 2018, the colors represent meteorological seasons.

The map below shows spatially average temperature departures for the year 2018.   Despite several dramatic temperature swings throughout the seasons, the year as whole finished right around the long term mean statewide.  A few regions in the northwest were a degree below, and a few regions in the south/southeast were a degree above the long term mean.

The statewide average temperature for 2018 was 52.5°F which is 0.2°F  above the long term average.

  • The highest temperature recorded in the state: MORRIS 1 NW in Grundy County with 100°F on May 28th, 2018
  • The lowest temperature recorded in the state:  MORRISON in Whiteside County with -24°F on January 1st, 2018
  • The warmest mean temperature: LAWRENCEVILLE 2WSW in Lawrence County with 59.3°F
  • The coldest mean temperature: PALESTINE in Crawford County with 43.1°F

Precipitation

The chart below shows monthly precipitation departures from the 1980 – 2010 long term average for Illinois in inches.  February saw the wettest departure from average at 2.82 inches.  April saw the driest departure from average at -1.36 inches,

The plot below shows the average statewide precipitation (in) by month for 2018, the colors represent meteorological seasons.

The map below shows precipitation as a percent of normal for the year 2018 in inches.  It was a rather wet year statewide, the highest percentages above average were reported in numerous regions across the extreme northern and southern portions of Illinois, where 125 to 150 percent of normal precipitation was measured.

The statewide estimated average precipitation for 2018 stands at 45.75 inches which is an impressive 5.79  inches above the long term average.

  • The highest yearly precipitation in the state: NASHVILLE 1E in Washington County, with 66.79 inches
  • Largest one day maximum event: CISNE 2.5 in Wayne County with 8.54 inches on September 8th, 2018
  • Snowiest location in the state: BULL VALLEY 2.5 WNW with 55.4 inches, the one day maximum snowfall for the site was 13.1 inches on November 26, 2018

Severe Weather

Severe weather reports for Illinois in 2018 from the NOAA Storm Prediction Center. Note: It is possible to generate multiple report for the same storm/event

Month Total Reports Tornado Hail Wind
January 2 0 2 0
February 1 0 0 1
March 0 0 0 0
April 20 9 4 7
May 170 6 48 116
June 184 11 15 158
July 54 0 6 48
August 40 2 7 31
September 40 2 1 37
October 3 0 0 3
November 0 0 0 0
December 52 34 11 7
Total 566 64 94 408

Illinois Climate Minute: 2018 Recap


Thanks for reading!