Late April 2019 Snow Event

4/29/2019 – A strong and considerably cold low pressure system took aim at Illinois on Saturday April 27th, bringing a large area of widespread precipitation and unseasonably cool weather to a majority of the state.  The greatest impacts were felt in Northern Illinois, where temperatures were cold enough to support a variety of wintry precipitation types. This included a late season and uncommon accumulating snow for many from Chicago and points north and west.

According to the National Weather Service, the final snowfall total at Chicago O’Hare of 2.5 inches was the latest accumulating snowfall for the city since 1989, and the latest 2+ inch single calendar day snowfall in station history. The two day period of May 1-2, 1940 saw 2.2 inches.

Typically, Chicago O’Hare can expect 1.2 inches of snow in April, with the record for the month being 11.1 inches which was set in April 1975.  To date, April 2019 has seen 7.9 inches.

The official snowfall total in Rockford of 3.7 inches was the latest accumulating snow since 1994, and ranks as the latest 2+ inch snow event on record.  Beating out April 23, 1986 with 3.8 inches, and April 23-24, 1910 with 2.5 inches.

A station in Stockton (Jo Daviess County) reported 6.0 inches of snow with this event.  See the interpolated map below of preliminary snowfall accumulation across the state. (Note: Locally higher snowfall reports were common)

Behind this system, and with the aid of fresh spring snow cover, temperatures dropped across Northern Illinois, with Rockford tying the record daily low temperature on the morning of April 28th with a reading of 28°F.

In total 26 weather stations reported temperatures below freezing on the morning of April 28th, with Stockton (Jo Daviess County) reporting the lowest weekend reading in the state with just 21°F.

March 2019: A cold start to the month, with a stormy and wet finish

March 2019 will be a month remembered for an unseasonably cold start, followed by an active and wet weather pattern which resulted in a continuation of excess soil moisture, and major flooding events on many local streams and rivers.

Statewide, March ended colder and substantially wetter than the long term average.  The preliminary average statewide March temperature was 36.6°F, which is 4.7°F below the long term average.  The preliminary average statewide precipitation was 4.16 inches, which is 1.20 inches above the long term average.

Data are provisional and may change slightly over time.

Temperature

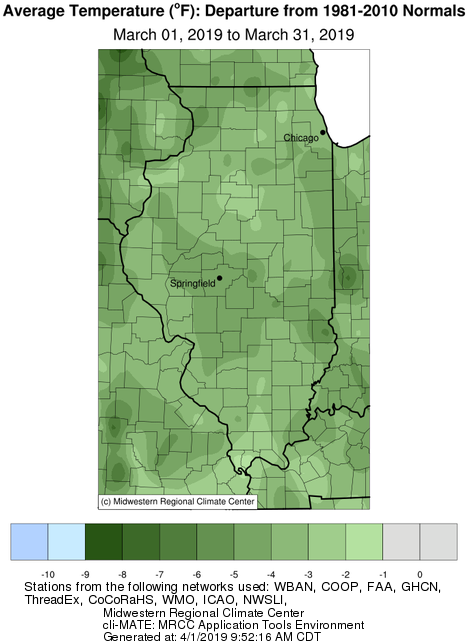
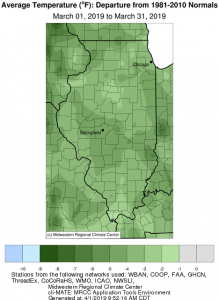
Preliminary results show that March 2019 finished with a statewide average temperature of 36.6°F which is 4.7°F below the long term average.

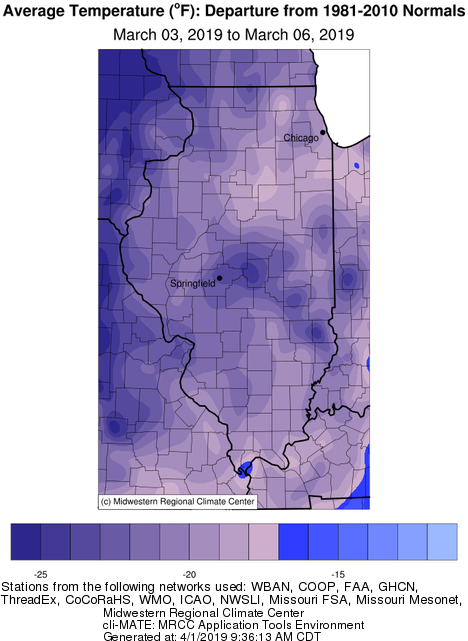
The first full week or March begun with a brutal Arctic outbreak in which temperature departures of 15° to 25°  below normal were common across Illinois (see map below).

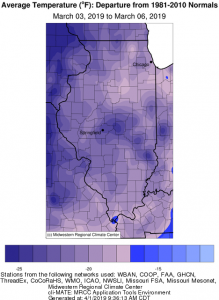
During this time three stations recorded minimum temperatures of -10° or colder.  The lowest reading in the state, -12°F, occurred at the Little Red School House station (Cook County) on March 5th.

In contrast, the warmest reading in the state was 76°F, reported at a station near Dixon Spring (Pope County) on March 13th.

The map below depicts average monthly statewide temperature departures for Illinois.  March temperature departures finished below average statewide, with the coldest departures occurring across large areas of central Illinois, and in the northwest corner of the state.

Precipitation

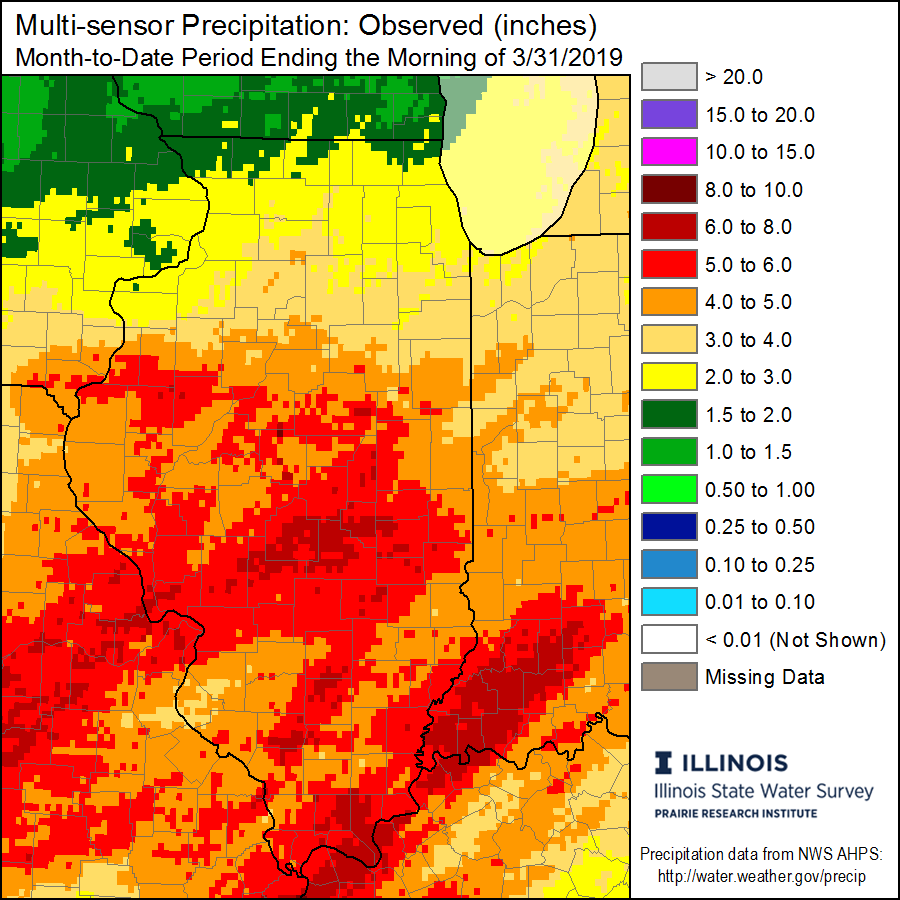
Preliminary statewide average precipitation for March was 4.16 inches, which is 1.20 inches above the long term average.

A persistent active weather pattern along with above average precipitation were the biggest weather stories in March.  Major and historic flooding on the lower Ohio River Basin in Southern Illinois continued into the first week of March, resulting from substantial February rain events.  By the middle of the month, a strong and historic low pressure system brought heavy rain, storms, and strong wind to Illinois and the rest of the Midwest.  The heavy rains and combined regional snow melt resulted in additional widespread flooding concerns across the region.  This included a major flooding event for northern and northwest Illinois, with the Rock, Fox, and Mississippi Rivers experiencing significant crests.

The heaviest March precipitation fell across central and southern portions of the state where 4 to 6 inches were common.  Five stations in these regions reported over 6 inches of precipitation for the month.  Totals were lower in Northern Illinois with generally 1.5 to 3 inches. The lowest totals for the month occurred along the Illinois/Wisconsin border.

The highest March precipitation total of 6.41 inches was reported at a station near Jerseyville (Jersey County).

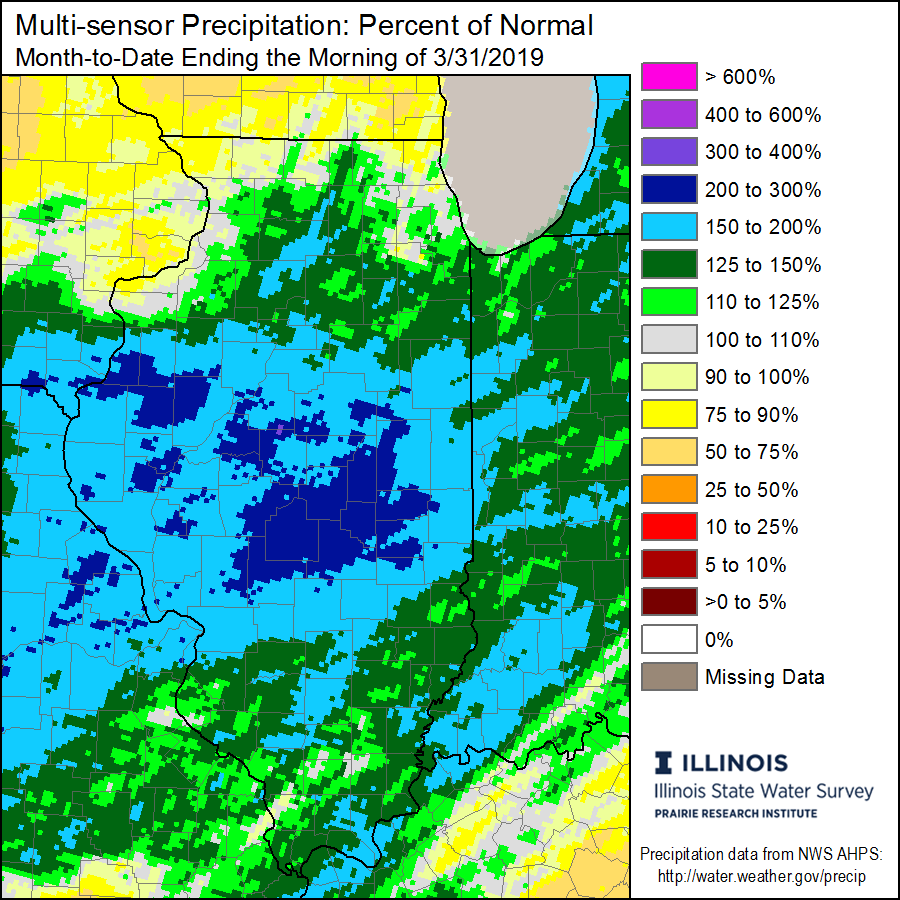
Above average March wetness led to precipitation anomalies over 100% of average for the southern two-thirds of the state, with the most impressive anomalies of 200-300% percent of average in a large area of central Illinois (see map below).

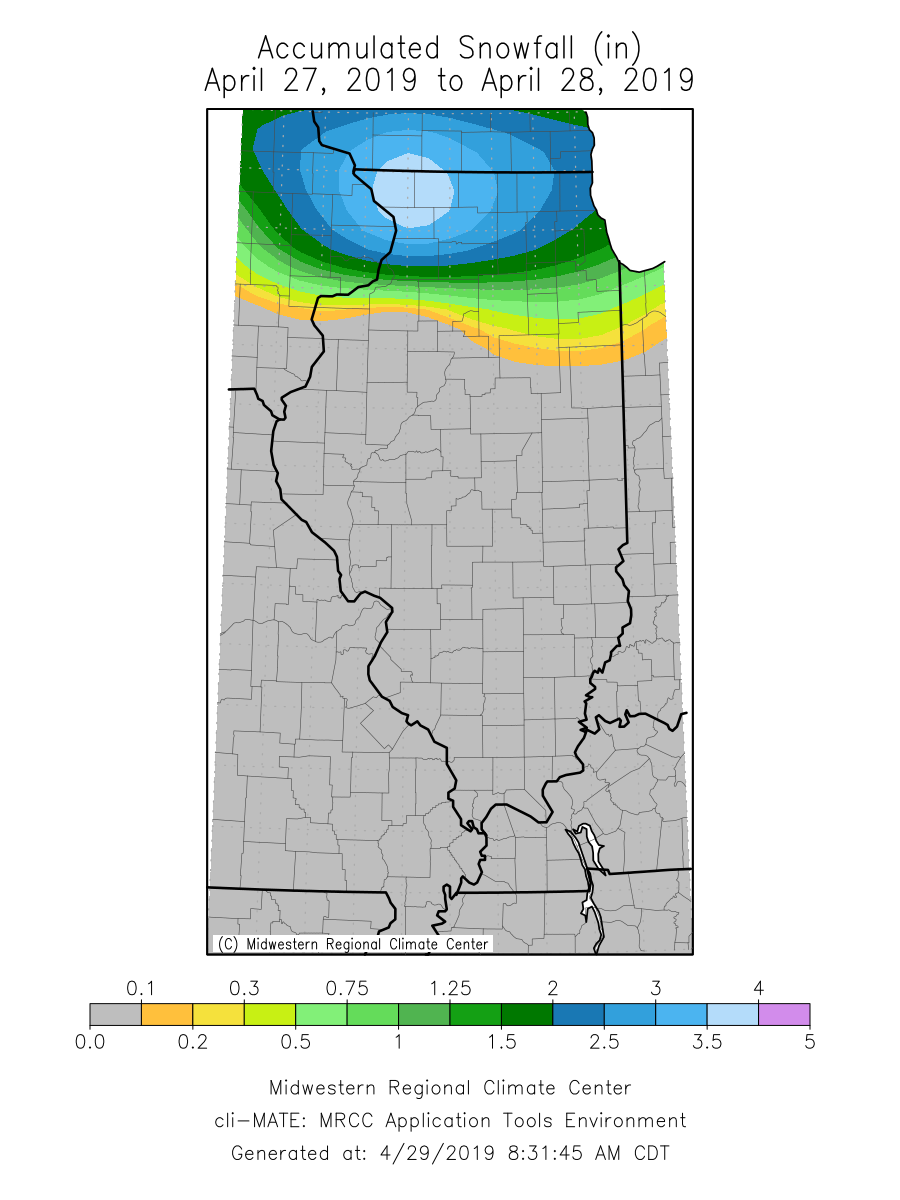
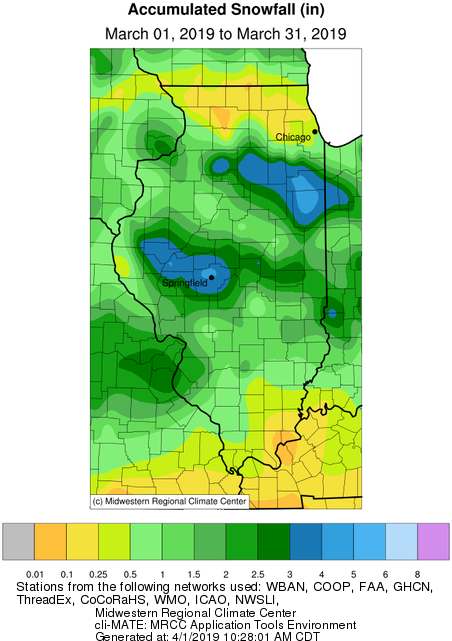
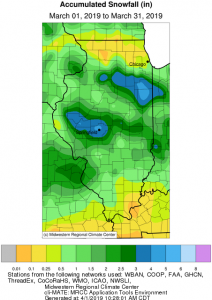
Snowfall in March did occur statewide, although it was rarely long lasting.  Storm tracks are apparent on the accumulated snowfall map, with two distinct snow maximums. One in the vicinity of the corridor from Rushville to Springfield, and a second centered near Kankakee.  In both cases 3 to 5 inches of accumulation were measured.

Spring Outlook

Soil moisture profiles across Illinois remain in the 90th percentile or higher as we head into April.  This leaves soil conditions favorable for spring runoff, and is an ever-growing concern for the agricultural community.

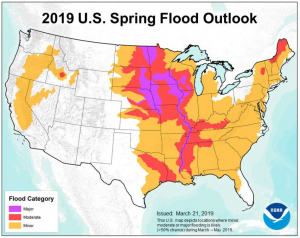
The National Weather Service (NWS) spring flood outlook places the entire state in its flood risk zone. Eastern and central Illinois are subject to a minor flood risk, while western, extreme northern and southern portions of the state are in a moderate flood risk zone.  Locations immediately along the banks of the Mississippi river are in a major flood risk zone.

April 2019

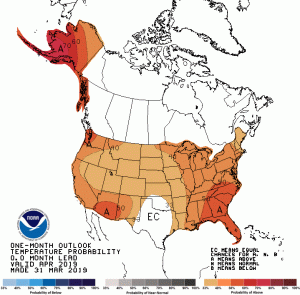
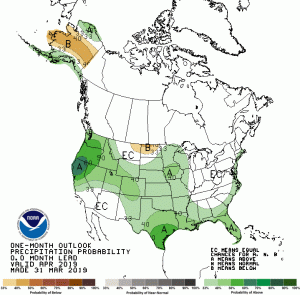
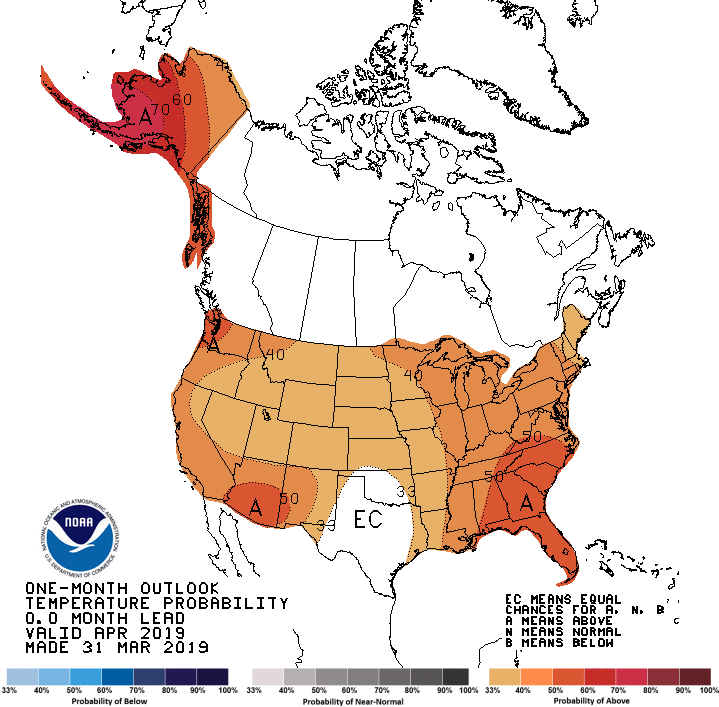
Looking ahead at the rest of April 2019, the Climate Prediction Center (CPC) is favoring probabilities of above average temperatures statewide.  This is a welcome change compared to April 2018, which ranked as the second coldest April in state history.  An active weather pattern looks to persist, as the April outlook favors slight probabilities of above average precipitation for the western half of the state.

Mt. Carroll reclaims the title for the record minimum temperature in Illinois

Mt. Carroll reclaims the title for the record minimum temperature in Illinois

Champaign, Ill., 3/6/19: An Arctic outbreak in late January 2019 led to widespread bitterly cold temperatures across much of the Upper Midwest, including Illinois. On the morning of Jan. 31, the cooperative weather observer at Mt. Carroll, located in Carroll County, reported a temperature of -38 degrees.

After a comprehensive review, the State Climate Extremes Committee (SCEC) unanimously voted to validate the -38 degrees reading as the new official state record minimum temperature. This committee ensures that the observation is meteorologically plausible, is within a range that the reporting instrument can detect, and that the instrument is in proper working order.

Brian Kerschner at the Illinois State Water Survey represented the Illinois State Climatologist Office as a member of the SCEC, along with delegates from the National Weather Service (NWS), the Midwest Regional Climate Center (MRCC), and the National Center for Environment Information (NCEI).

The previous minimum temperature record for Illinois was -36 degrees set in Congerville, located in Woodford County, on Jan. 5, 1999. The coldest temperature prior to the Congerville record, -35 degrees, was also set at Mt. Carroll in January 1930, and was later tied with Elizabeth in February 1996.

The Mt. Carroll station is a traditional daily observing station located in northwestern Illinois. It has been in service, with minor interruptions, since 1895, and has been observing temperatures since 1897. It is operated by the City of Mt. Carroll and attended by staff at the city’s water treatment plant.

You can view the final report on the NCEI website here: https://www.ncdc.noaa.gov/extremes/scec/reports

A complete list of current state records can be found here:
https://www.ncdc.noaa.gov/extremes/scec/records/IL

Mt. Carroll coop weather observation site
Feb. 1, 2019.
Photo: NWS Quad Cities WFO


Media Contacts: Brian Kerschner (217) 333-0729, Fax: (217) 244-0220, statecli@isws.illinois.edu

Editor: Lisa Sheppard (217) 244-7270, sheppard@illinois.edu

Meteorological Winter Recap: 2018-2019

Winter Review:  December – February (2018-2019)

Although the first week of March 2019 does not give us the satisfaction that spring will be arriving in the near future, it does mark the end of the meteorological winter season, which runs from December – February.

Despite what felt like an eternity of below average temperatures, the season as a whole finished with temperatures relatively close to the long term average. Referring to the map below, which represents average temperature departures, a few localities in the west-central and northwest portions of the state saw temperature departures of 1°F or more below average.  On the opposite end, locations in southern Illinois experienced temperature departures of 1-2°F above average during the 2018-19 winter season.

Statewide temperatures averaged 29.9°F, 0.8° above the long term average.

Average temperature for the season ranged from the low 20s north, to around 40° toward extreme southern Illinois.  Large variations occurred with seasonal highs in the 70s and lows in the -30s. The maximum temperature of 71°F occurred on Dec. 1 at Kaskaskia Navigation Lock in Randolph County.  The lowest temperature of -38°F occurred on Jan. 31 at Mt. Carroll in Carroll County, setting a new state record minimum temperature.

The last two days of January brought widespread cold weather to Illinois.  Many locations experienced some of the coldest weather that has been seen in decades allowing numerous daily and station record lows to be broken.  This event produced statewide temperature departures of 20 to 30° below average.

To gain additional perspective on this event, the updated map below displays the minimum temperature recording at stations throughout Illinois with at least 20 years of data.  The color of the station plot represents the month of occurrence, and temperatures in bold represent new records that were set in 2019 (click the map for a larger PDF version).

Precipitation was abundant throughout the state this winter season (see map below), this allowed the entire state to remain free of any abnormally dry, or drought designations during this period. Above average precipitation occurred every month during the season. Generally precipitation totals across Illinois ranged from 5 to nearly 15 inches, with counties south of I-70 experiencing the most precipitation.

Most remarkable was the 21.18 inches of precipitation reported at Smithland Lock and Dam on the lower Ohio River.  Overall, both southern and northwest Illinois received over 150% of their average winter precipitation, with several localities approaching 200% (see map below).

Statewide seasonal precipitation averaged 9.67 inches, which is 2.85 inches above the long-term average, ranking as the 6th wettest winter season on record for the state (with records going back to 1895-96).

The total accumulated snowfall map shows that snowfall occurred statewide this winter, with the heaviest accumulations centered in northwestern Illinois, and counties along the Illinois/Wisconsin border. Totals ranged from 1 to 10 inches in southern Illinois, 10 to 20 inches in central Illinois, and 20 to over 40 inches in northern Illinois.