July 2019: Prolonged stretch of abnormally wet weather comes to an end, along with notable hot and humid conditions.

July 2019 signaled the end of a persistent and historic stretch of abnormally wet conditions across Illinois, along with several notable periods of significantly above average temperatures.

Preliminary data suggest that July 2019 concluded drier than average, with temperatures above the long-term average. The preliminary average statewide July temperature was 77.3°F, which is 1.9°F above the long-term average. The preliminary average statewide precipitation was 3.23 inches, which is 0.85 inches below the long-term average.

Data are provisional and may change slightly over time

Precipitation

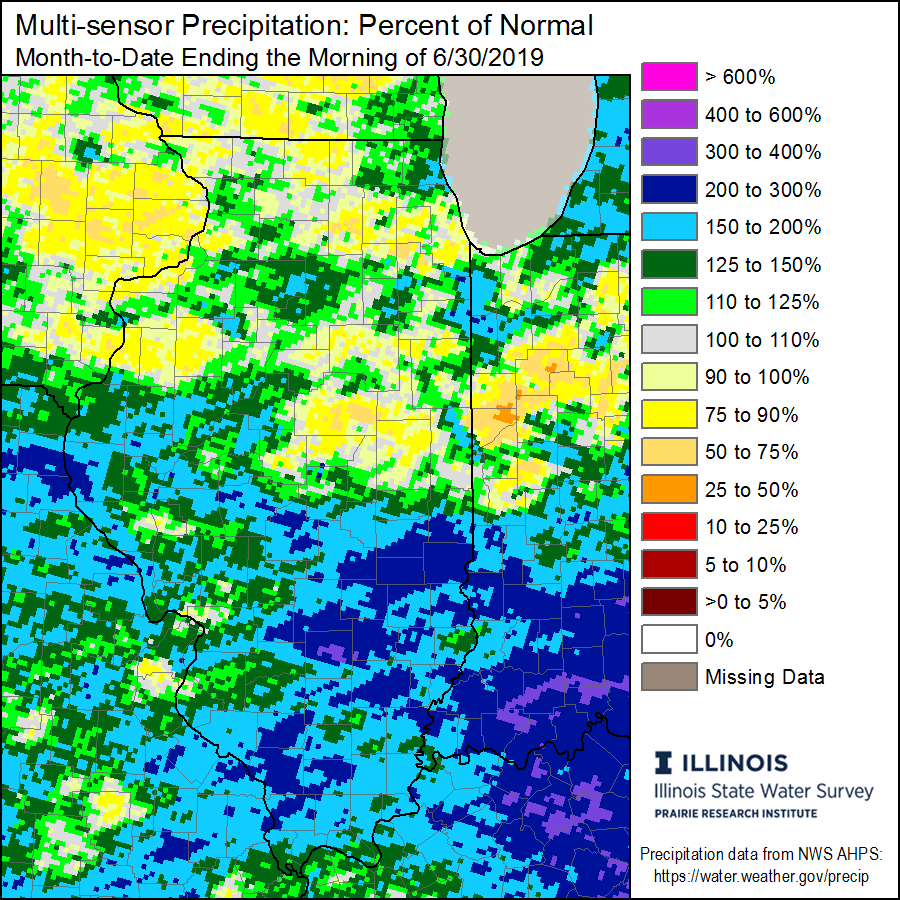
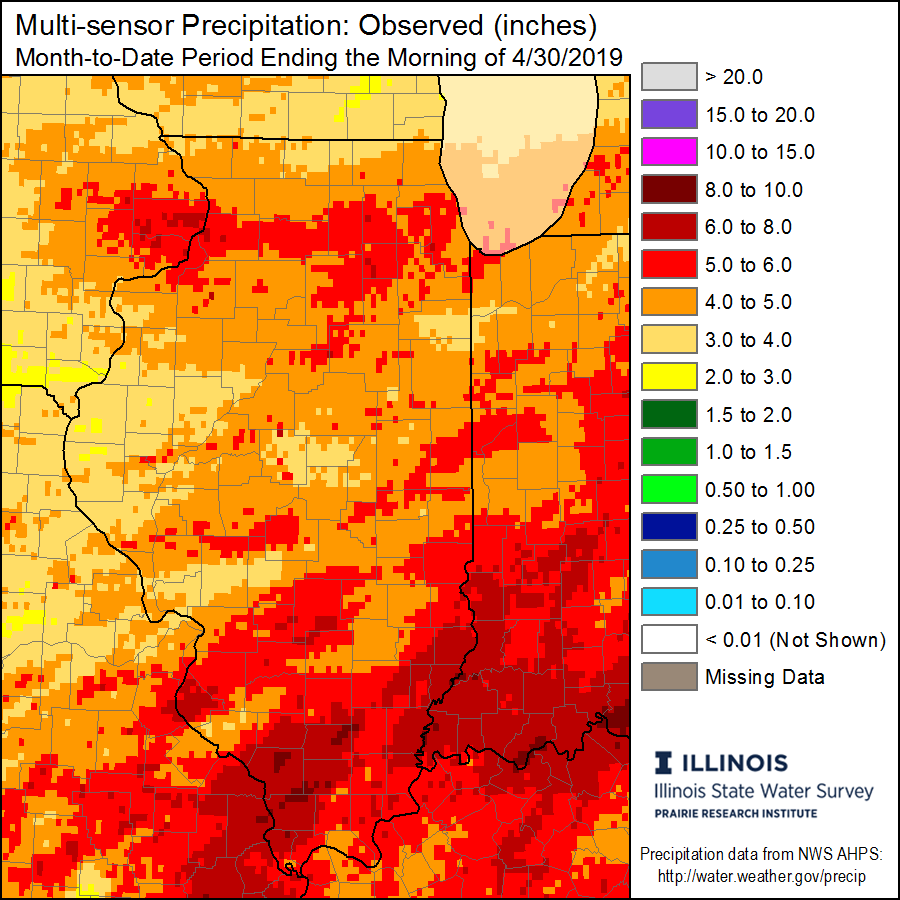
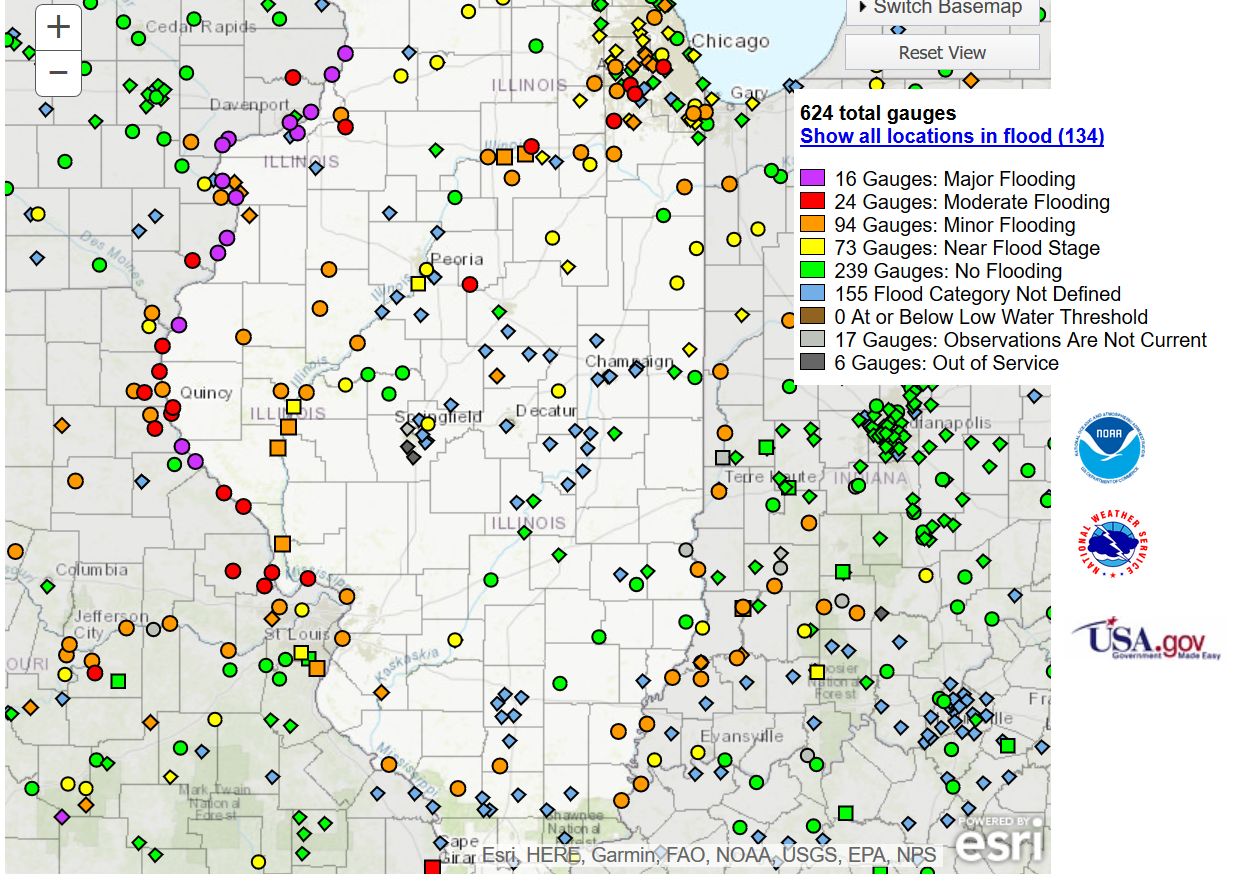
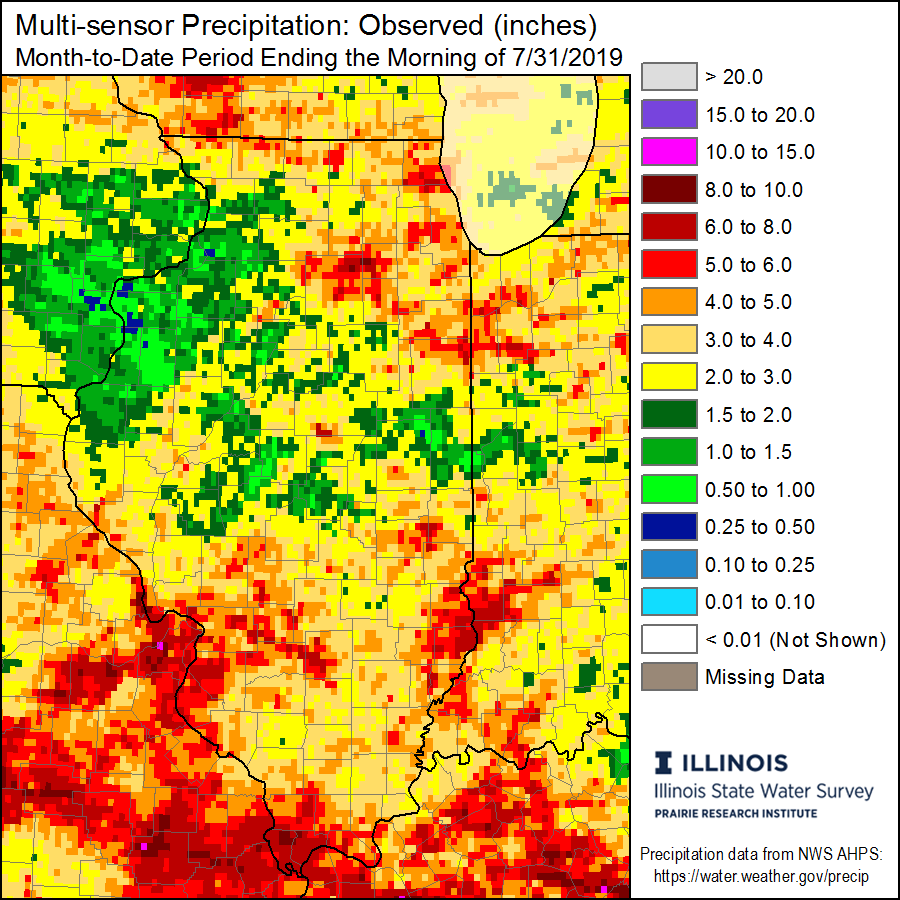
After seven consecutive months of above average statewide precipitation, July 2019 marked the end of the historic wet streak with below average statewide precipitation for the first time since November 2018. Despite the overall below average designation, July precipitation across Illinois was not evenly distributed.

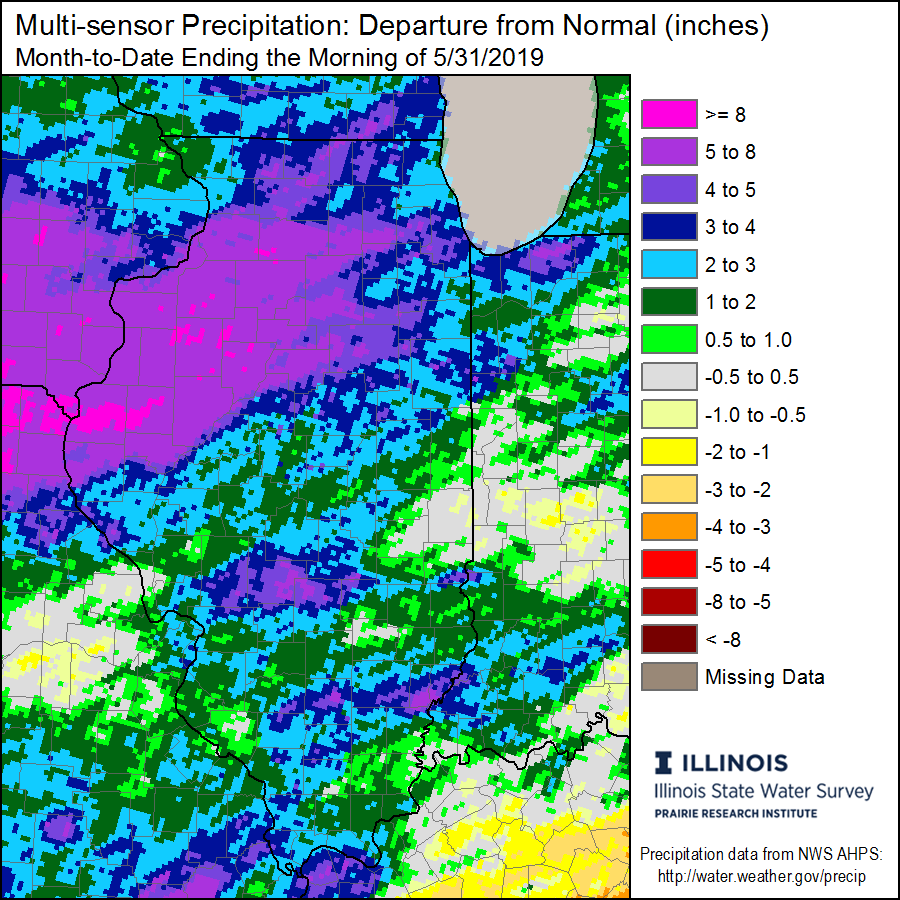
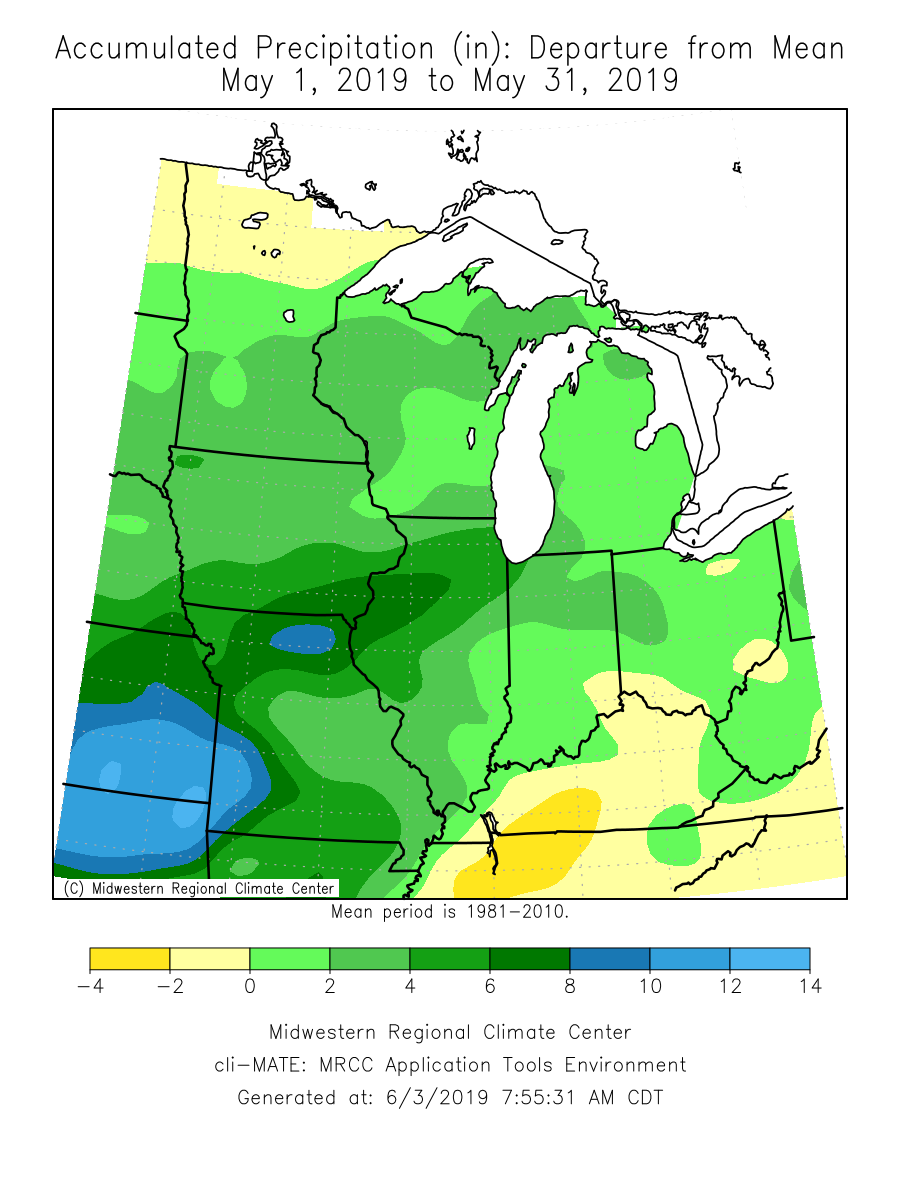
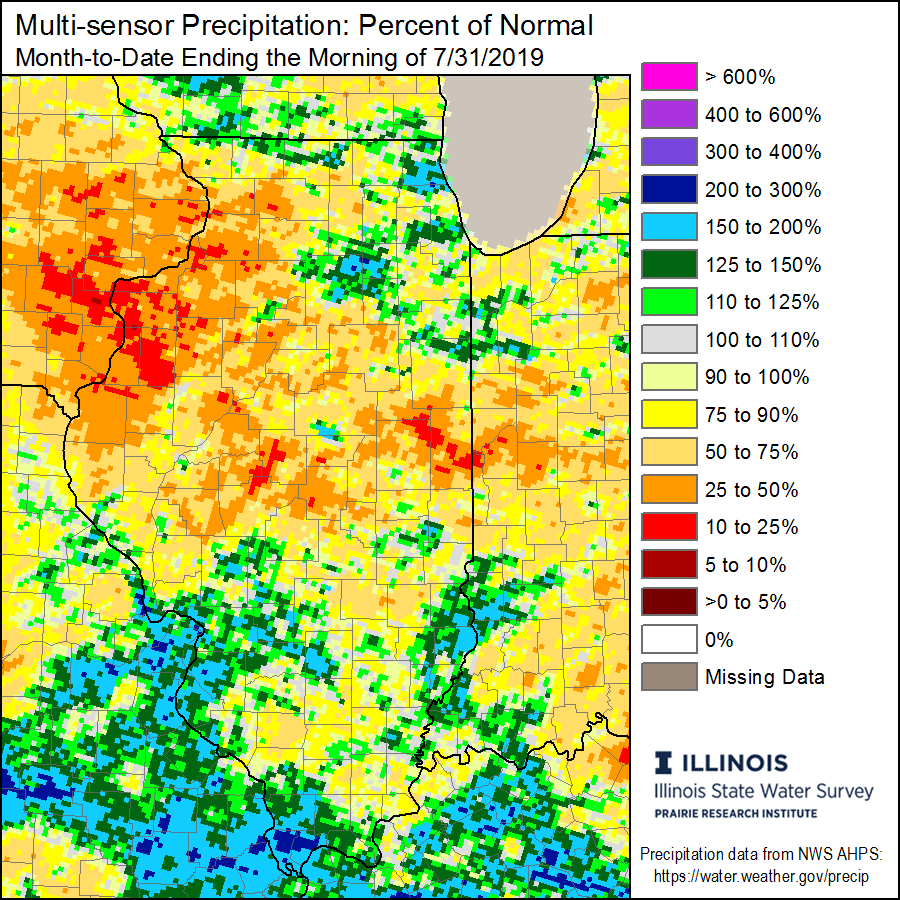
Many in southern and northeastern portions of the state experienced near to above average precipitation totals in July, with a station near Highland (Madison County) reporting the highest monthly rainfall total of 9.02 inches. In contrast, large regions of western and central Illinois saw below average rainfall. In fact, multiple localities near the Quad Cities and along the Mississippi River, as well as smaller regions in east-central Illinois received only 10 to 25% of average monthly precipitation (see maps below).

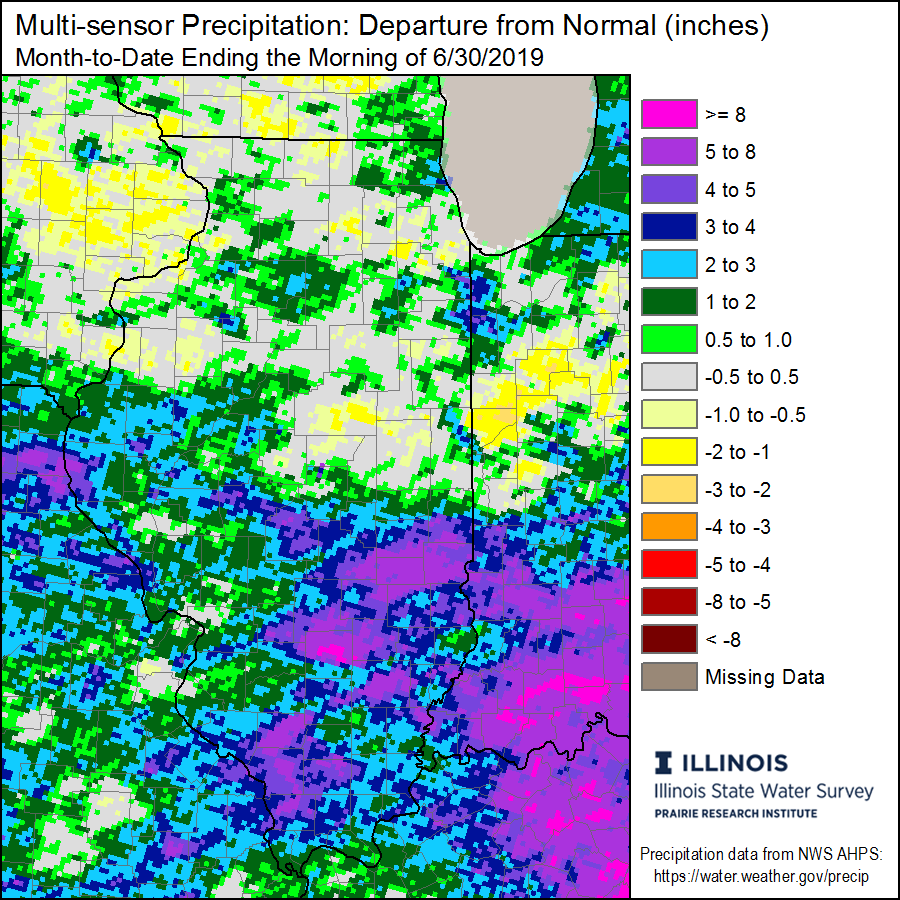
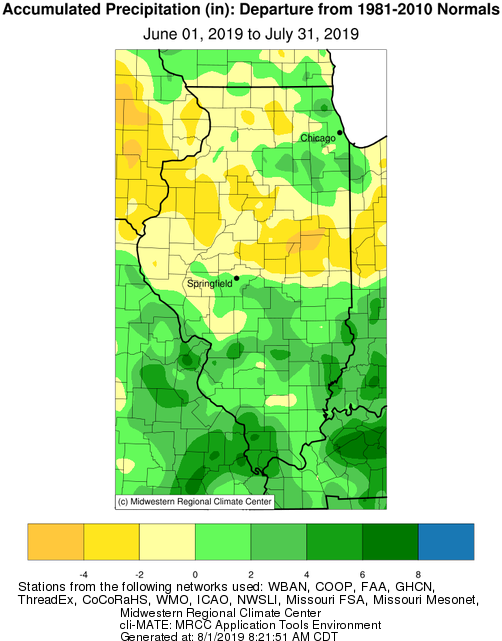
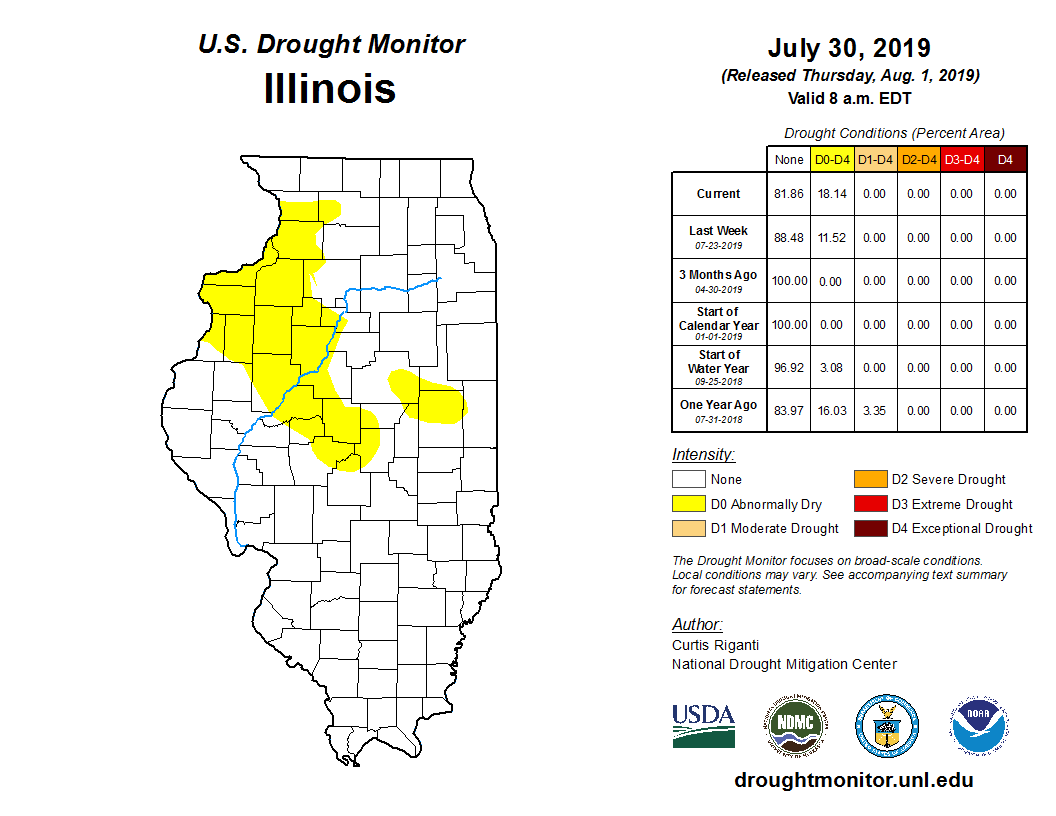
Dating back to June 1, these same regions have reported precipitation departures of around 2 to 4+ inches below the long-term average. This extended stretch of dry conditions prompted the August 1 map from the U.S Drought Monitor (using data through July 30) to continue to highlight areas of abnormally dry conditions across the western and central portions of the state.

Illinois Precipitation Departures Map
Midwest Regional Climate Center (MRCC), accessed 8/1/2019
Illinois Drought Map
U.S Drought Monitor (UDSM) Illinois, accessed 8/1/2019

Interactive July 2019 Climate Station Precipitation Map

Temperature

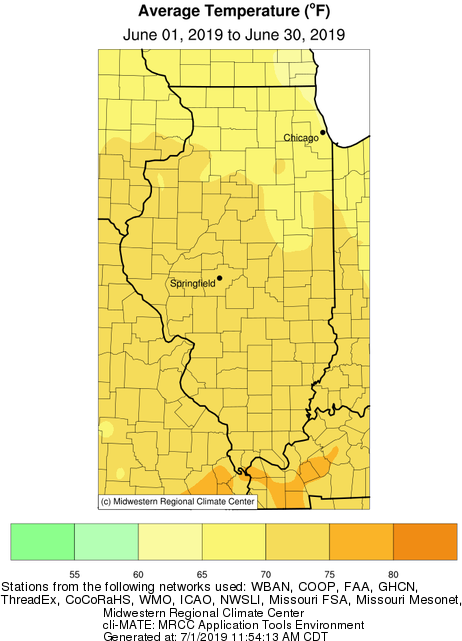
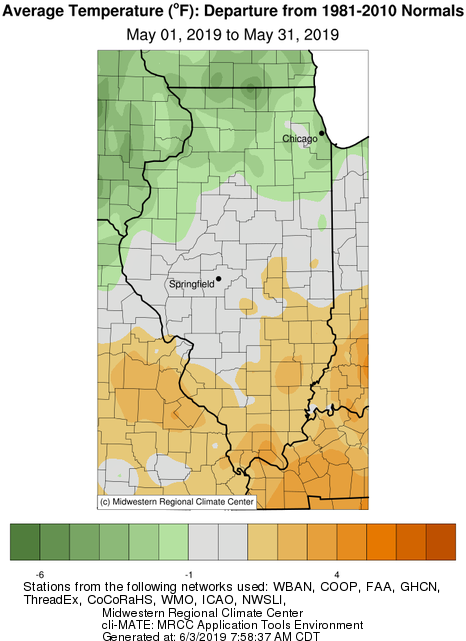
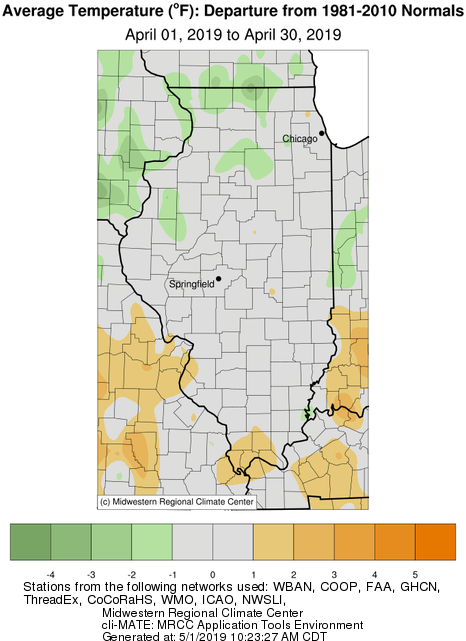
Despite an overall seasonable and pleasant ending, the first weeks of July brought several extended periods of heat and humidity to Illinois. Most notable was the heat wave that impacted the region from July 18 through July 21, in which every county in Illinois was under an Excessive Heat Warning at some point during the weekend. Throughout this event, daily maximum station temperatures soared into the 90s, with dew points in the mid- to upper 70s. This resulted in heat indices over 100 for many and approached 110 or higher in some localities. Daily temperature departures of 8 to 10+ degrees above average were common across the northern half of the state (see map below).

Illinois July Heatwave Map

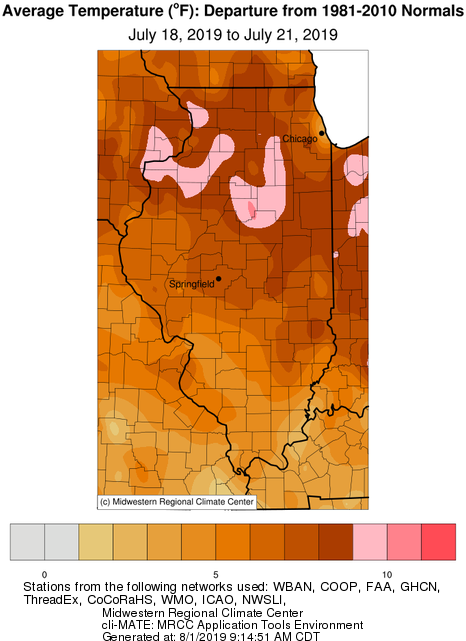
Overnight low temperatures during this event did not bring much, if any, relief from the heat. With a daily minimum temperature of only 80 degrees on July 19, Rockford (Winnebago County) set a new all-time record-high minimum temperature. Records for Rockford extend back to 1905.

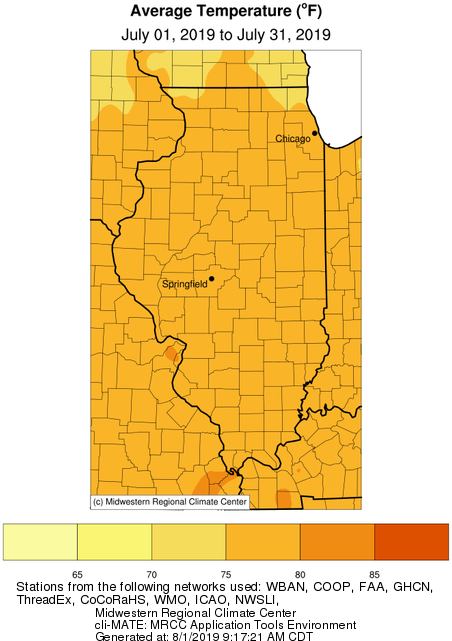
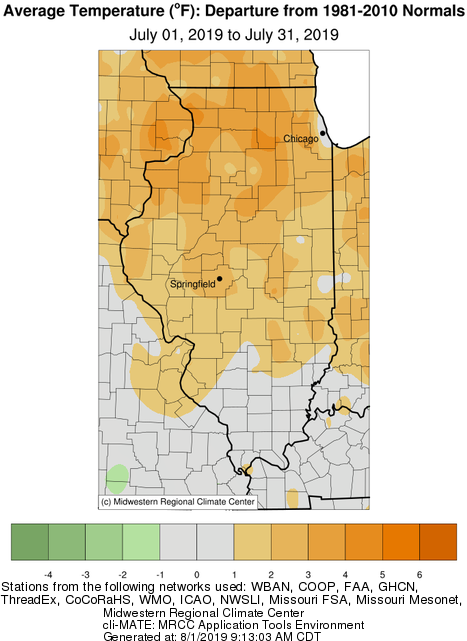
Looking at July as a whole, the average station temperatures varied from the mid-70s to the low 80s, and monthly temperature departures of 1 to 4 degrees above the long-term average were common for the northern two-thirds of Illinois (see maps below). The highest temperature reading in the state of 98 degrees occurred at two stations, Flora (Clay County) on July 11, and Palestine (Crawford County) on July 21. The lowest minimum temperature of 51 degrees also occurred at two stations, one near Champaign (Champaign County) on July 23, and at a station near Paxton (Ford County) on July 25.

Illinois July Average Temperatures

Ilinois July Temperatuer Departures

Interactive July 2019 Climate Station Temperature Map
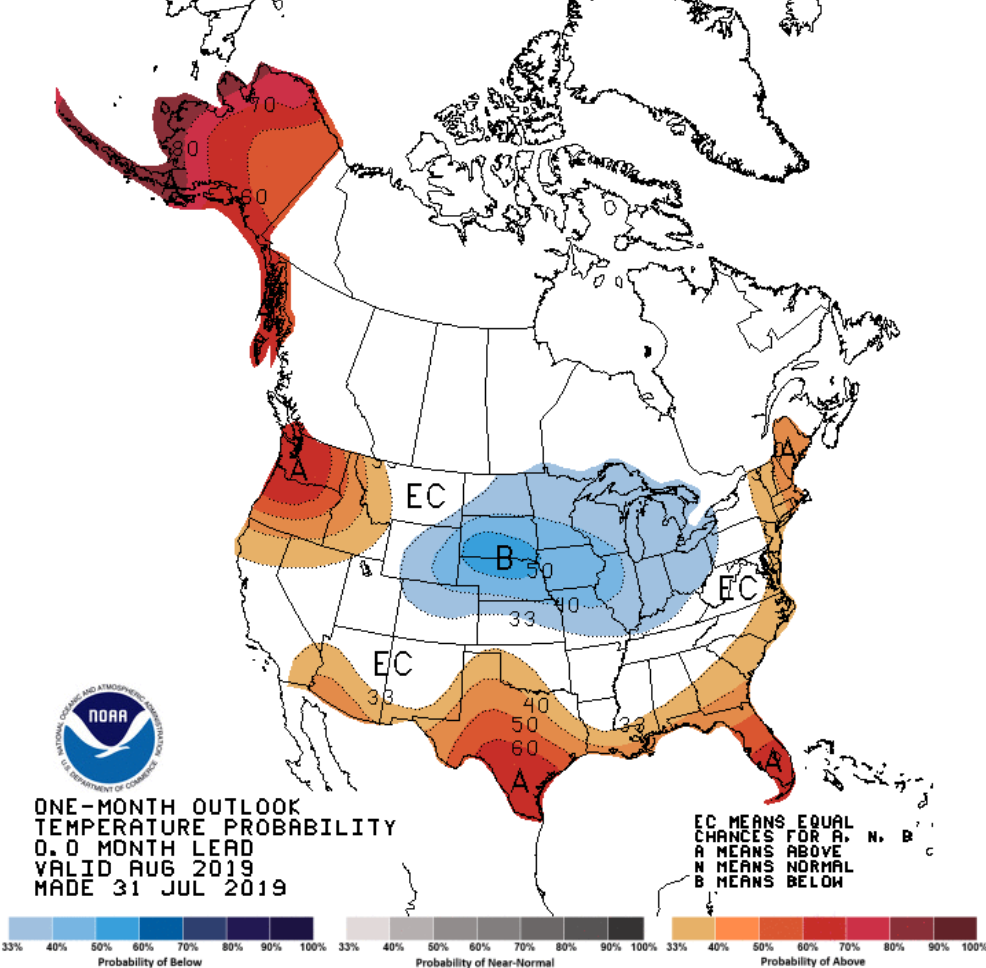
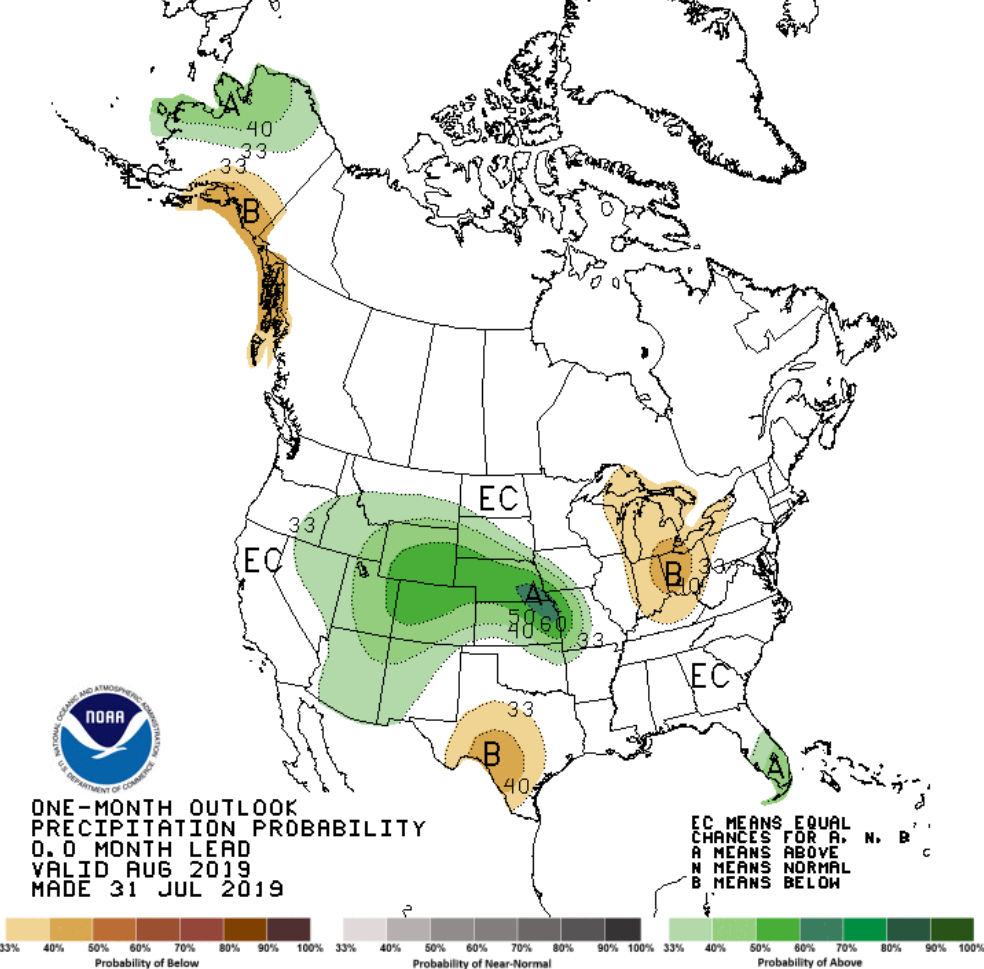
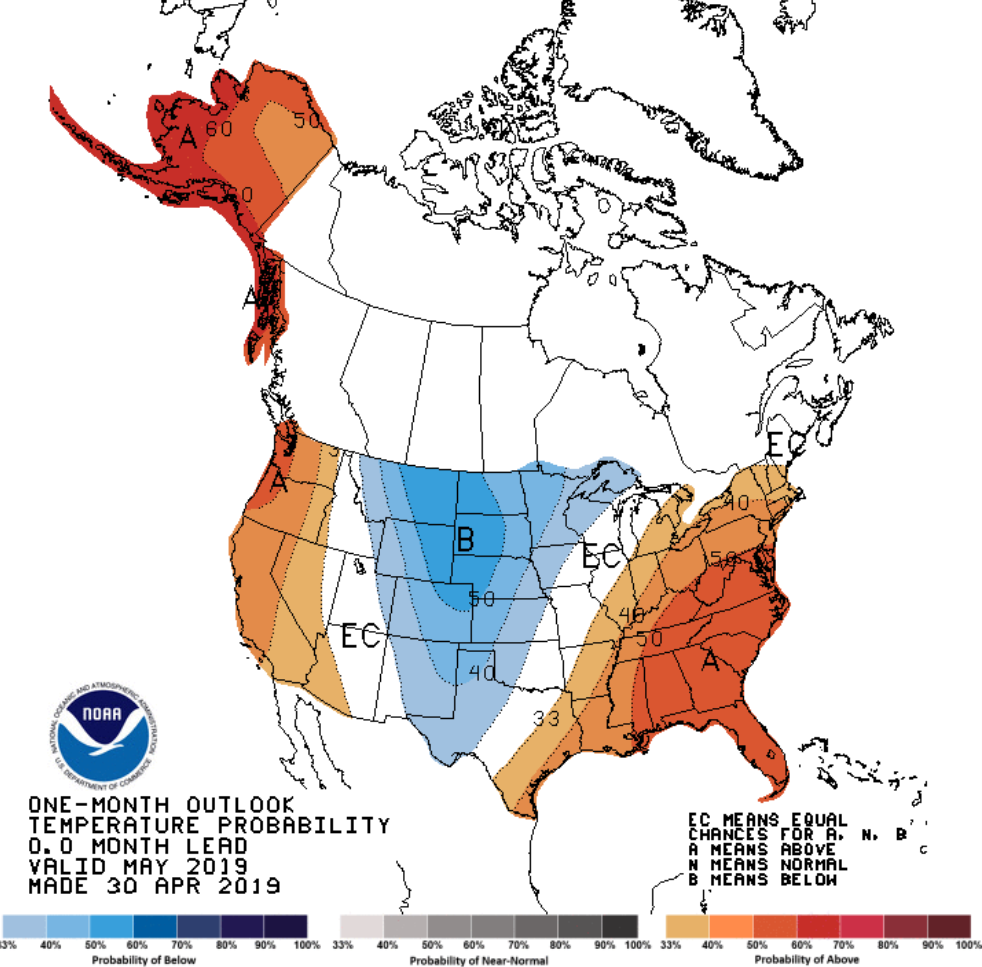
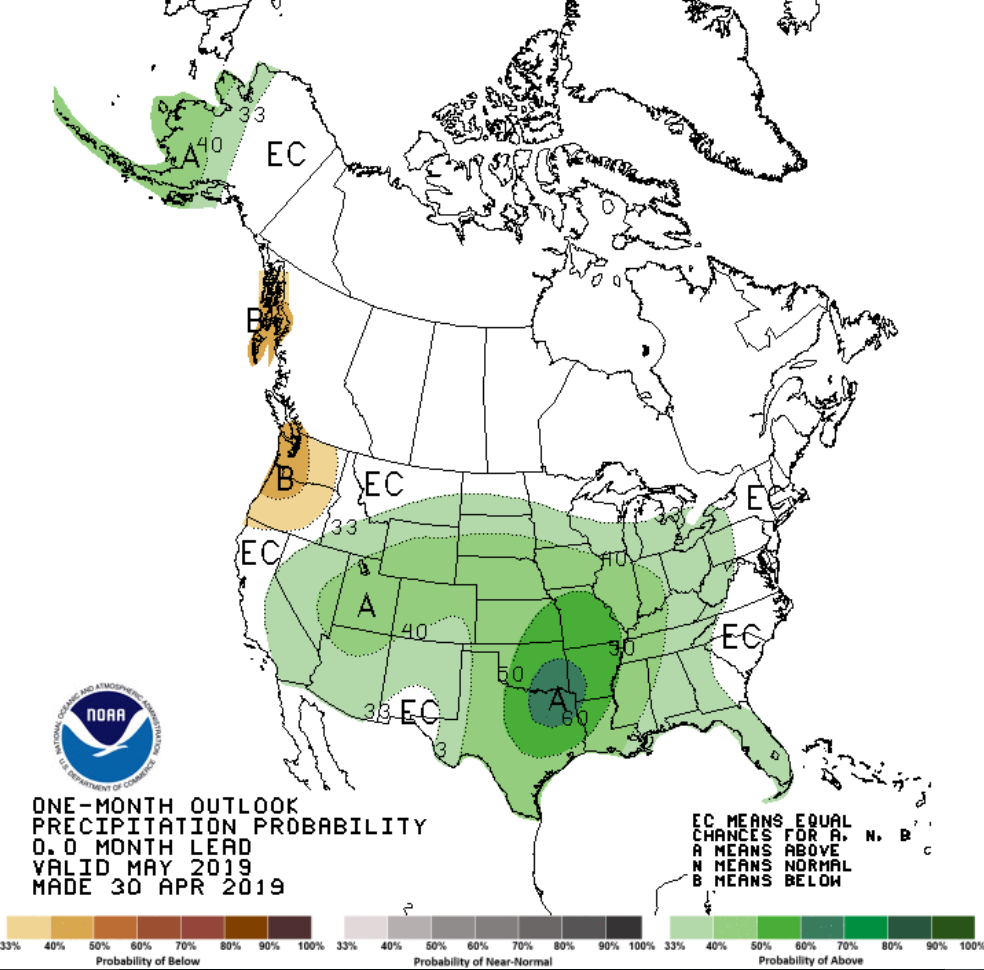
August 2019 Outlook

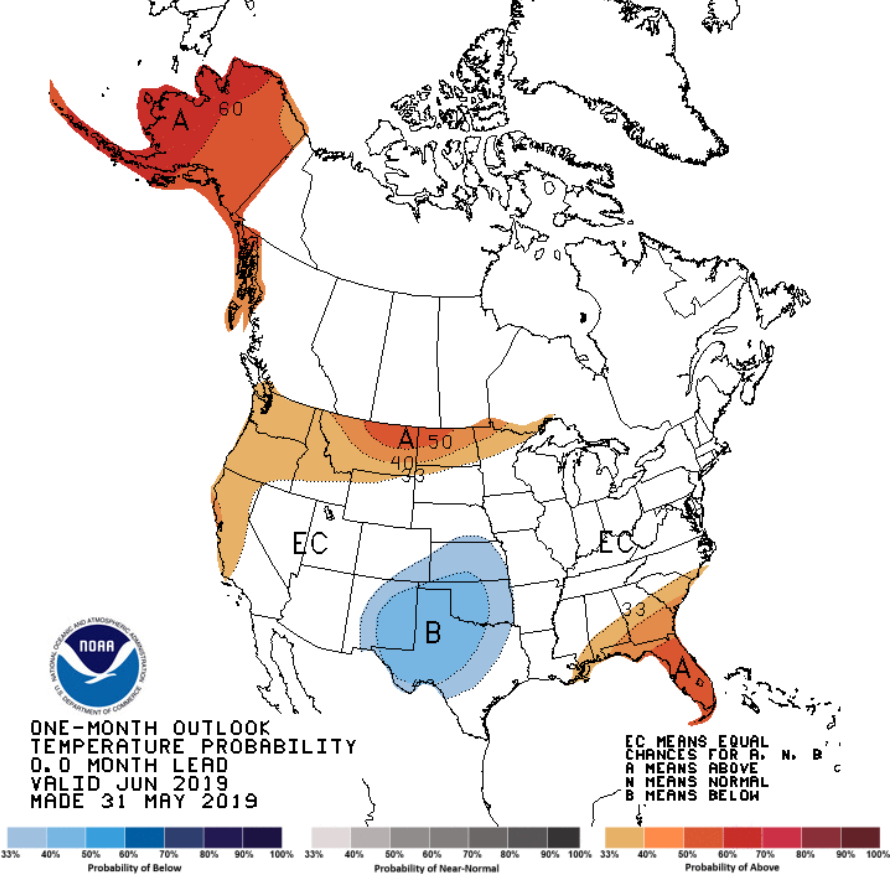
For the remainder of August, the monthly outlook from the Climate Prediction Center (CPC) issued on July 31 favors probabilities for below average temperatures across Illinois and most of the upper Midwest. The outlook also favors near equal chances for below, near, or above average precipitation.

CPC August 2019 Temperature Outlook
August 2019 Temperature Outlook
CPC August 2019 Precipitation Outlook
August 2019 Precipitation Outlook

June 2019: Stormy and Wet with a Warm Finish

June 2019 will be a month remembered for a continuation of above average precipitation and near to seasonably cool temperatures, despite an unseasonably warm finish.

Preliminary data suggest that June 2019 concluded wetter than average, with temperatures slightly below the long-term average. The preliminary average statewide June temperature was 71.0°F, which is 0.9°F below the long-term average. The preliminary average statewide precipitation was 5.39 inches, which is 1.18 inches above the long-term average.

Data are provisional and may change slightly over time

Precipitation and Flooding

After near historic crests at multiple gages along both the Illinois and Mississippi rivers early in the month, water levels continued to slowly recede for many regions heading into July.  However, above average precipitation in June, combined with calculated soil moisture content remaining in the 90th to 99th percentile across Illinois, leaves the state with an elevated risk of continued flooding over the next month, especially in regions that may be affected by storms or locally heavy rainfall.

Flooding concerns along Lake Michigan were common in June. According to the U.S. Army Corps of Engineers, water levels in the Lake Michigan-Huron system have risen by nearly 5 inches throughout the month. By the end of June, average levels were reported to be 33 inches, or about 2.75 feet above the historical June average.  These levels set a new June record by nearly 2 inches. Water levels of this magnitude haven’t been exceeded since 1986.

Preliminary results show that the June 2019 statewide precipitation total of 5.39 inches was 1.18 inches above the long-term average.  This marks the 8th consecutive month in which no part of Illinois has been listed as in drought or abnormally dry by the U.S. Drought Monitor, and the 7th consecutive month with above average statewide precipitation.

June rainfall in Illinois was not evenly distributed. Several regions in the northern half of the state reported precipitation totals slightly below to near average for the month, with localized regions of above average precipitation. A large majority of the southern half of the state experienced more uniform above average precipitation departures, with numerous localities receiving 200 to 300% of normal (see maps below).

A gage near Cobden (Union County) reported the highest official precipitation total for June, with a reading of 10.73 inches.

Interactive June 2019 Climate Station Precipitation Map

Temperatures

Preliminary results show that June finished with a statewide average temperature of 71.0°F, which is 0.9°F below the long-term average.

The middle of the month was characterized by an extended period of unseasonably cool temperatures, while the start of astronomical summer brought a steady warming trend which allowed temperatures to reach into the upper 80s and 90s for the final days of June.

Temperature departures for the month were near to 1 to 3° below average, with average temperature values ranging from the mid-60s up into the mid-70s (see maps below).

The highest maximum temperature recorded in the state, at two separate stations, was 97°F, once at a station near Bentley (Hancock County) on June 5, and once at a station near Flora (Clay County) on June 30.

The lowest minimum temperature of only 43°F was reported in Danville (Vermilion County) on the morning of June 14.

Interactive June 2019 Climate Station Temperature Map

July 2019 Outlook

As we head into July, the monthly outlook from the Climate Prediction Center (CPC) favors slight probabilities for below average temperatures across most of the state, as well as continued probabilities of wetter than average conditions statewide.


May 2019: Exceptionally Wet and Stormy Across Illinois

May 2019 will be a month remembered for exceptional, record-breaking wet conditions locally, as well as an active, stormy, and at times severe weather pattern across the state.

Preliminary data suggest that May 2019 finished significantly wetter than average, with temperatures marginally below the long-term average. The preliminary average statewide May temperature was 62.5°F, which is 0.2°F below the long-term average. The preliminary average statewide precipitation was 8.43 inches, which is 3.83 inches above the long-term average.

Precipitation

Preliminary statewide average precipitation for May was 8.43 inches, which is 3.83 inches above the long-term average, marking six consecutive months with above average statewide precipitation. As it stands now, spring 2019 will rank within the top four wettest spring seasons in state history (March–May), with May 2019 ranking as the third wettest May in state history.

The multi-sensor precipitation departure map for Illinois shows that practically the entire state received above average precipitation for the month. The only exception was a small region in east-central Illinois near Edgar County, where near to slightly below average precipitation occurred (see maps below).

Portions of west-central and northern Illinois reported the heaviest rainfall for the month, where monthly precipitation departures of 5 to 8 inches above average were common, bringing 200 to 300 percent of average monthly rainfall.  An area roughly defined between Quincy and the Quad Cities extending eastward to near Peoria received the most precipitation in the state, with 7 rain gages in this region recording 13 or more inches of rainfall during May.

A gage near Dallas City (Hancock County) reported the highest precipitation total for May, with an impressive 14.75 inches.

Data from the National Weather Service showed that with a report of 8.25 inches, Chicago experienced its wettest May on record, beating the 8.21-inch reading that was set just last year in May 2018.

The abnormally wet May weather has led to a continuation of elevated flooding risks and significant planting delays for the Illinois agricultural community.  Moderate and major flooding along many local streams and rivers is still ongoing, with flood warnings along both the Illinois and Mississippi Rivers in effect until further notice.

Wet, active, and stormy weather has not only been an issue for Illinois, but also the weather has been a growing risk across much of the central and southern Midwest including the Corn Belt where notable above average precipitation departures for May were also present (see map below).

Severe Weather

In addition to the relentless rainfall, multiple rounds of severe weather impacted the state throughout the month. Statewide, 218 severe weather reports were noted from the Storm Prediction Center, 20 for tornadoes (red), 52 for hail (green), and 146 for wind (blue). Note that multiple reports may be generated for a single event.

Map of May 2019 Severe Weather Reports in Illinois, updated 6/4/2019

Temperature

Preliminary results show that May 2019 finished with a statewide average temperature of 62.5°F, which is 0.2°F below the long-term average.

Monthly temperature departures showed that the northern third of the state generally saw average temperatures of 1 to 3 degrees below normal, while the southern third of the state generally saw average temperatures of 1 to 3 degrees above normal, with near normal temperatures occurring throughout central Illinois.

The highest maximum temperature in the state was recorded at the Kaskaskia River Navigation Lock (Randolph County) with a reading of 93°F on May 26. In contrast, the lowest minimum temperature of 31°F was recorded at the Chicago Botanical Garden (Cook County) on May 4.

June 2019

Although an active weather pattern looks to continue at least for a portion of the first full week of June, the monthly outlook from the Climate Prediction Center favors equal probabilities for below, near, or above average precipitation and temperatures across Illinois for June 2019.

April 2019: An Active Weather Pattern and Late Season Snow!

April 2019 will be a month remembered for a continuation of an active and stormy weather pattern across Illinois, with two short lived, yet notable and uncommon late season snow events which impacted many in northern portions of the state.

The month finished noticeably wetter than average, with temperatures marginally below the long-term average. The preliminary average statewide April temperature was 52.0°F, which is 0.6°F below the long term average. The preliminary average statewide precipitation was 4.58 inches, which is 0.80 inches above the long term average.

Note: Data are provisional and may change slightly over time.

Precipitation

Preliminary statewide average precipitation for April was 4.58 inches, which is 0.80 inches above the long term average.

Precipitation in Illinois has been above average since December 2018. Preliminary data would rank this as the 7th wettest December – April period in state history. The end of April 2019 marked six months since any portion of the state has been classified as in drought, or abnormally dry by the U.S Drought Monitor..

An active spring weather pattern resulted in a majority of regions in northern, eastern, and southern portions of the state receiving over 100% of average monthly precipitation, with localized amounts approaching 200%.  Smaller regions of the state in west-central Illinois – roughly between the Mississippi and Illinois rivers are the only locations to receive near or below average precipitation for the month (see map below).

The heaviest precipitation fell in extreme southern Illinois, especially in counties bordering the Wabash and Mississippi Rivers, where 6 to 8+ inches were common (see map below).  The highest total in the state was reported at a station near Cobden (Union County) with 8.31 inches.

Heading into May, flooding remains an ongoing concern for the state, as soil moisture percentiles remain in the 90th to 95th percent range.

As of April 30th, 134 river gauges affecting Illinois were reported with crests in minor, moderate, or major flood stages. The greatest threat continues to remain along the Mississippi River. River flooding concerns were intensified by several days or heavy rains during the last week of April.

Snowfall

A majority of April snowfall came from two short lived, yet notable late season events that impacted many in northern portions of the state.

The first event on the weekend of April 13th and 14th brought widespread reports of 1 to 5 inches along a corridor extending from near Quincy, and running northeast toward Chicago and the Illinois/Wisconsin border. Several localities west and north of Chicago reported 6 to 8+ inches. Notable accumulations were measured as far south as Peoria. An accumulation of 5.4 inches at Chicago O’Hare Airport tied the record for the snowiest calendar day this late in the season.  April 16, 1961 also recorded 5.4 inches of snow.

The second snow event on April 27th brought a variety of wintry precipitation types to locations in northern Illinois, including another round of accumulating snow for many from Chicago and points north and west.  With 3.7 inches, this was the latest 2+ inch snow event on record for Rockford (Winnebago County).

The maximum monthly snowfall in Illinois was reported at a station near St. Charles (Kane County) with an impressive 13.5 inches.

Temperature

Preliminary results show that April 2019 finished with a statewide average temperature of 52.0°F which is 0.6°F below the long term average.

Despite several significant temperature swings throughout the month, which are common during springtime, statewide April temperatures finished right around the long term average. A few pockets in extreme southern Illinois reported slightly above average, and sporadic regions in northern Illinois reported slightly below the long term average.  This is a welcome change from last year,  April 2018, which ranked as the second coldest April on record.

The highest temperature in the state was recorded at a station near Jerseyville (Jersey County) with a reading of 85°F on April 23.  In contrast, the lowest temperature of 18°F was recorded at a station in Altona (Knox County) on April 1.

May 2019

Looking ahead at the rest of May 2019, the Climate Prediction Center (CPC) is favoring probabilities of above average temperatures for the southeast half of the state, with equal chances of above, near, or below average temperatures for the northwest half of the state. Unfortunately, an active weather pattern looks to persist, as the May outlook favors probabilities of above average precipitation statewide.