

A Climatologic Review: 2018
Now that 2019 is well underway, lets take a moment to reflect back on the climate averages and departures from 2018.
Note: Data are provisional and may change slightly over time
Temperatures
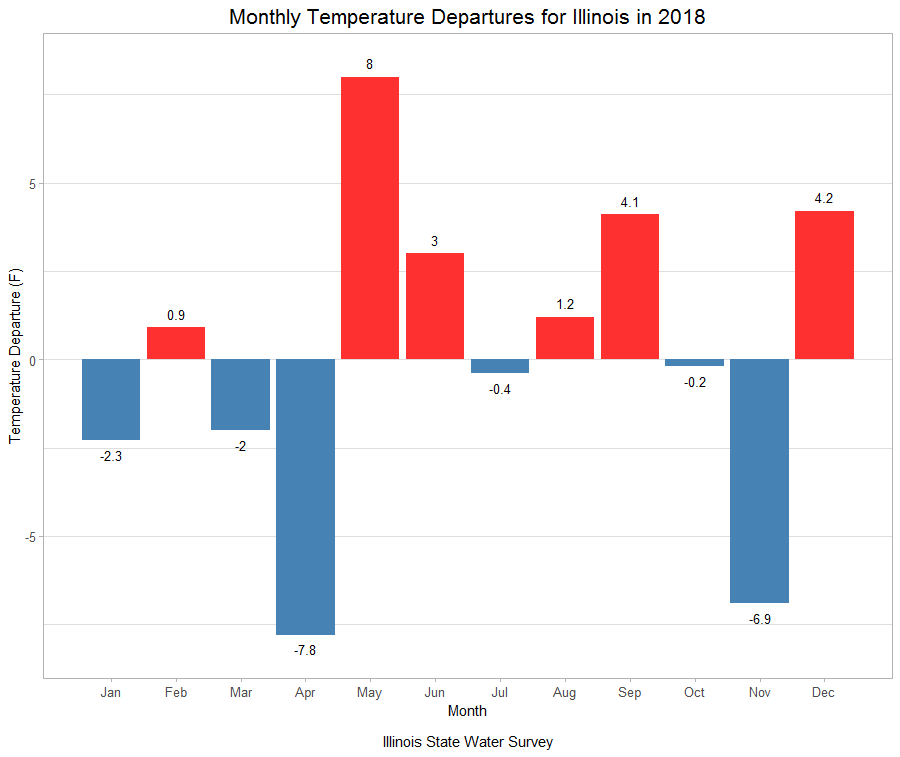
2018 was a year marked with several climatologically dramatic temperature swings. The chart below shows monthly temperature departures from the 1980 – 2010 long term average for Illinois. The most noteworthy feature is the -7.8°F departure that occurred in April, ranking April 2018 as the second coldest April on record for the state (records extend back to 1895). And with the turn of a calendar page, May saw a +8.0°F departure from the long term mean, ranking May 2018 as the warmest May in state history.
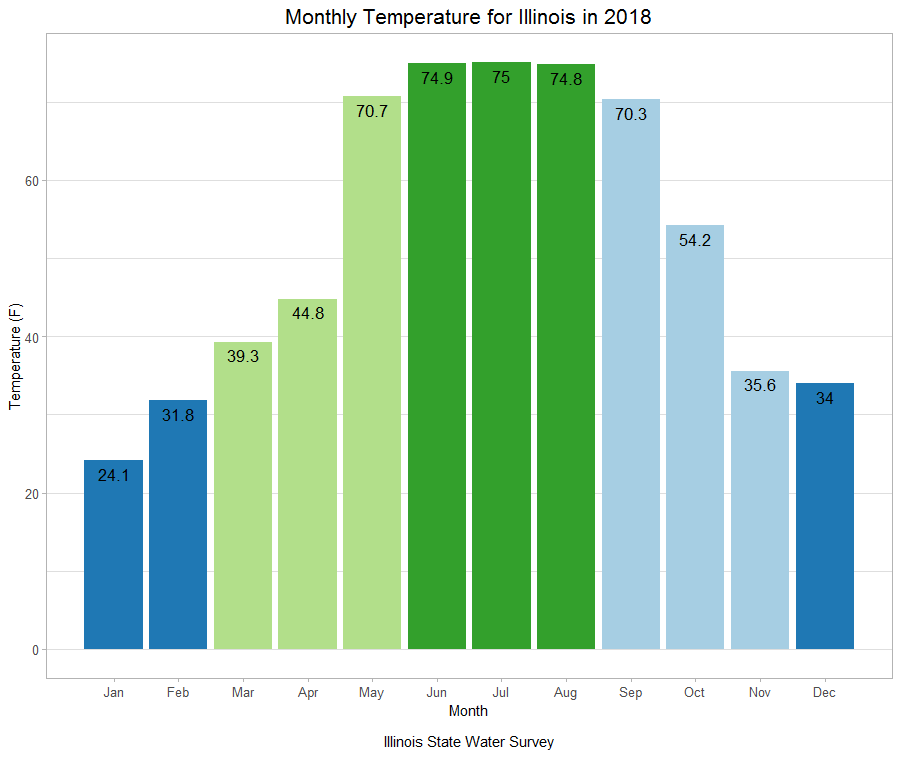
The plot below shows the average statewide temperature (F) by month for 2018, the colors represent meteorological seasons.
The map below shows spatially average temperature departures for the year 2018. Despite several dramatic temperature swings throughout the seasons, the year as whole finished right around the long term mean statewide. A few regions in the northwest were a degree below, and a few regions in the south/southeast were a degree above the long term mean.
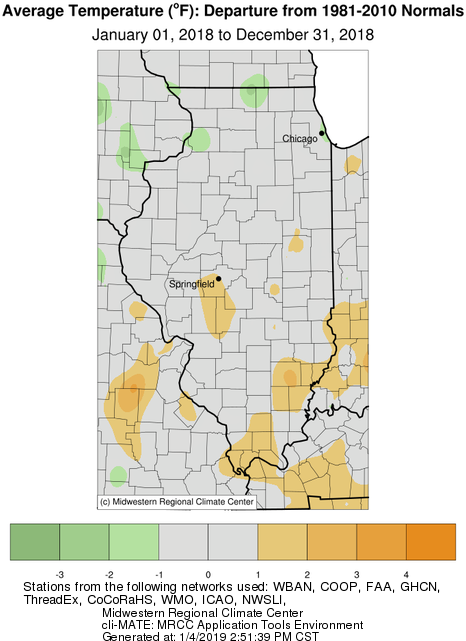
The statewide average temperature for 2018 was 52.5°F which is 0.2°F above the long term average.
- The highest temperature recorded in the state: MORRIS 1 NW in Grundy County with 100°F on May 28th, 2018
- The lowest temperature recorded in the state: MORRISON in Whiteside County with -24°F on January 1st, 2018
- The warmest mean temperature: LAWRENCEVILLE 2WSW in Lawrence County with 59.3°F
- The coldest mean temperature: PALESTINE in Crawford County with 43.1°F
Precipitation
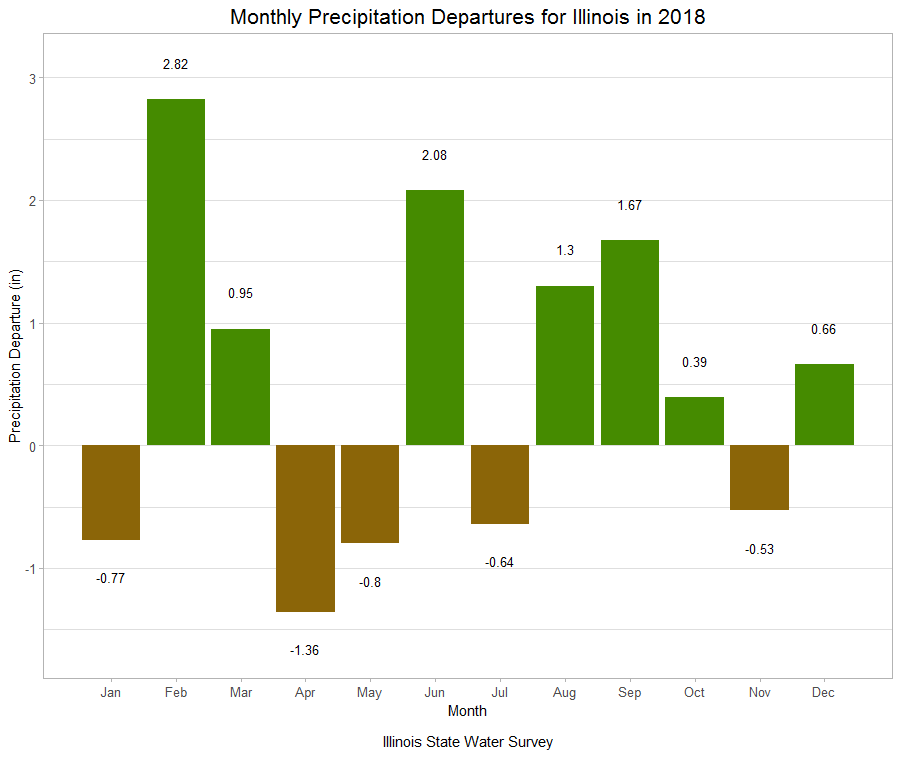
The chart below shows monthly precipitation departures from the 1980 – 2010 long term average for Illinois in inches. February saw the wettest departure from average at 2.82 inches. April saw the driest departure from average at -1.36 inches,
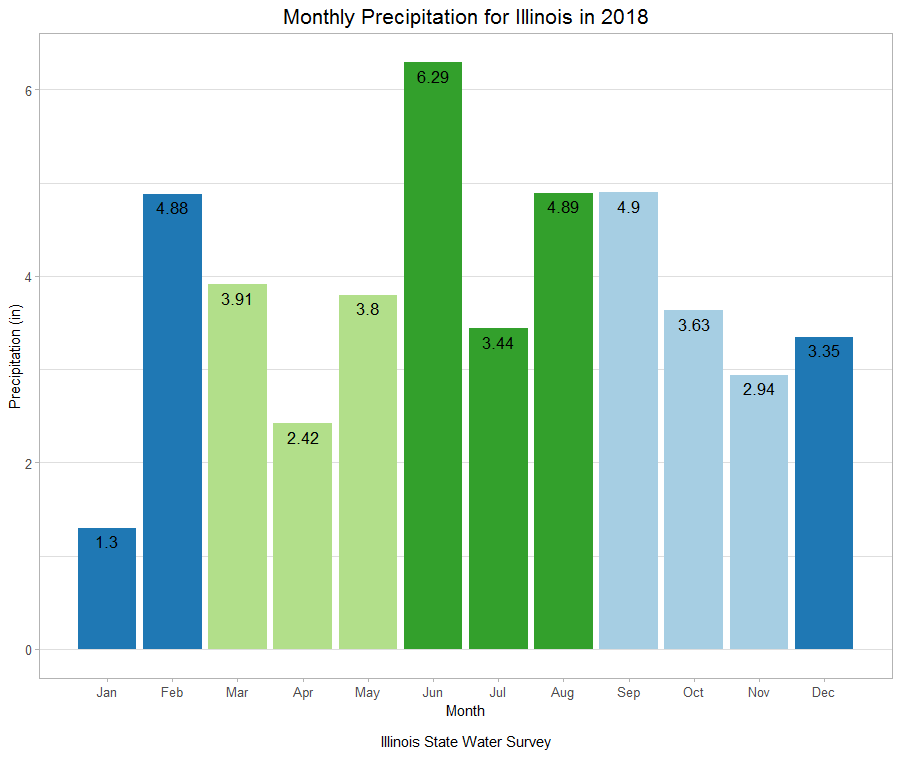
The plot below shows the average statewide precipitation (in) by month for 2018, the colors represent meteorological seasons.
The map below shows precipitation as a percent of normal for the year 2018 in inches. It was a rather wet year statewide, the highest percentages above average were reported in numerous regions across the extreme northern and southern portions of Illinois, where 125 to 150 percent of normal precipitation was measured.

The statewide estimated average precipitation for 2018 stands at 45.75 inches which is an impressive 5.79 inches above the long term average.
- The highest yearly precipitation in the state: NASHVILLE 1E in Washington County, with 66.79 inches
- Largest one day maximum event: CISNE 2.5 in Wayne County with 8.54 inches on September 8th, 2018
- Snowiest location in the state: BULL VALLEY 2.5 WNW with 55.4 inches, the one day maximum snowfall for the site was 13.1 inches on November 26, 2018
Severe Weather
Severe weather reports for Illinois in 2018 from the NOAA Storm Prediction Center. Note: It is possible to generate multiple report for the same storm/event
| Month | Total Reports | Tornado | Hail | Wind |
| January | 2 | 0 | 2 | 0 |
| February | 1 | 0 | 0 | 1 |
| March | 0 | 0 | 0 | 0 |
| April | 20 | 9 | 4 | 7 |
| May | 170 | 6 | 48 | 116 |
| June | 184 | 11 | 15 | 158 |
| July | 54 | 0 | 6 | 48 |
| August | 40 | 2 | 7 | 31 |
| September | 40 | 2 | 1 | 37 |
| October | 3 | 0 | 0 | 3 |
| November | 0 | 0 | 0 | 0 |
| December | 52 | 34 | 11 | 7 |
| Total | 566 | 64 | 94 | 408 |
Illinois Climate Minute: 2018 Recap
Thanks for reading!