Here is a snapshot of conditions across the Midwest for August. The first map shows the actual precipitation, the second the departures from average, and the third shows the temperature departures from average. Overall, the region has been wet with temperatures close to average for August.
For Illinois, the statewide average is 1.8 inches, which is about 20 percent below average. The heaviest amounts of 3 to 5 inches have been just east of St. Louis August. Meanwhile, widespread areas in Missouri, Iowa, Minnesota, Kansas, Nebraska, South Dakota, and Wisconsin, have reported 3 to 6 inches of rain. It has been less wet in the eastern Corn Belt.

Here are the rainfall departures from the 1981-2010 average across the central US. Green means above-average and beige/yellow means below-average. Much of the region is at, or above average. A few dry spots include northeast Iowa and southwest Wisconsin; eastern Ohio, and North Dakota. 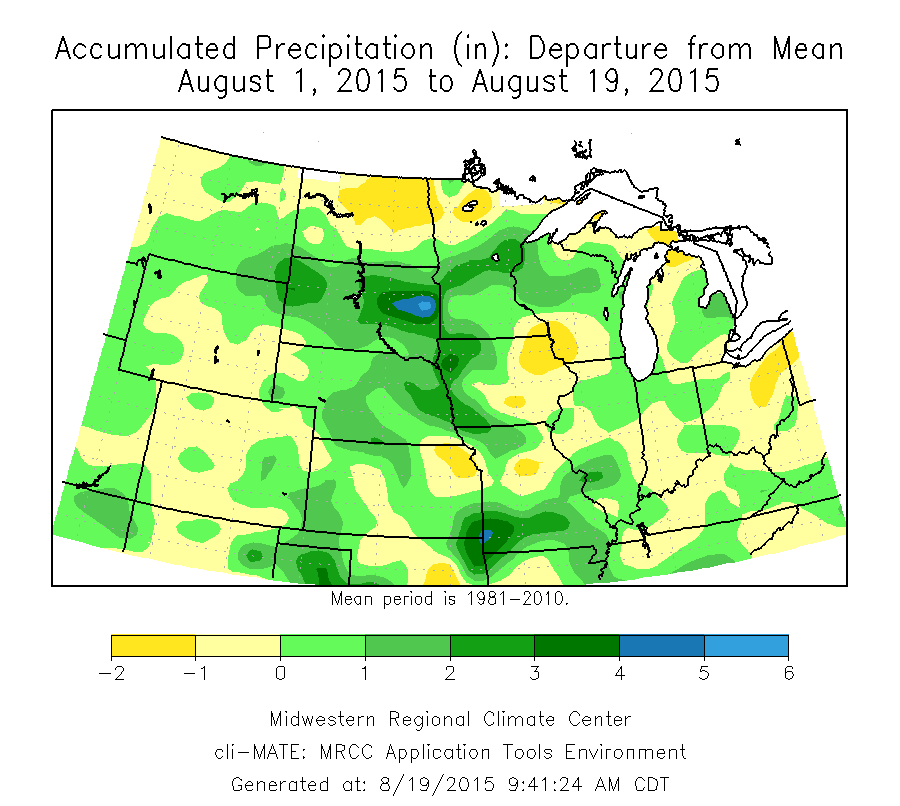
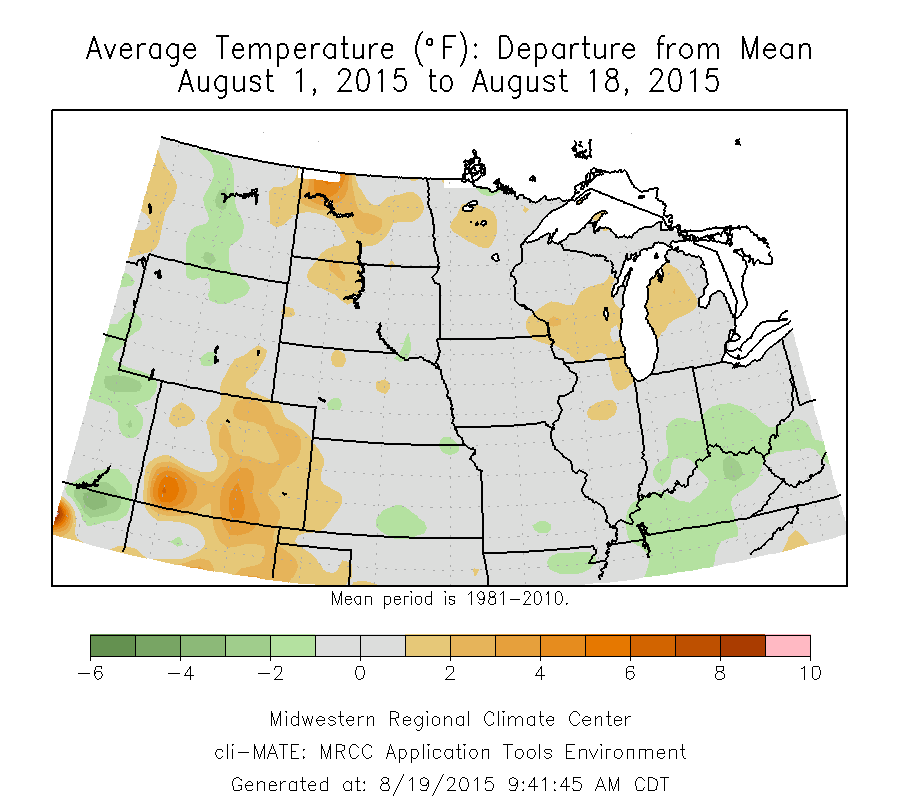
Here are the temperature departures from average for August. Gray (or grey) areas indicate temperatures within a degree of the long-term average. While we have had some hot days, those have been counterbalanced by cooler ones. For Illinois, we are currently running 1 degree above average.