Cold, Snowy November in Illinois

It was a cold and snowy November in Illinois.

  • The statewide average temperature for November was  35.2°F, which is an impressive 7.3°F below normal, ranking November 2018 as the 8th coldest on record.
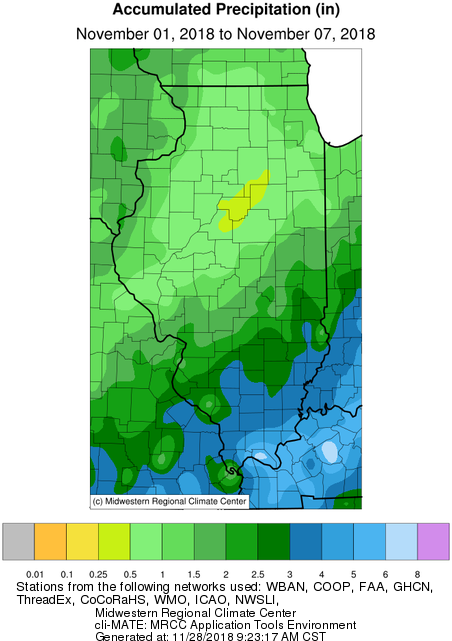
  • The statewide average rainfall for November was 3.11 inches, which is 0.36 inches below normal.
  • The highest temperature recorded for the month was 70°F at a station in Du Quoin on the 1st day of the month.
  • The coldest temperature recorded for the month was a chilly 1°F at three stations in Lee, Carrol, and Knox County on the night of the 28th.
  • The highest monthly rainfall total of 7.50 inches occurred at a station in Belknap, which is located in Massac County.  5.51 inches of the total was recorded during a one-day event on the 1st of the month.
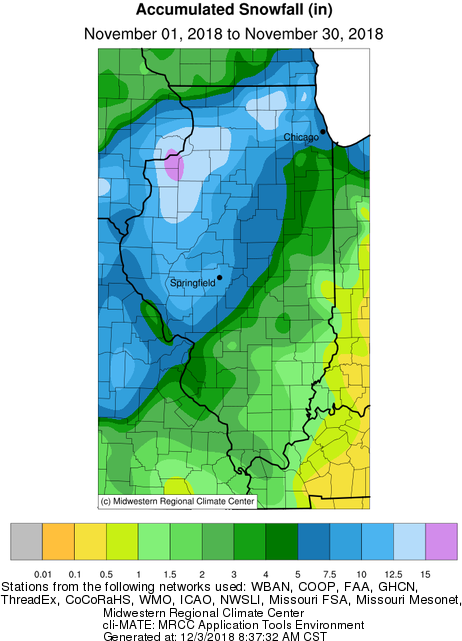
  • The highest monthly snowfall total of 18.5 inches was recorded at a station in Bull Valley, which is located in McHenry County.

Snowfall
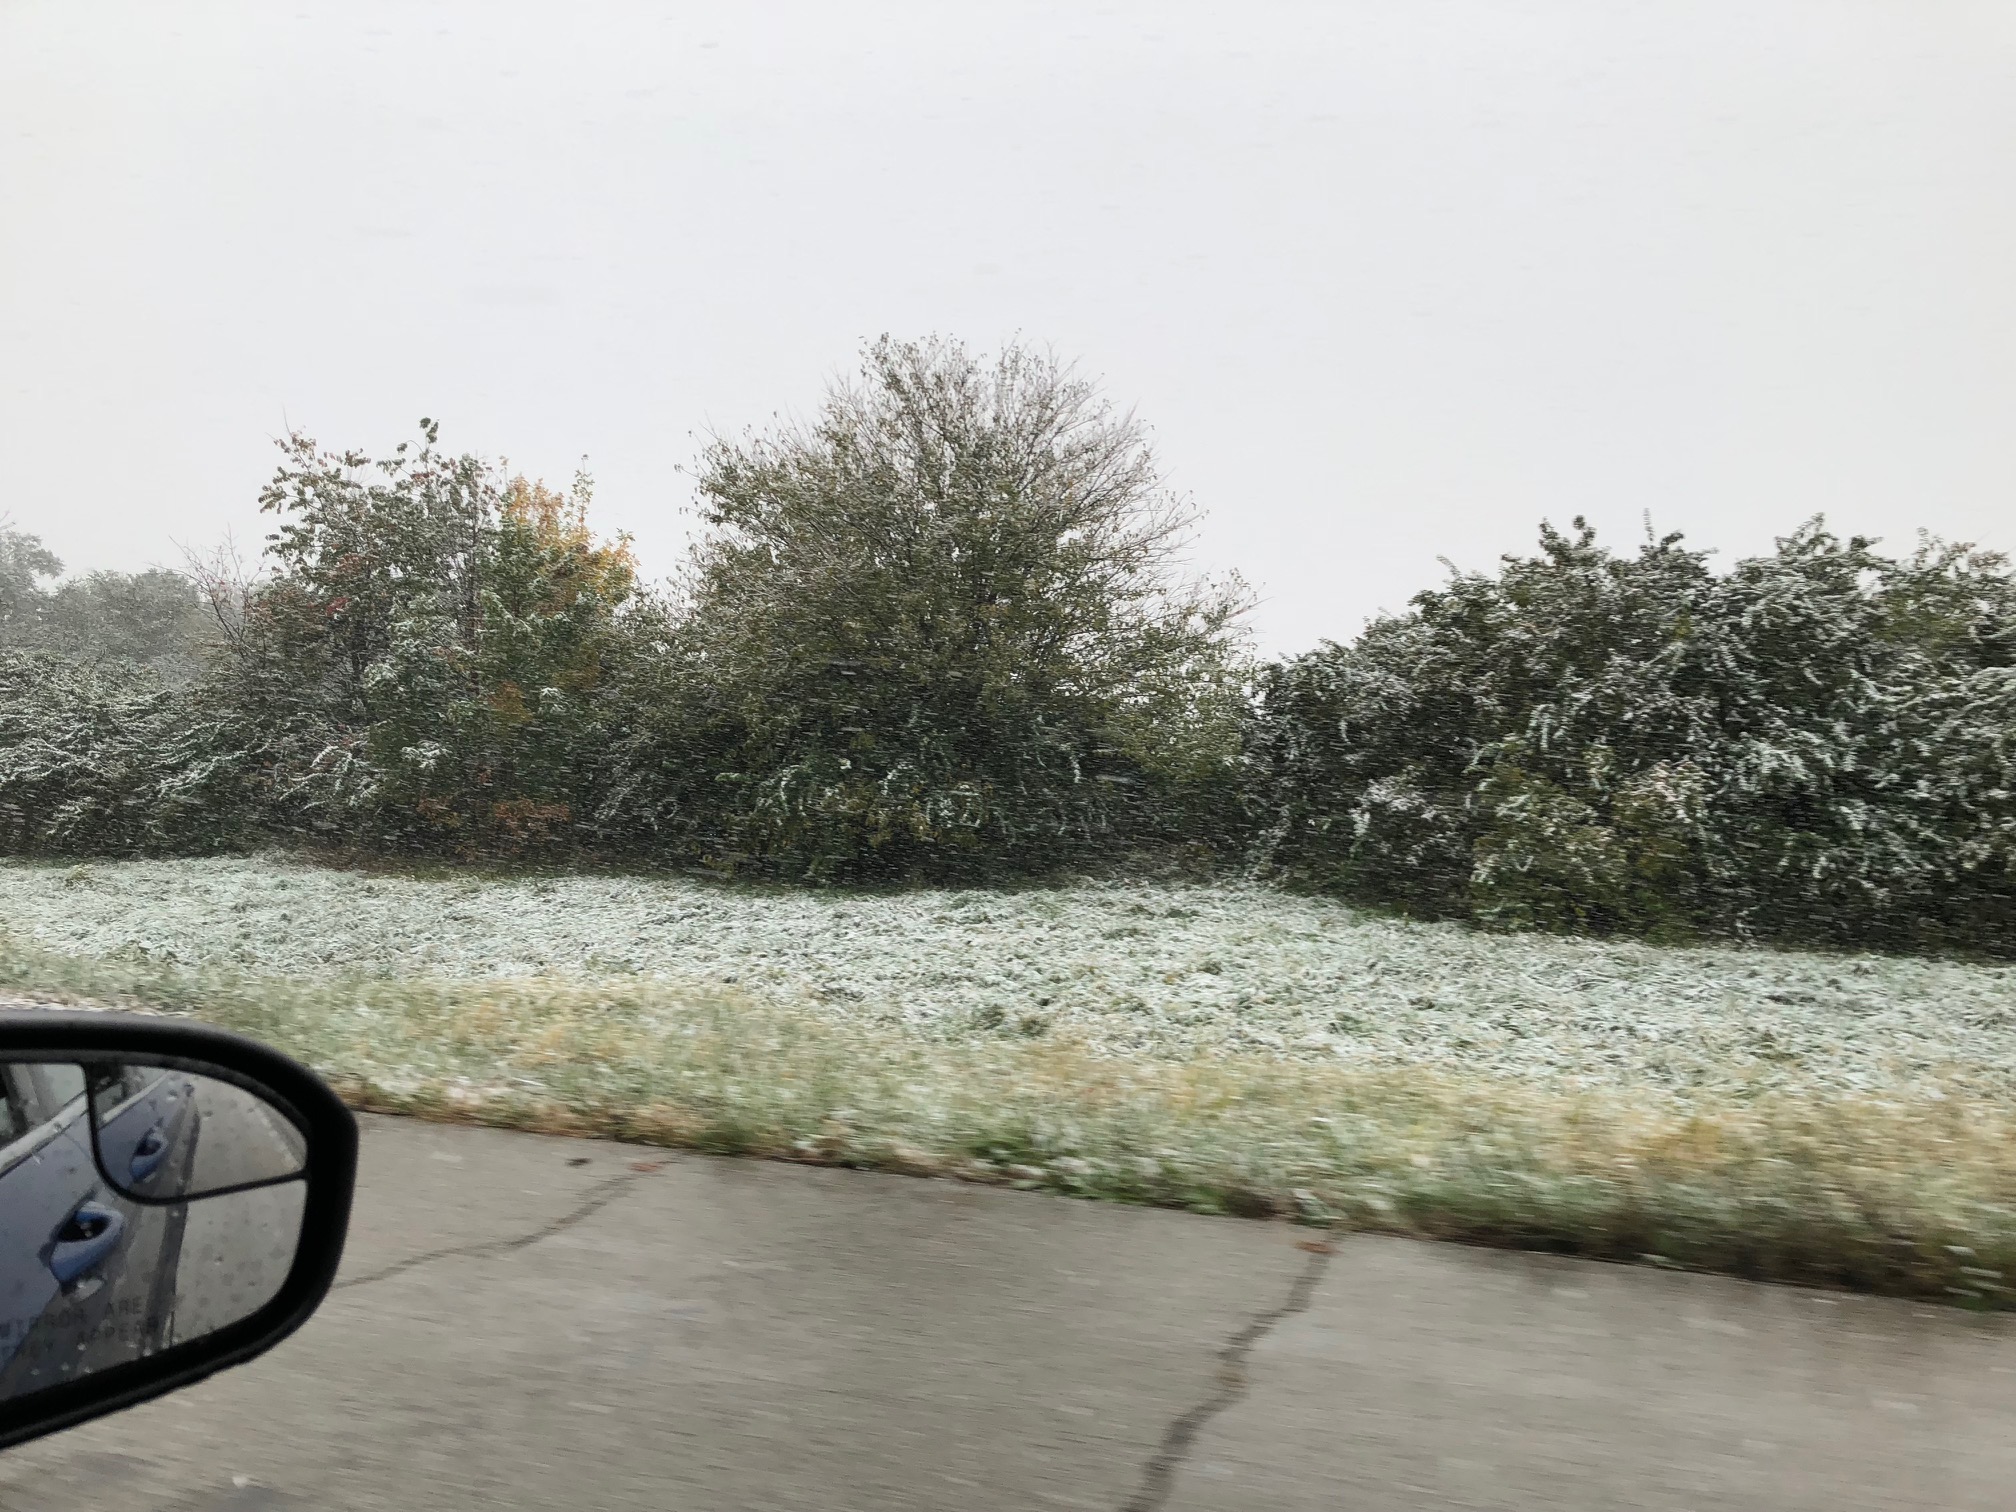
November was an exceptional month for snow lovers statewide, with virtually the entire state seeing it’s first accumulating snow of the season before the month’s end.  In fact by the 15th, with half the month still to go, Springfield Abraham Lincoln Airport had already broken the record for the snowiest November.
Overall monthly snowfall accumulation totals averaged around an inch in southeastern Illinois, up to 15 inches in the northwest, near the Quad Cities, with several locally higher amounts reported.
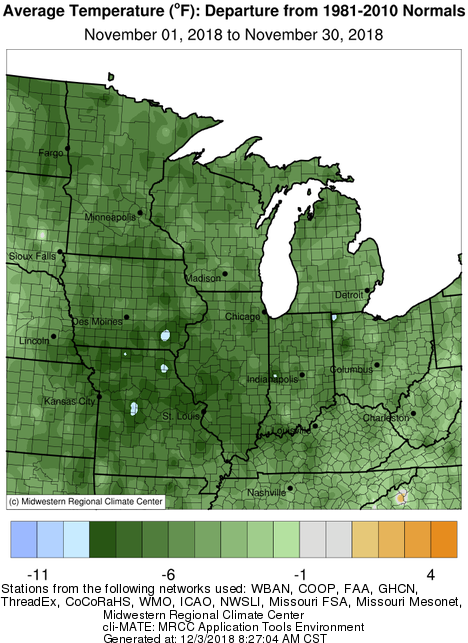
Temperatures

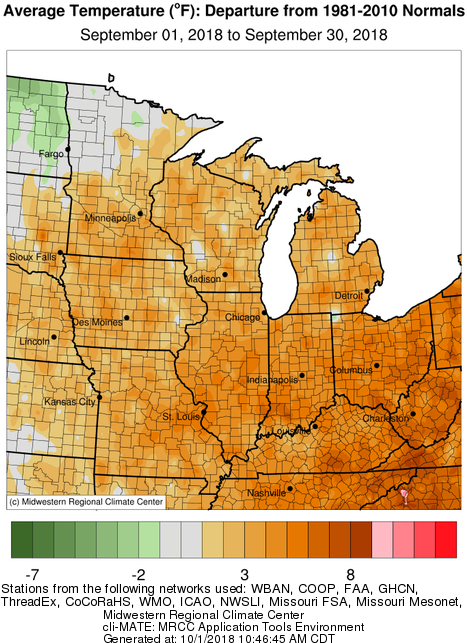
Several outbreaks of unseasonably cold conditions throughout the month helped in bringing the statewide averaged November temperature to a chilly 35.2°F.
Temperatures across Illinois were typically on the order of 5 to 10 degrees below normal, a trend that was felt across most of the Midwest.  The map shows the bullseye for the below normal cold concentrated in sections of northeast Missouri, southeast Iowa, and west-central Illinois.
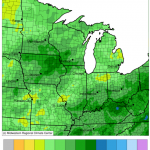
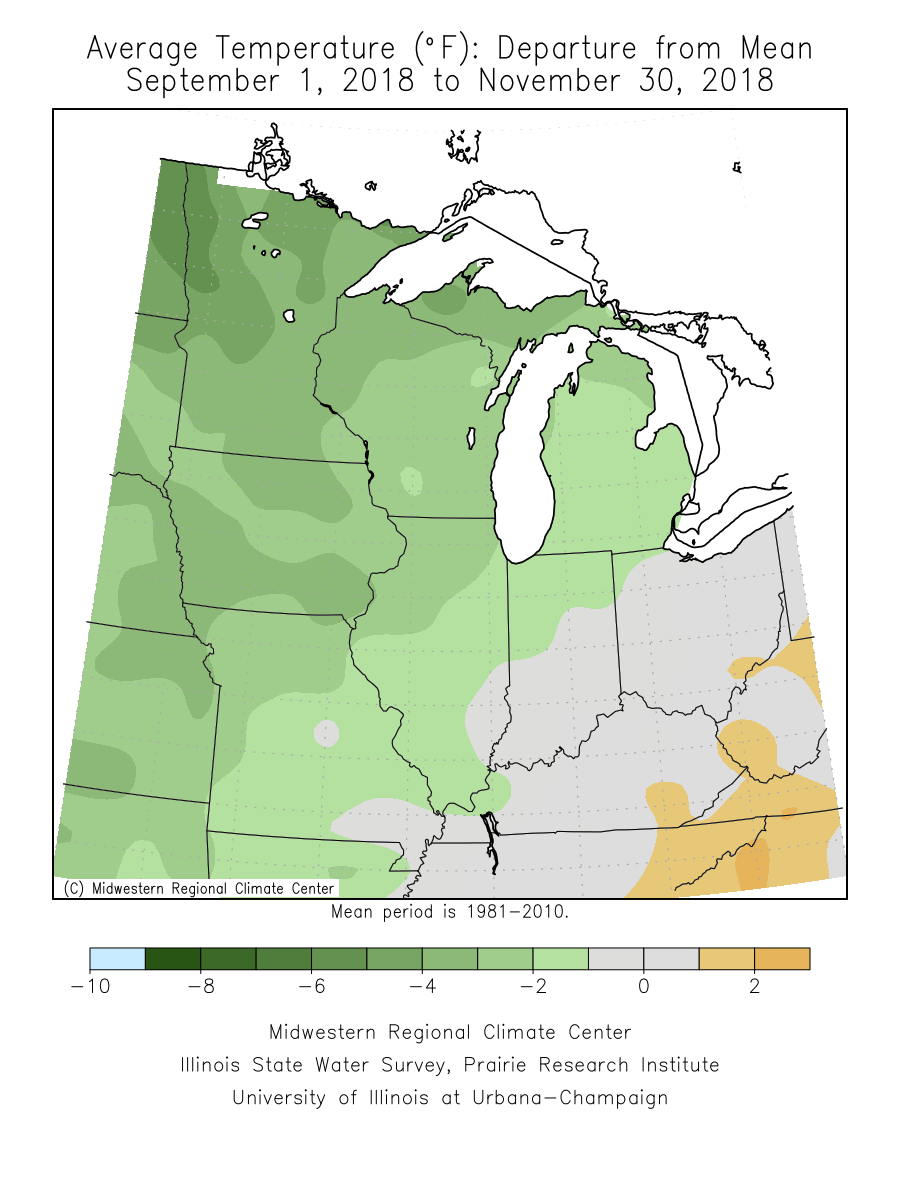
Seasonal Review

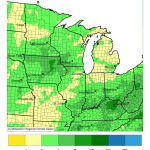
Looking at meteorological Fall (Sept, Oct, Nov), temperatures for the season ended up near normal in southeastern Illinois, and between 2 to 4°F below normal as you head northwest toward Rockford and the Quad Cities (see map).

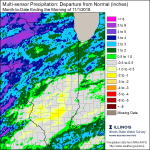
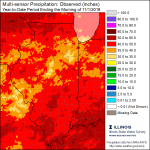
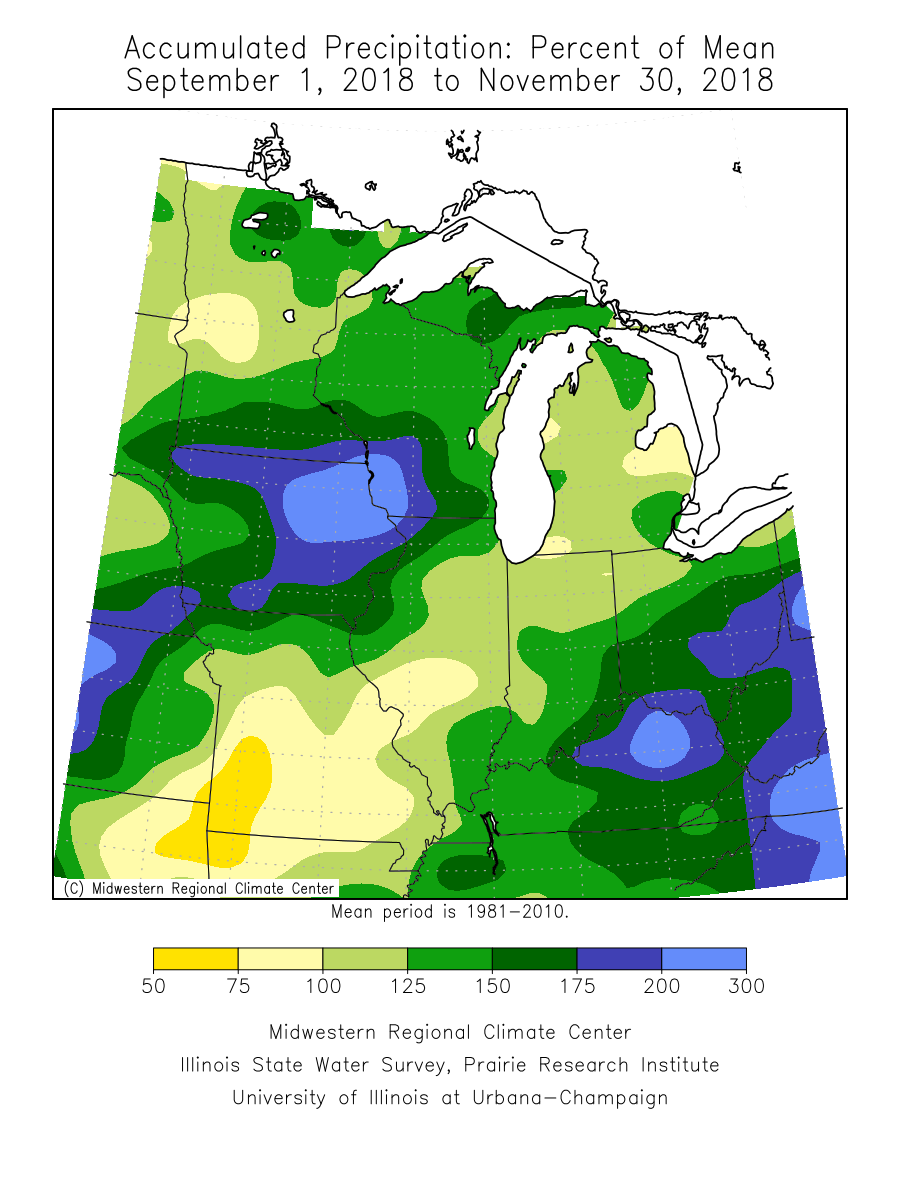
Precipitation for the same period is near normal for the central portion of the state, with above normal totals in the northwest and southeast.  Precipitation totals at Chicago O’Hare and Rockford Airports are currently ranked as the 4th wettest years on record, with a month still to go.
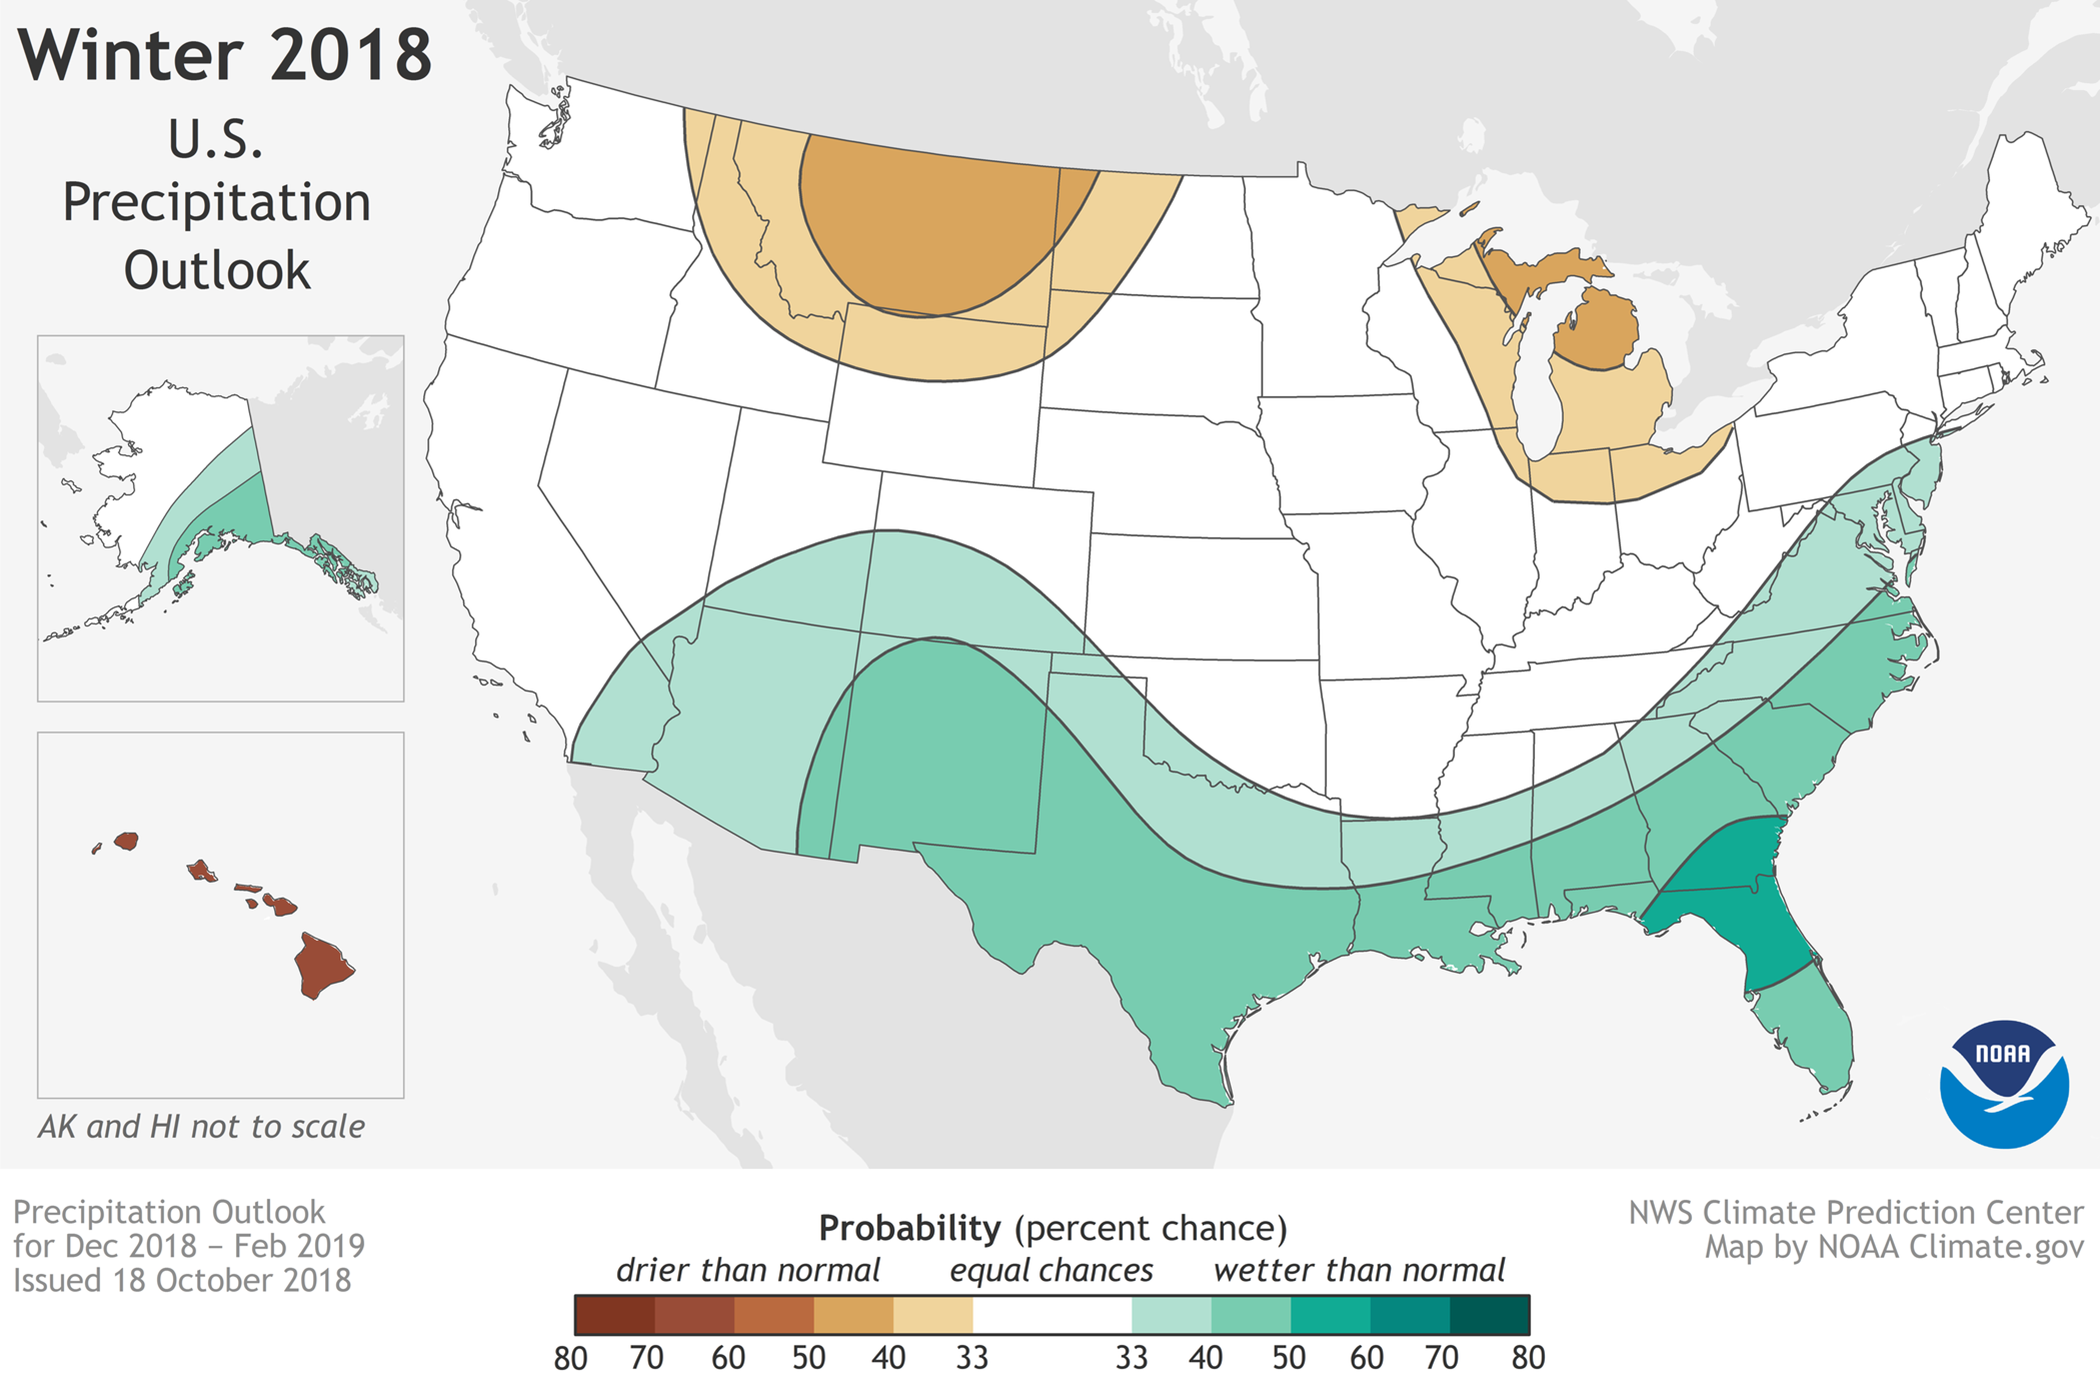
December Outlook

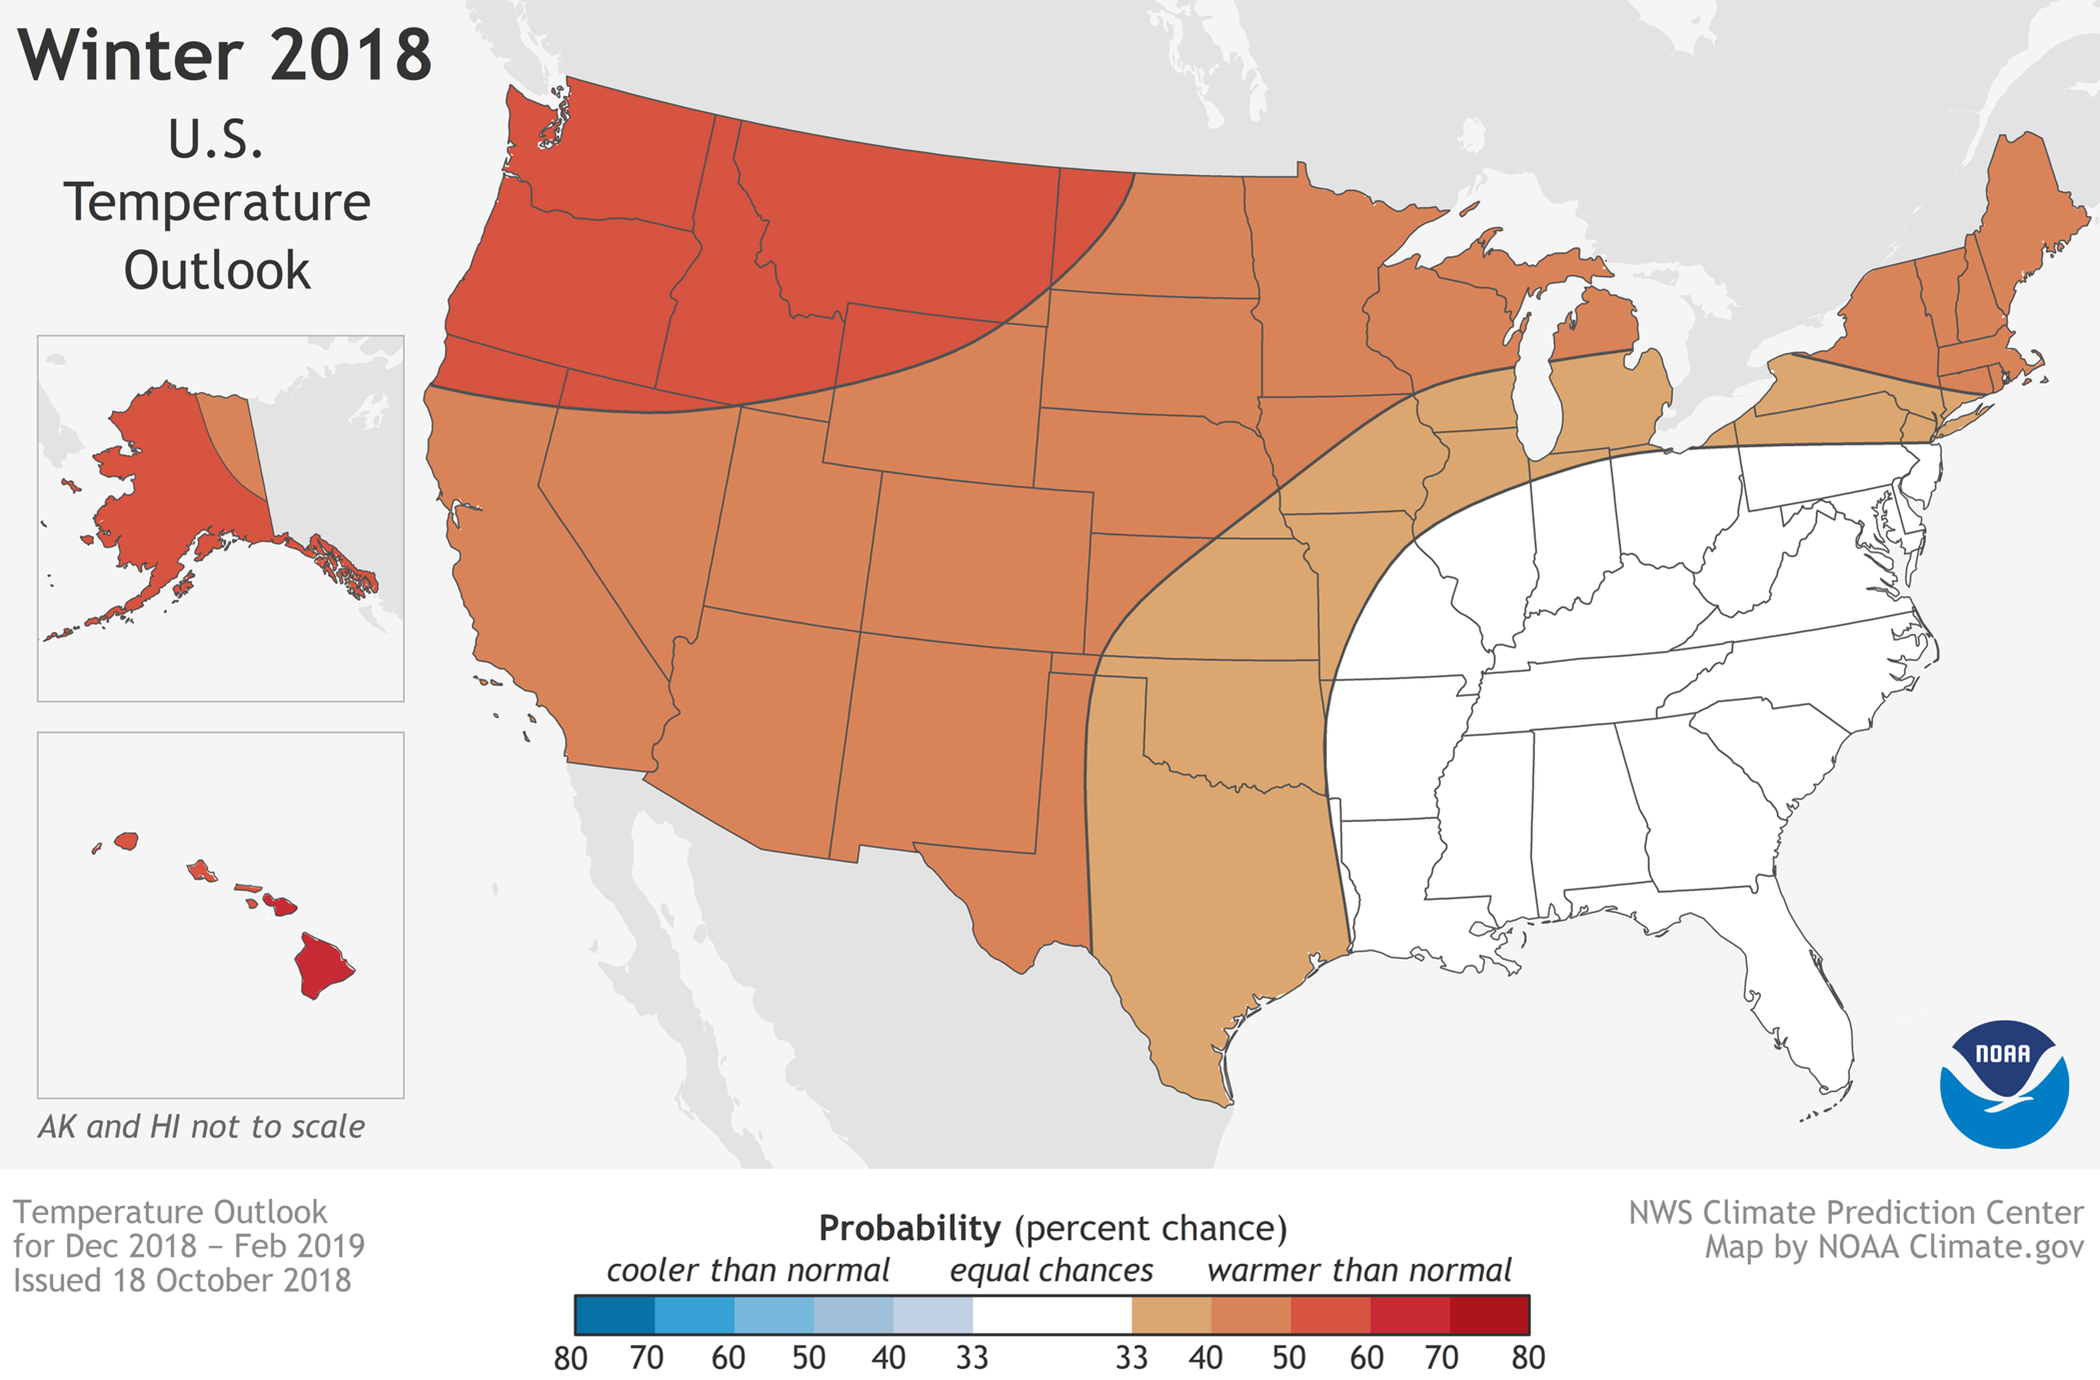
Finally, here is the outlook for December that was released by the National Weather Service (NWS) Climate Prediction Center (CPC) on November 30th.  The precipitation maps show an increased chance of above normal precipitation statewide, becoming more likely as you head westward towards Nebraska.  Temperature wise, there is a slightly increased chance of above normal temperatures statewide, a trend which is noted for much of the eastern half of the country.

Notable November Events:

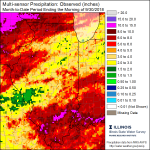
Rainy Start to November for Southern Illinois.

November started with several substantial rain events bringing a half to an inch and a half of precipitation to most of the state, with the largest amounts in southeastern Illinois.  Two CoCoRaHs stations in Massac County, and a COOP station in Pope County recorded over 6 inches of rain during the first week of November.

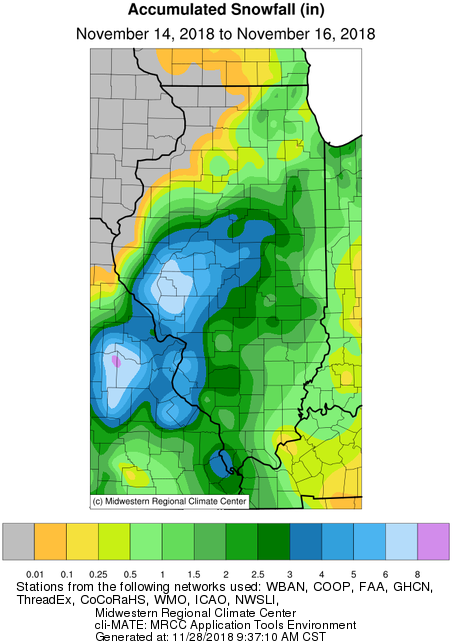
Mid-month Snowstorm and Canadian air outbreak.

An early season plowable snowstorm, accompanied by unseasonably cold temperatures affected much of the state November 14-15th.  As much as a half foot of snow was reported in locations south and west of Springfield.  The official total at Springfield Abraham Lincoln Airport was 5.3 inches. Total monthly snowfall accumulation in Springfield measured 11.4 inches, ranking November 2018 the snowiest November on record.

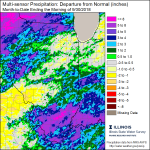
Northern Illinois November Blizzard.

A potent low-pressure system tracked through central Illinois to finish off the Thanksgiving weekend, bringing a wide range of weather to the state.  Thunder, rain, ice, snow, wind, and blizzard conditions were all reported in varying locations on Sunday 11/25/2018.  The map below shows station interpolated snowfall  totals for this event.
Peak wind gusts of 55 mph were reported at Champaign Willard Airport, and 52 mph at Chicago O’Hare.

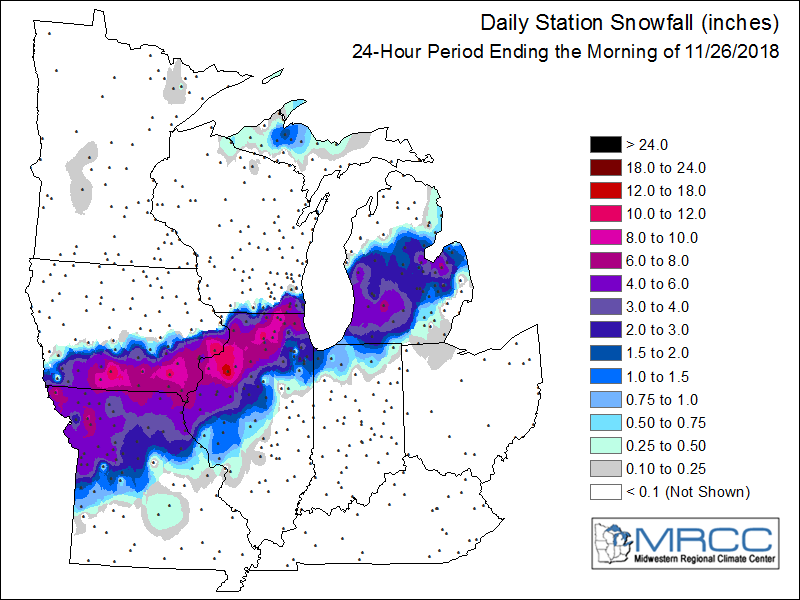
The measured snowfall totals of 11.7 inches at Rockford, and 13.3 inches at Moline, ranks this event as the largest November snowstorm on record for both locations.  The total November accumulated snowfall in Rockford of 15.8 inches, and Moline of 18.4 inches ranks November 2018 as the snowiest November on record for both locations.
A fresh snow pack, coupled with cold air behind this system allowed temperatures to plummet during the start of the last week in November.  Both Moline, and Chicago O’Hare set a record low maximum temperature on 11/27/2018, with recordings of 22°F at Moline and 25°F at O’Hare.
This post was written by Brian Kerschner, who will be taking over the blog next month.

Heat, Frost, Snow, and Rain – Just a Typical October in Illinois

I love the weather in Illinois – hardly ever a dull moment.  This October we experienced days in the 90s, the first fall frost, the first snow of the season, and widespread heavy rains.
The statewide average temperature departure for the first 9 days of October was 11.5 degrees above normal.  There were many reports of temperatures in the 90s during this period, including a high of 94 degrees in Fairfield on October 7.
After the passage of a strong cold front, temperatures dropped and remained much cooler for the rest of the month.  The temperature departure from October 10-31 was 5.7 degrees below normal.   The warm and cold periods balanced out, leaving the statewide average temperature for October at 54.0 degrees, 0.4 degrees below normal.
Freezing temperatures arrived across most of Illinois on October 21st.  The lowest reported reading was 19 degrees at locations near Stockton, Shabbona, and Champaign.  Historically, the average dates for the first fall frost are in October across the state.
The first snow of the season fell on October 12th.  I happened to be driving through it between Kankakee and Champaign (photo below).  There were widespread reports of traces of snow, meaning it melted as it fell. A few areas reported a small amount of accumulation, including Moline and Bloomington with 0.2 inches.  We do not always see snowfall in October in Illinois, but it does show up in the records from time to time.  However, it is not a reliable indicator of the upcoming winter. IMG_2548
Precipitation was widespread across Illinois in October.  The statewide average was 3.81 inches, 0.57 inches above normal.  Amounts of 4 to 7 inches or more were common in the northern half of the state, which is well above normal. Meanwhile, most of the southern half of the state was drier with amounts in the 2 to 4-inch range, which is much closer to normal for October. The largest monthly total was 8.07 inches in Nauvoo (Hancock County).


Another interesting feature of 2018 so far in Illinois has been the impressive precipitation totals in northern Illinois.  Several stations have received over 50 inches of precipitation through October 31, including Elizabeth (Jo Daviess County) with 54.45 inches. That is 22.66 inches above normal! The maps below show the extent of the amounts over 50 inches scattered across the state (darker red), while a relatively drier band stretches from St. Louis to Chicago.


NOAA Outlook for Winter in Illinois

Today, NOAA released the official outlook for winter (December-February).  Not much to report for Illinois.  The northern third of the state has a slightly increased chance of a warmer than normal winter.  And northeastern Illinois has a slightly increased chance of a drier than normal winter. However, the increased odds are very weak and we are on the margins for those areas.  Historically, the core areas with higher odds on the NOAA maps (for example, the Northwest for temperatures) are more like to be proven correct.
Otherwise, the chances are even-Steven across Illinois for the three categories of above, below, and near-average winter temperatures and precipitation.  Maps below.
One of the most important factors for this winter will be the presence and strength of a possible El Niño event. Currently, there is a 70 to 75 percent chance that El Niño will arrive sometime this fall or winter.  El Niño occurs over the central and eastern Pacific Ocean and involves changes in the atmosphere and ocean circulation.  This, in turn, can affect our winter weather in the US.
Right now the official forecast indicates a weak El Niño, hence the anemic odds over Illinois.  If it had been stronger, the odds of a warmer-than-normal winter would be higher for us.  A weaker El Niño event could mean that other factors have a chance to play a bigger role in our winter weather. However, things like the Arctic Oscillation and the related Polar Vortex are much harder to predict more than a few days in advance.
 
1041310417

Above-Normal Temperatures and Rainfall for September in Illinois

Based on preliminary data, Illinois experienced above-normal temperatures and rainfall for September in Illinois.  Here are the statistics for the state:

  • The statewide average temperatures for September was 70.0 degrees, 3.8 degrees above normal and the 12th warmest September on record.  We were on track to one of the warmest Septembers on record until the last cold snap.
  • The statewide average rainfall for September was 4.97″, 1.74″ above normal and the 19th wettest September on record.
  • The hottest temperature recorded for September was 99 degrees at Springfield Airport on September 5.
  • The coldest temperature recorded for September was 30 degrees at Ottawa on September 29.
  • The highest monthly rainfall total for September was 12.43″ at Clay City (just south of Effingham).

Rainfall
Here are the rainfall totals (left) and departures from normal (right) for September in Illinois (click to enlarge).  Rainfall was heaviest in southern Illinois with amounts up to 12 inches and in northwestern and western Illinois with amounts up to 10 inches – all well above normal.  There was a band of drier conditions stretching from St. Louis to Chicago where rainfall totals of 1 to 3 inches were common.


In addition, heavy rains fell across the upper Midwest in September (maps below, click to enlarge).  The rains were especially heavy in Wisconsin, Iowa, and Minnesota, leading to river flooding in Illinois along the Mississippi and rivers coming out of Wisconsin

Temperatures
Temperatures across the Midwest were much above normal in September (map below with pumpkin spice-colored shading – appropriate for this time of year).  While Illinois was 3.8 degrees above normal, Indiana was 4.5 degrees above normal, Kentucky was 5.0 degrees above normal, and Ohio was 5.5 degrees above normal.  The other states were 1 to 3 degrees above normal for the month.
september-temp-depart
Outlook for October
Finally, here is the outlook for October that was released by the NWS on September 30.  These rely heavily on the more reliable forecasts out to 14 days.  Those forecasts show Illinois with very strong chances for above-normal temperatures and rainfall. As a result, the October outlook also shows most of Illinois with an increased chance of above-normal temperatures and all of Illinois with an increased chance of above-normal temperatures.
On a side note, the 4-corners region (UT, CO, AZ, and NM) are in a severe drought and the expected rainfall will be welcomed there.  The same cannot be said for the Upper Midwest, which was already very wet in September.

See the page on normals for more on this topic.