2016 Midwest Warmer and Drier Than Average

Despite a few cold and snowy days, the Midwest was been both warmer and drier than average for 2016. As this map shows, most of the Midwest has has seen less than 2 inches of precipitation since January 1. That includes any rainfall plus the water content of snowfall. Areas in orange have received 1 to 2 inches, and areas in red have received less than an inch.

map1

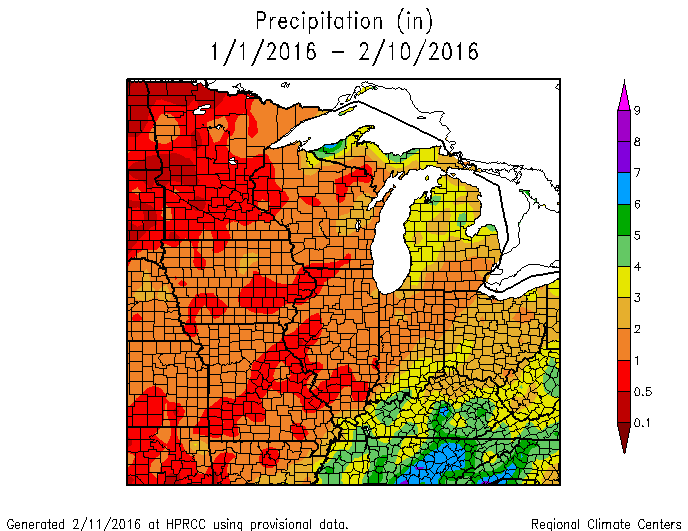
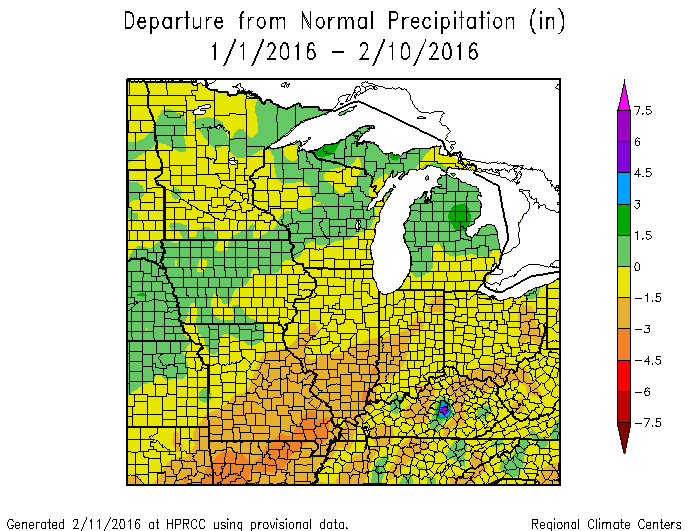
However, this is the driest time of the year for most of the Midwest. As a result, precipitation is slightly above average in a swath across Iowa, Wisconsin, and Michigan, thanks to several winter storms. However, the southern half of the Midwest is down 1 to 3 inches. Of course, this same area received much-above-average precipitation in December thanks to the late December storm. As a result, the drier weather may be welcome news for many in that area.

map2

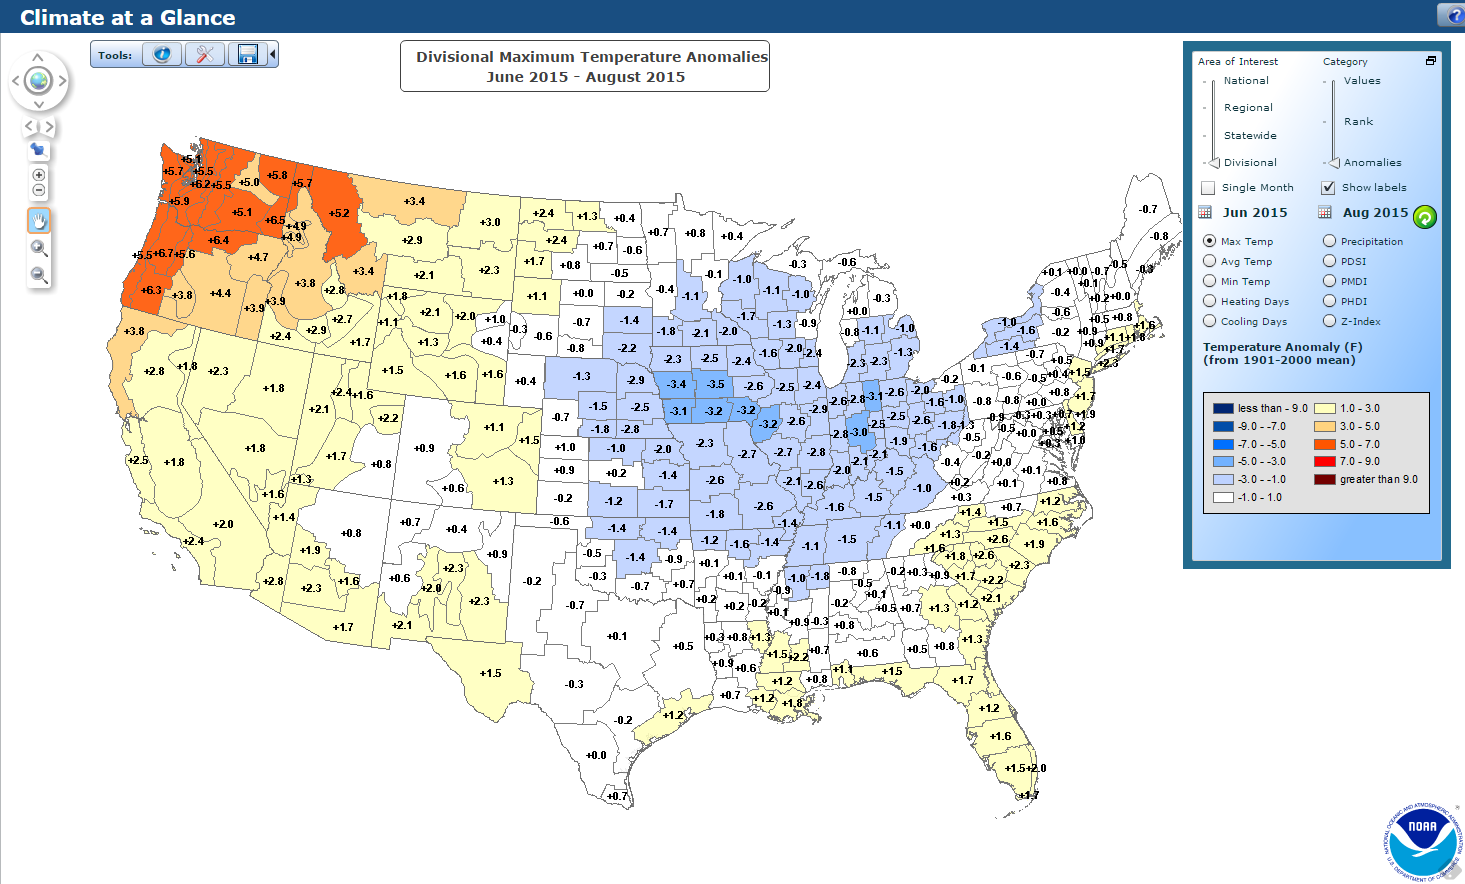
Despite a few days of cold weather in recent weeks and the chilly forecast for this weekend, temperatures since January 1 have been running above average across the Midwest. This map shows the temperature departures for 2016. Minnesota, Wisconsin, and Michigan, as well as northern Indiana and Ohio, are running 2 to 4 degrees above average. The rest of the Midwest is running up to 2 degrees above average. Meanwhile, colder-than-average conditions have prevailed in Kentucky and Tennessee.

map3

Cooler Days and Warmer Nights This Summer in Midwest

Cooler than average daytime highs (first map, blue shaded areas) and warmer than average night-time lows (second map) this summer were common across much of the Midwest, according to data from the National Centers for Environmental Information.

It is typical in Illinois for this to happen in summer after a wet spring. We marched through summer with above-average soil moisture, streamflows, and lake levels. As a result, more of the sun’s energy went into evaporating this water instead of heating up the land surface and the atmosphere. The end results were higher humidity levels and lower high temperatures.

At night, the higher humidity levels kept temperatures from dropping as much. The old forecasting rule of thumb was to consider the dew-point temperature as the floor to night-time temperatures. Therefore, the higher dew-point temperatures led to higher night-time temperatures.*

Finally, all the extra humidity in the atmosphere turned into more rainfall for thunderstorms, maintaining the wetter conditions through at least July.

summer-max-map
Click to enlarge. Cooler than average daytime high temperatures this summer across the Midwest. Source: National Centers for Environmental Information (NCEI).

Continue reading “Cooler Days and Warmer Nights This Summer in Midwest”

Rainfall and Temperatures Across the Midwest in August

Here is a snapshot of conditions across the Midwest for August. The first map shows the actual precipitation, the second the departures from average, and the third shows the temperature departures from average. Overall, the region has been wet with temperatures close to average for August.

For Illinois, the statewide average  is 1.8 inches, which is about 20 percent below average. The heaviest amounts of 3 to 5 inches have been just east of St. Louis August. Meanwhile, widespread areas in Missouri, Iowa, Minnesota, Kansas, Nebraska, South Dakota, and Wisconsin, have reported 3 to 6 inches of rain. It has been less wet in the eastern Corn Belt.

map1

Continue reading “Rainfall and Temperatures Across the Midwest in August”

Wet Weather Ahead for Illinois

Here is the Qualitative Precipitation Forecast (QPF) for the next 7 days, according to the National Weather Service. This shows the potential amounts of rainfall, your mileage may vary. The area in shades of violet and purple are 1.5 to 2.5 inches. Shades of blue are 1 to 1.5 inches. Most of this is expected to fall in the next 3 days.

map2

Here is how much rain has fallen so far in May across the Midwest.

map1