Based on preliminary numbers, the statewide average precipitation for June 2013 in Illinois was 5.19 inches. That was 0.99 inches above the 1981-2010 average. It was more than double the June 2012 total of 1.80 inches.
In the first map below, the two wettest areas in Illinois were in northern Illinois and an area just to the south of Interstate 70. The area in northern Illinois was part of a larger area of heavy amounts in northeastern Iowa and southern Wisconsin. The area in southern Illinois extended into southern Indiana and Kentucky. Both regions had rainfall totals in excess of 8 inches and even 10 or more inches in the red and purple areas.
By contrast, much of the rest of the state was close to average precipitation for June with 3 to 6 inches very common (shades of green on the map). The few areas in blue (representing less than 3 inches) in western and north central Illinois are not alarming yet because they followed a wet spring. In fact, much of the Midwest experienced a wet June, including the Ohio River Valley which experienced drier conditions early in the month.
The second map zooms in on Illinois and shows the departures from average for June. The wet areas in northern and south-central Illinois stand out with rainfall totals 3 to 5 inches above average. Areas in central and southwestern Illinois were below average.


The year to date (January-June) statewide precipitation for Illinois was 28.74. That was 8.91 inches above the 1981-2010 average and the wettest January-June on record. The statewide records go back to 1895. It is more than double the 12.67 inches accumulate in January-June of 2012 during the height of the drought.
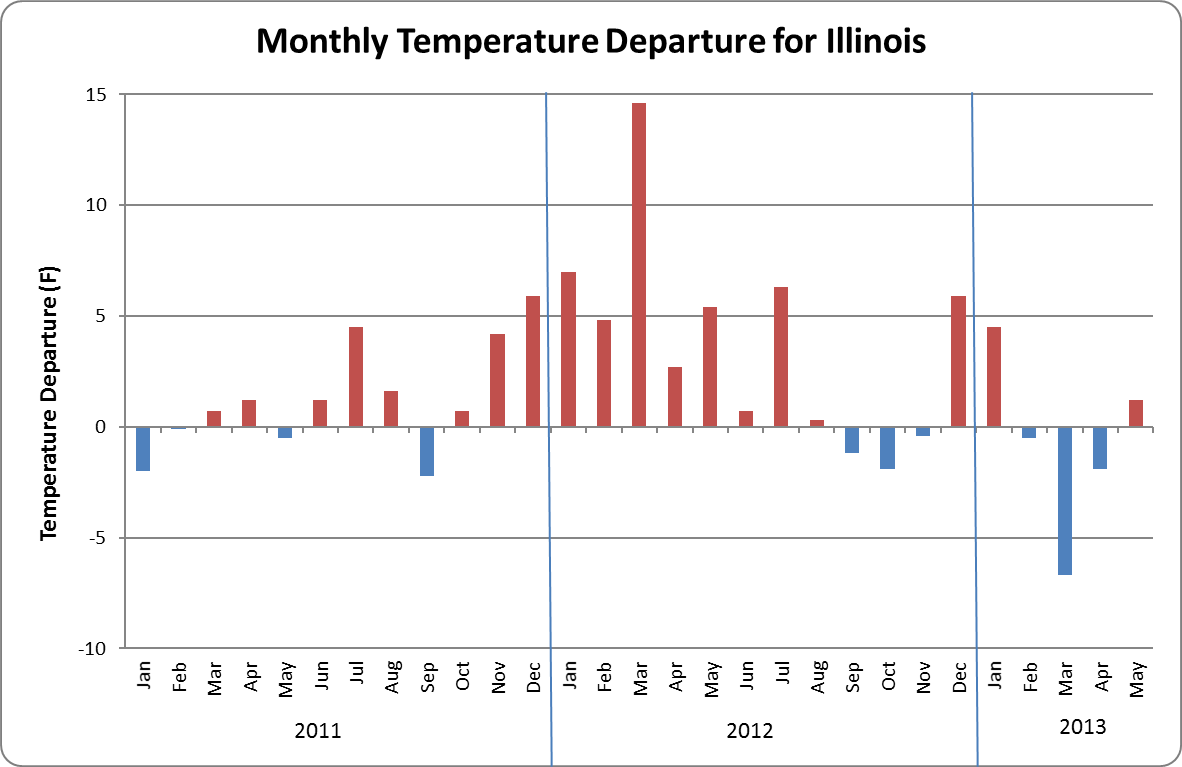
The statewide average temperature was 71.5 degrees, which was 0.3 degrees below the 1981-2010 average.
Wettest Locations In Illinois in June
| FLORA | 12.63 |
| BELLEVILLE SCOTT AFB | 12.34 |
| BELLEVILLE SIU RSRCH | 10.97 |
| CARY 0.3 NE | 10.72 |
| BROOKPORT DAM 52 | 10.37 |
| CENTREVILLE 1.9 E | 10.33 |
| STEWARD 3S | 9.78 |
| MCHENRY STRATTON L&D | 9.69 |
| TROY 1.4 SE | 9.68 |
| CARY 1.9 NE | 9.62 |
| YORKVILLE 3 SW | 9.5 |
| BELLEVILLE 4.5 WNW | 9.35 |
| HIDALGO 3SW | 9.3 |
| CLAY CITY 6 SSE | 9.16 |
| PALESTINE 2W | 9.02 |
| GREENVILLE | 9.01 |
| WHITE HEATH 3.7 NNE | 8.99 |
| CAPRON 0.1 N | 8.79 |
| LAWRENCEVILLE RIVER | 8.76 |
| AVISTON 0.4 NW | 8.73 |
| OLNEY 2S | 8.7 |
| BELLEVILLE 2.2 SE | 8.67 |
| ROSCOE 2 SE | 8.66 |
| ROCKFORD 3.3 NE | 8.54 |
| BELVIDERE | 8.5 |
| CHAMPAIGN 9 SW | 8.49 |
| KINMUNDY | 8.46 |
| WOODSTOCK 0.7 SW | 8.44 |
| BELKNAP 11.1 ESE | 8.42 |
| MASCOUTAH 0.5 WSW | 8.39 |
| EDWARDSVILLE 0.9 WSW | 8.32 |
| HAWTHORN WOODS 0.6 N | 8.3 |
| SALEM | 8.27 |
| GRANITE CITY 1.4 ENE | 8.26 |
| ATWOOD 0.4 N | 8.24 |
| SHERIDAN 0.1 SSW | 8.23 |
| ROBINSON | 8.21 |
| WONDER LAKE 0.8 WNW | 8.17 |
| HARVARD | 8.16 |
| ALBERS 1 W | 8.16 |
| HIGHLAND | 8.11 |
| ROCKFORD 0.7 NW | 8.09 |
| PALATINE 1.3 E | 8.07 |
| ORANGEVILLE 2.8 NW | 8.04 |
| ALGONQUIN 0.7 N | 7.98 |
| CASEY | 7.87 |
| PARK RIDGE 0.7 WNW | 7.87 |
| CARLYLE RSVR | 7.82 |
| HARRISBURG 4.6 NNE | 7.77 |
| ELIZABETH | 7.76 |
| ROCKFORD GTR ROCKFORD AP | 7.72 |
| SHABBONA 5 NNE | 7.72 |
| CHARLESTON | 7.64 |
| OKAWVILLE 2.3 SW | 7.58 |
| MATTOON | 7.52 |
| CHARLESTON 1.0 S | 7.51 |
| FREEPORT WWP | 7.5 |
| SPRING GROVE | 7.5 |
| EDWARDSVILLE 2 W | 7.43 |
| MARSEILLES LOCK | 7.42 |
| DE KALB | 7.38 |
| SMITHLAND L&D | 7.36 |
| STOCKTON 3 NNE | 7.35 |
| DE KALB 1.4 W | 7.35 |
| DIXON 1.5 SW | 7.33 |
| VANDALIA | 7.33 |
| PECATONICA 2.3 S | 7.32 |
| ARLINGTON HEIGHTS 1.2 SW | 7.29 |
| MANSFIELD 3.0 WSW | 7.29 |
| WINSLOW 4.3 ESE | 7.29 |
| MARENGO | 7.28 |
| SHABBONA 3S | 7.23 |
| DUNLAP 2.6 NE | 7.21 |
| CHARLESTON 0.9 S | 7.2 |
| FARMER CITY 3W | 7.19 |
| TUSCOLA | 7.18 |
| WOODSTOCK 5 NW | 7.17 |
| WINDSOR | 7.09 |
| BUFFALO GROVE 1.5 N | 7.07 |
| DAVIS 0.5 N | 7.04 |
| BARRINGTON 3 SW | 6.99 |
| ARLINGTON HEIGHTS 1.8 NNW | 6.98 |
| ROCKTON 1.0 ESE | 6.97 |
| LINCOLNSHIRE 1.3 WSW | 6.96 |
| ST. FRANCISVILLE 2.3 NNW | 6.96 |
| EARLVILLE 3 S | 6.96 |
| MARSHALL 4.6 W | 6.89 |
| PAW PAW | 6.85 |
| CHAMPAIGN 3.6 W | 6.83 |
| CENTRALIA | 6.82 |
| WATSON 0.3 NE | 6.81 |
| PEORIA 3.4 WNW | 6.8 |
| ROCKFORD 1.5 ENE | 6.79 |
| EFFINGHAM SE | 6.74 |
| NEW MILLFORD 3.3 W | 6.74 |
| CHAMPAIGN 2.3 NNW | 6.7 |
| IUKA | 6.69 |
| LAWRENCEVILLE 1.4 W | 6.68 |
| BULL VALLEY 2.5 WNW | 6.67 |
| MONTGOMERY 1.7 SSE | 6.65 |
| GALENA | 6.63 |
| MT OLIVE 1 E | 6.63 |
| CHAMPAIGN 2.5 WNW | 6.59 |
| CHAMPAIGN 0.3 ESE | 6.55 |
| CHAMPAIGN 3.5 SSE | 6.54 |
| TRIMBLE 1E | 6.52 |
| WINNETKA 0.8 ESE | 6.52 |
| SHERIDAN 3.4 SSE | 6.51 |
| ASHTON 0.4 SSW | 6.51 |
| NEOGA | 6.5 |
| FREEPORT 2.0 NW | 6.5 |
| ST ANNE | 6.47 |
| MENDOTA 2 SE | 6.45 |
| GALENA 5.7 E | 6.43 |
| CAIRO RIVER | 6.37 |
| YORKVILLE 1.1 W | 6.33 |
| TUSCOLA 1.4 NNE | 6.25 |
| CAIRO 3 N | 6.24 |
| CHICAGO OHARE INTL AP | 6.23 |
| RIVERWOODS 0.4 ENE | 6.23 |
| NEOGA 4NW | 6.22 |
| RED BUD 5 SE | 6.22 |
| LISBON 4.4 NE | 6.22 |
| MATTOON 1.3 W | 6.21 |
| URBANA | 6.2 |
| BYRON 3.2 N | 6.2 |
| MONTGOMERY 0.8 SSE | 6.2 |
| LAKEMOOR 1.5 SE | 6.19 |
| MOLINE QUAD CITY INTL AP | 6.14 |
| AMBOY | 6.06 |
| MUNDELEIN 4 WSW | 6.05 |
| AURORA | 6.04 |
| GRAND CHAIN DAM 53 | 6.03 |
| HAVANA | 6.03 |
| BANNOCKBURN 0.5 ESE | 5.99 |
| FISHER | 5.98 |
| DIXON 3.0 NNW | 5.95 |
| CHICAGO BOTANICAL GARDEN | 5.94 |
| CHICAGO 5.5 ESE | 5.93 |
| LINCOLNSHIRE 0.9 N | 5.92 |
| ASHLEY 1.4 NNE | 5.89 |
| PLAINFIELD 2.4 SSE | 5.88 |
| KANKAKEE METRO WWTP | 5.88 |
| SAVOY 0.9 N | 5.86 |
| MT CARROLL | 5.83 |
| CHANNAHON DRESDEN ISLAND | 5.81 |
| LINCOLNWOOD 1.8 E | 5.8 |
| EVANSTON 1.2 SSE | 5.78 |
| PETERSBURG 7.5 W | 5.73 |
| MORRIS | 5.71 |
| NEW ATHENS | 5.71 |
| CHANNAHON 0.8 NNE | 5.7 |
| ROANOKE | 5.69 |
| VILLA GROVE 0.6 ESE | 5.69 |
| MARSEILLES 2.8 NW | 5.68 |
| MOUNT OLIVE 0.4 S | 5.65 |
| MARSEILLES 5.6 WNW | 5.64 |
| GLENCOE 0.1 NW | 5.63 |
| MORRIS 4.8 NNW | 5.62 |
| NASHVILLE 1 E | 5.6 |
| PEOTONE 0.4 ENE | 5.6 |
| BROADLANDS 0.1 SSW | 5.55 |
| BUFFALO | 5.54 |
| PLAINFIELD 1.1 SW | 5.53 |
| GIRARD 1.2 W | 5.49 |
| SHAWNEETOWN OLD TOWN | 5.47 |
| SIDNEY 0.9 N | 5.46 |
| HARWOOD HEIGHTS 1.9 NNE | 5.46 |
| URBANA 1.8 N | 5.45 |
| FAIRFIELD RADIO WFIW | 5.43 |
| PLAINFIELD 4.8 SW | 5.43 |
| KEWANEE 1 E | 5.42 |
| COLETA 1.4 SSW | 5.42 |
| HARDIN | 5.41 |
| CHESTER | 5.41 |
| LE ROY 4.1 SSW | 5.41 |
| RIPLEY | 5.4 |
| EMDEN 2.4 SW | 5.36 |
| MONTICELLO 3.5 NNE | 5.36 |
| OSWEGO 5.0 SSE | 5.35 |
| PEORIA 5NW | 5.35 |
| KANKAKEE 3.2 SE | 5.35 |
| SPARLAND 6 SW | 5.33 |
| CHADWICK 2.7 WSW | 5.32 |
| SUGAR GROVE 1.4 ENE | 5.3 |
| RANTOUL | 5.3 |
| EFFINGHAM | 5.23 |
| DECATUR | 5.22 |
| AURORA 3.8 SE | 5.21 |
| MILFORD 5 NW | 5.19 |
| AMBOY 0.5 ESE | 5.18 |
| ROCHELLE | 5.18 |
| LONDON MILLS 1 SW | 5.16 |
| SPARTA 1.9 SSW | 5.16 |
| KASKASKIA RIV NAV LO | 5.15 |
| AURORA 3.4 W | 5.14 |
| PEOTONE 0.5 ENE | 5.13 |
| CHAMPAIGN 0.7 SW | 5.12 |
| PHILO 1.9 ENE | 5.11 |
| PLAINFIELD 3 NE | 5.1 |
| MINOOKA 0.3 NE | 5.06 |
| CISCO | 5.05 |
| AURORA 3.6 SE | 5.05 |
| ELK GROVE VILLAGE 0.6 ESE | 5.04 |
| CHANNAHON 2.5 SSE | 5.03 |
| MENDOTA 2.4 SE | 5.02 |
| PEOTONE 0.5 SE | 5.02 |
| JACKSONVILLE 2 | 5.01 |
| MONEE RSVR | 5 |