October Was Warm and Dry in Illinois

Precipitation

For Illinois, the statewide average rainfall for October was 1.4 inches, 1.5 inches below normal or 48 percent of normal. This ranks as the 20th driest October on record. The largest monthly rainfall total was reported at Belvidere with 3.94 inches. See map below for rainfall departures across the state.
While northern Illinois was close to normal on rainfall in October, parts of southern and eastern Illinois remained dry. The U.S. Drought Monitor lists those areas as “abnormally dry” and southeastern Illinois as”moderate drought”. At this time of year, the main impacts on agriculture would be on pasture conditions and winter wheat.

Soil Moisture

With the vegetation preparing for a long winter’s nap and lower temperatures, the demands on soil moisture are close to zero. So soil moisture should start to recover in the next few months even if precipitation remains below normal. The Illinois State Water Survey posts their latest soil moisture survey a few days after the end of the month here.

Temperature

The statewide average temperature for October was 56.2 degrees, 1.6 degrees above normal. The highest temperature for the month was reported at Fairfield with 93 degrees on October 10. The lowest temperature for the month was reported at Minonk with 22 degrees on October 29 and Sidell with 22 degrees on October 30.

Frost

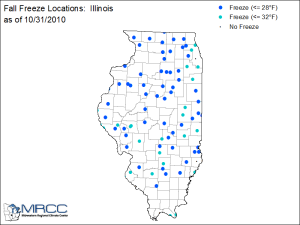
During October, nearly all of Illinois has experienced temperatures down to 32 degrees and many areas have reached 28 degrees or less. See map below.

Figures
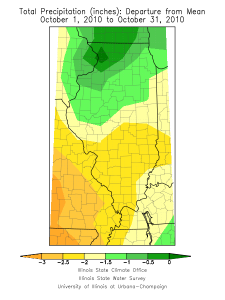
 

October rainfall Illinois
October rainfall departures from normal.

freeze Illinois
Occurrence of Frost (32F) and Freeze (28F) in Illinois at end of October 2010.


All data are preliminary.

Winter Outlook for Illinois – Wetter and Warmer

NOAA’s Climate Prediction Center released their official winter outlook today. The major influence in this winter’s weather will be the moderate to strong La Niña event occurring in the Pacific Ocean.

Precipitation

The winter outlook calls for an increased chance of above-normal precipitation across Illinois. They also state that the Ohio River Valley (including Illinois) is … “likely to see increased storminess and flooding.” Other studies have shown an increase in snowfall in the Great Lakes region during past La Niña events, especially in the January-March period.

Temperature

The southern two-thirds of the state has an increased chance of above-normal temperature. Meanwhile the northern third of Illinois has “equal chances” of above-, below-, or normal temperatures.  This basically means that their forecast tools are providing no guidance on winter temperatures in northern Illinois, including the Chicago area.
 

Winter outlook for precipitation (NOAA)
NOAA Winter Outlook for Precipitation.


winter outlook for temperature (NOAA)
NOAA Winter Outlook for Temperature


September Climate Summary

Illinois experienced temperatures close to normal for September. The statewide average temperature was 66.8 degrees, just 0.6 degrees above normal.
During the month, many stations in southern Illinois had reported high temperatures in the mid to upper 90s. Fairfield and Grayville both reported the highest temperatures in the state with 99 degrees on September 21 and 22, respectively.
The statewide average precipitation was 4.0 inches, 0.8 inches above normal. However, the rainfall  was unevenly distributed throughout the state. The largest rainfall totals for the month occurred across west-central Illinois. Quincy Lock and Dam 21 reported 8.10 inches, the most rainfall in the state. This was followed closely by Springfield with 7.94 inches.
Meanwhile, far southern Illinois continued to struggle with drought conditions. The U.S. Drought Monitor lists several counties in southeast Illinois in the category of moderate drought.

September rainfall
Rainfall departures from normal for September 2010 in Illinois.