April 4th Wettest On Record

Precipitation

This April was the 4th wettest on record for Illinois with 6.90 inches, based on the preliminary numbers. That was 3.13 inches above the long-term average of 3.77 inches.
To show you how wet it was, this April easily beat out the combined statewide rainfall totals for Illinois in May, June, and July of 2012 during the worst of the drought. The total rainfall for those months in 2012 were 2.50 inches, 1.80 inches, 1.48 inches, respectively, which led to a total of only 5.78 inches. That was 1.12 inches less than this April!
The first map below shows the spectacular rainfall totals across much of the state. The areas in yellow and orange were 6 to 9 inches. A few areas in pink and red were 9 to 11 inches. This product has a 4 kilometer resolution and is based on radar estimates calibrated with rain gauges.
The second map shows the same rainfall amounts expressed as a percentage of the long-term average. There was a small patch of below-average rainfall in far southern Illinois. Otherwise the rainfall across the rest of the state was much above average. Many areas in the dark blue were 2 to 3 times their long-average rainfall.
Speaking of rain gauges, the two largest monthly totals for April so far were Augusta with 12.28 inches and Naperville with 11.03 inches. Several more stations reported totals in the 10-inch range.
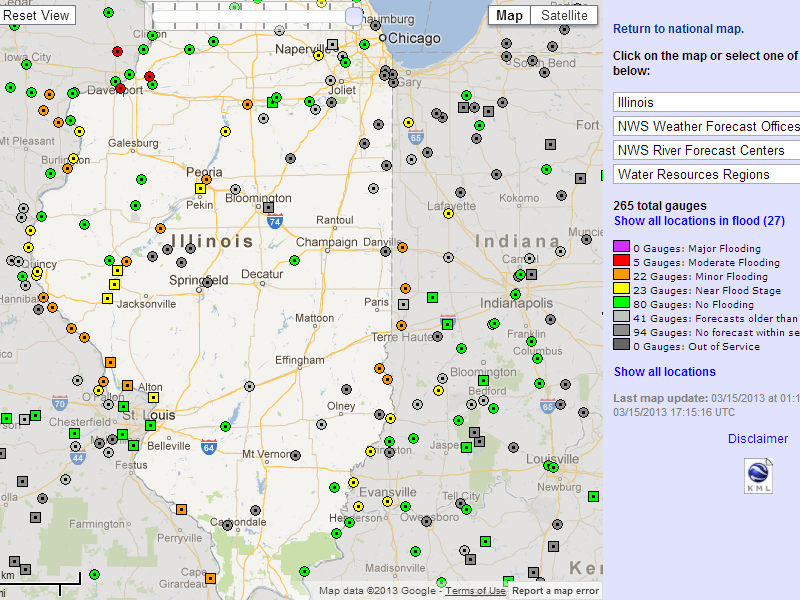
There were two major impacts of the wet April. One was widespread flooding on the Illinois, Wabash, and Mississippi Rivers and their tributaries. Several sites along the Illinois reported record high river crests in April. Because the flooding included the Chicago area, the dollar damages and number of people affected will be quite large.
The second impact of the wet April was the delay in fieldwork. In the April 29 USDA NASS report, only 1 percent of the corn crop was planted, compared to 76 percent last April, and a five-year average of 36 percent.

Temperature

The statewide average temperature was 50.1 degrees and 2.3 degrees below average. That was not record-setting but reflects the fact that we had a lot of cool, cloudy days in April.

Figures

The April 2013 precipitation, ending with reports on the morning of May 1. Click to enlarge.
April 2013 precipitation, ending with reports on the morning of May 1. Click to enlarge.

April precipitation, expressed as a percent of the long-term average. Click to enlarge.
April precipitation, expressed as a percent of the long-term average, for reports ending on the morning of May 1. Click to enlarge.

April Already 4th Wettest on Record

Based on preliminary data, this April in Illinois is already the 4th wettest on record with 6.58 inches of precipitation. Average statewide precipitation for April is 3.77 inches. So we are already almost two inches above average.
According to the NWS forecast, more rain is expected across southern Illinois on Friday and Saturday. Therefore, it is possible that we will move up the list by the end of the month. In addition, some sites may have already reached their record for April, including the city of Chicago.

Top 5 Wettest Aprils

  1. 2011 with 7.40 inches
  2. 1957 with 7.13 inches
  3. 1927 with 6.95 inches
  4. 2013 with 6.58 inches
  5. 1944 with 6.50 inches

Precipitation Pattern Across the State

Here is how the precipitation has been distributed around the state, based on our multi-sensor precipitation product, with the actual amounts and the departures from average. Many parts of central and northern Illinois have more than double their average April precipitation (shades of purple in the second map).

April precipitation in inches for the first 24 days of the month. Click to enlarge.

April precipitation as departures from average. Click to enlarge.

March Off to Cold, Wet Start

So far, March has been both colder than average across all of Illinois and wetter than average across western and northern Illinois. The statewide temperature for March 1-14 was 32.5 degrees, 5.4 degrees below average. That stands in stark contrast to last March when the statewide temperature for March 1-14 was 45.2 degrees, 7.3 degrees above average. That is a 12.7 degree difference between the two periods.
Precipitation through the morning of March 15 (Figure 1) ranged from less than an inch in southern Illinois to over 2 inches in western Illinois. Precipitation was below average in southern and eastern Illinois (Figure 2) and above average in western and northern Illinois. The dryness in southern and eastern Illinois is not a major concern at this point because of wet conditions in those areas in January and February.
The latest NWS forecasts show that rains of 1 to 2 inches or more could fall in the southern third of Illinois over the next five days (Figure 3). Also their 6-10 day and 8-14 days forecast show that colder and wetter than average conditions will prevail for the rest of March. Because of recent rains and melting snow, the NWS has issued flood warnings today on portions of the Mississippi, Illinois, and Wabash Rivers (Figure 4).

Figure 1.
Figure 1.

Figure 2.
Figure 2.

Figure 3.
Figure 3. Five-day precipitation forecast. Source: http://www.hpc.ncep.noaa.gov/medr/medr_mean.shtml

Figure 4.
Figure 4. Flood warnings in Illinois. http://water.weather.gov/ahps/region_forecast.php?state=il#

Winter Finally Arrives in Illinois In February

February

The preliminary numbers are in and winter finally arrived in February. The statewide temperature for February finished at 29.3 degrees, which was 1.5 degrees below average. The statewide precipitation was 2.7 inches, which was 0.6 inches above average. The precipitation total represented both rainfall and the water content of any snow. Snowfall for February ranged from less than an inch in southern Illinois to over 20 inches in the far northeast corner of the state.

Winter

For the core winter months of December, January, and February, the statewide temperature was 31.8 degrees, which was 2.8 degrees above average. The statewide average precipitation was 9.1 inches, 2.2 inches above average. It was the 11th wettest winter on record for Illinois. Snowfall for those three months ranged from less than 10 inches in east-central Illinois to over 20 inches in parts of far western and northern Illinois, as well as in a band across southern Illinois.

Maps

Here are the maps of precipitation and snowfall for February.

February 2013 Precipitation.

February 2013 Precipitation Departures From Average.

February 2013 Snowfall.

February 2013 Snowfall Departure.