
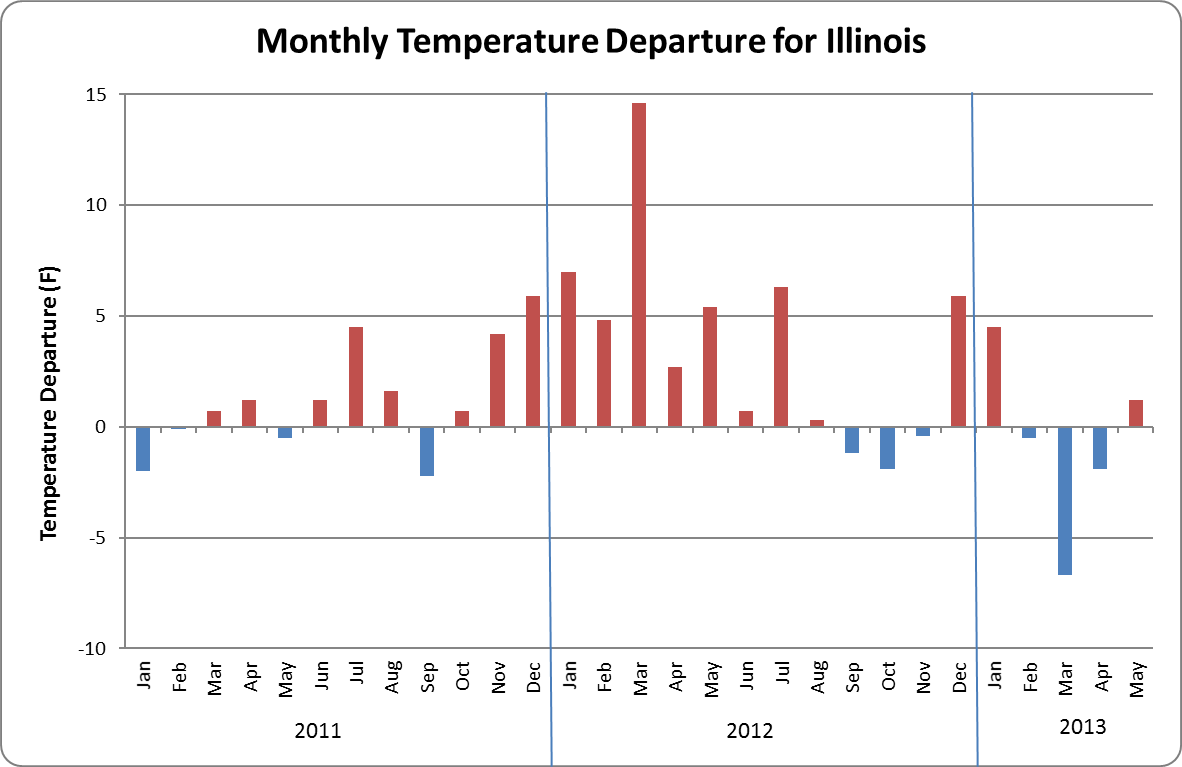
Here are the monthly temperature and precipitation departures for the state of Illinois since 2011. Departures are from the long-term average (1981-2010). A few of the outstanding features were:
- outstanding warming from July 2011 to July 2012;
- a wet start to 2011 and 2013;
- drought in 2012, starting in January 2012 and staying in parts of Illinois through at least the end of the year.
Before becoming too complacent about growing conditions this summer, we should remember that we started out with wet conditions in 2011 before a flash drought arrived in July and August. The combination of hot, dry conditions – especially in central Illinois – led to crop losses by the end of August of that year.

Why do you call the period 1981-2010 “the long term average”? Is it meaningful to call a thirty year period “the long term average”? How does the average temperature in this very recent thirty year period compare with the previous one hundred years’ average? How does it compare with even longer term climate reconstructions over the past 1000 or 10,000 years? Is there overwhelming evidence that the period 1981-2010, so far from representing a “long term average”, in fact represents an extraordinary (in the Holocene) deviation from long term average temperatures?
http://www.sciencemag.org/content/339/6124/1198.abstract
Thanks for the comment. I was away on stay-cation last week or I would have responded sooner. I was pretty clear in the article that I was referring to the 1981-2010 period and I would not make any claims that it represents the last 100, 1000, or 10,000 years. In short, the 30-year average is just a benchmark for measuring recent climate and weather events.
We had a related discussion on averages and normals a few months ago so I will refer you to that link: http://climateillinois.wordpress.com/2013/01/16/are-we-normal-or-average/
Jim, thanks for the response. The problem with using the last 30 years as a benchmark is that it is itself an exceptional period – the warmest world wide in millennia. If we always use a 30 year moving average as our benchmark, it will usually seem like nothing much has changed. But that’s an artifact of using a very short period of time as the baseline. I think it’s much cleaner to plot the relevant time series over the entire historical record. That would make longer term trends, of the kind that we expect with anthropogenic global warming, much clearer.