Widespread and heavy rains fell across the previously dry central part of Illinois. A large part of the area labeled as “abnormally dry” in last week’s US Drought Monitor received 2-4 inches or more of rain (see map below). Some localized amounts exceeded 5 inches, causing the NWS to issue flash flood warnings in some instances.
Over the last 7 days, the highest Illinois rainfall total was from a CoCoRaHS observer near Streator (IL-LS-33) who reported 6.14 inches. A close second was a CoCoRaHS observer near Morris (IL-GY-16) who reported 5.65 inches.
I think it’s safe to say that those areas in central Illinois that were truly considered “abnormally dry” a few weeks ago are no longer that way – typical Illinois weather. Unfortunately, the rains missed southern Illinois again.

Heavy Rain in Chicago on July 23
Chicago has a new all-time daily record rainfall when 6.86 inches fell during the early morning hours of Saturday, July 23, 2011, at O’Hare airport. The previous daily record was 6.64 inches set on September 13, 2008 (a little less than three years ago).
Even more amazing, the 6.86 inches of rain fell in slightly over three hours from 1 to 3 a.m. According to the ISWS Bulletin 70, the so-called 100-year, 3-hour storm for the Chicago area is 4.85 inches. Obviously, this storm far exceeded that. On a side note, the phrase “100-year storm” is a misnomer because it implies that you have a space of 100 years between storms. The slightly better phrase is “a once in 100 year return period on average“. It’s best to think of it as the size of storm with a 1% chance of occurrence in any given year.
The folks at the Iowa Environmental Mesonet of the Iowa State University Department of Agronomy produced an amazing plot of the rainfall at O’Hare using 1-minute data. The black line is the hourly rate over 1 minute (rainfall rate in inches/hour). The green line is the hourly rate over 15 minutes. The red line is the hourly rate over 60 minutes. The blue line is the accumulated rainfall over time. The point of the 1-minute and 15-minute lines is to show that it was not a steady rain but contained several short periods with tremendous rain rates. One of those minutes exceeded 8 inches per hour (o.14 inches in one minute X 60 minutes = 8.4 inches/hour).
You can read more about the July 23 event at the Chicago NWS office link. Several CoCoRaHS observers had amounts that were even higher than O’Hare including two Arlington Heights observers with 7.25 inches (IL-CK-87) and 7.14 inches (IL-CK-81), one in Des Plaines (IL-CK46) with 7.24 inches, and one in Elks Grove Village (IL-CK-63) with 7.17 inches.

Ninth Wettest June on Record for Illinois
The statewide average precipitation for June in Illinois was 6.7 inches. That’s 2.6 inches above the 1971-2000 average. Rainfall totals at individual sites were impressive. The highest rainfall total for June was from a CoCoRaHS observer near Warsaw (Henderson County) who reported 20.85 inches. NWS cooperative observers in Loami reported 14.48 inches and in Jacksonville reported 13.74 inches
The statewide average temperature for June was 72.8 degrees, 0.9 degrees above average. The warmest reported temperature for the month was 100 degrees in DuQuoin on June 4.
If it feels like we are seeing a lot of wet Junes, you are right. First is a list of the top ten wettest Junes in Illinois:
- 8.37 inches in 1902
- 7.68 inches in 1998
- 7.67 inches in 2010
- 7.31 inches in 1928
- 7.13 inches in 2000
- 6.99 inches in 1924
- 6.89 inches in 1993
- 6.80 inches in 1945
- 6.73 inches in 2011
- 6.52 inches in 1957
- 2007: 4.18 inches, 0.06 inches above average
- 2008: 5.74 inches, 1.62 inches above average
- 2009: 5.20 inches, 1.08 inches above average
- 2010: 7.67 inches, 3.53 inches above average
- 2011: 6.73 inches, 2.61 inches above average
Record-Setting April Rainfall in Illinois
Record-Setting Rainfall
[Updated May 2]
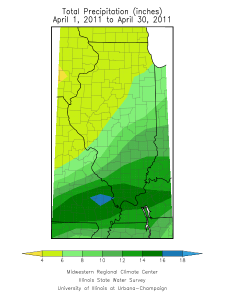
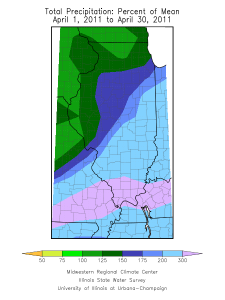
Based on preliminary data, the statewide average rainfall for April (as of May 2) is 7.59 inches, beating the old record of 7.13 inches set in 1957. Statewide records go back to 1895.


Selected Rainfall Totals
April rainfall has been heaviest in southern Illinois with several stations reporting over 10 inches of rain. Here are the rainfall totals through April 30 across the state, ranked from high to low. These are provisional and may change as more data comes in and as the data are processed through quality control at the national archive.
16.90 DU QUOIN 4 SE
15.29 BROOKPORT DAM 52
15.13 CAIRO 3 N
15.10 SMITHLAND L&D
15.04 MURPHYSBORO 2 SW
14.84 CARBONDALE SEWAGE PLT
13.94 CHESTER
13.92 GRAND CHAIN DAM 53
13.74 HUTSONVILLE PWR PL
13.68 CENTRALIA
13.31 OLNEY 2S
13.18 ROBINSON
12.97 SHAWNEETOWN OLD TOWN
12.56 LAWRENCEVILLE
12.53 MT VERNON 3 NE
12.40 PALESTINE 2W
12.15 MT CARMEL
11.92 KASKASKIA RIV NAV LO
11.91 PINCKNEYVILLE 2 N
11.87 CLAY CITY 6 SSE
11.87 CLAY CITY 6 SSE
11.78 CASEY
11.71 KINMUNDY
11.67 HIDALGO 3SW
11.66 MARTINSVILLE 10S
11.37 BEECHER CITY
11.12 EFFINGHAM SE
11.06 NEW ATHENS
11.04 FAIRFIELD RADIO WFIW
10.98 NEOGA
10.67 IUKA
10.54 EFFINGHAM
10.49 FLORA
10.47 SALEM
10.32 GRAYVILLE
10.29 PARIS WTR WKS
10.23 MATTOON
10.22 SULLIVAN
10.22 VANDALIA
10.19 RAMSEY
10.08 NASHVILLE 1 E
9.81 CHARLESTON
9.60 NEOGA 4NW
9.25 ST DAVID
9.07 FISHER
9.01 RANTOUL
9.01 GREENVILLE
9.00 SHELBYVILLE DAM
8.97 CARLYLE RSVR
8.73 WINDSOR
8.70 LEBANON
8.55 PRAIRIE DU ROCHER
8.49 HIGHLAND
8.40 TRIMBLE 1E
8.32 PANA
8.17 DANVILLE SEWAGE PLAN
8.02 TUSCOLA
7.94 EDWARDSVILLE 2 W
7.91 MT OLIVE 1 E
7.91 BELLEVILLE SIU RSRCH
7.87 TAYLORVILLE
7.81 ALTON MELVIN PRICE
7.72 DANVILLE
7.72 HOOPESTON 1 NE
7.66 PEORIA 5NW
7.59 ARTHUR 1W
7.50 GERMANTOWN HILLS
7.44 NEWMAN 3W
7.42 URBANA
7.38 PAXTON
7.35 BOURBONNAIS 3 NW
7.33 PEORIA GTR PEORIA AP
7.33 SIDELL 5 NW
7.32 ST ANNE
7.27 HAVANA
7.21 MOWEAQUA 2S
7.11 PHILO
7.10 DECATUR
7.08 LOVINGTON
7.02 OGDEN
6.95 MORRISONVILLE
6.94 MILFORD 5 NW
6.85 WATSEKA 2 NW
6.70 CLINTON 1 SSW
6.65 DAHINDA
6.52 SAYBROOK 2N
6.42 STREATOR
6.38 PARK FOREST
6.32 KINCAID
6.30 MARSEILLES LOCK
6.29 JERSEYVILLE 2 SW
6.27 CAMP GROVE
6.27 SHERMAN 1 ESE
6.24 CHANNAHON DRESDEN ISLAND
6.22 OTTAWA
6.19 DWIGHT
6.18 SPRINGFIELD #2
6.16 CHENOA
6.15 STANFORD 2S
6.08 PRINCEVILLE 2W
6.08 KEWANEE 1 E
6.04 BLOOMINGTON 5W
6.02 ROMEOVILLE LEWIS UNIV AP
6.02 PONTIAC
6.00 SPARLAND 6 SW
5.96 LANSING
5.95 LITTLE RED SCHOOL HSE
5.91 NEWARK 2 SSE
5.86 ELBURN
5.86 LA GRANGE
5.84 KNOXVILLE
5.83 FARMER CITY 3W
5.81 MASON CITY
5.73 CHICAGO MIDWAY AP 3 SW
5.73 ROANOKE
5.70 YORKVILLE 3 SW
5.65 ST CHARLES 7 NW
5.62 ELGIN
5.62 BRADFORD 3SSE
5.60 ELIZABETH
5.57 MUNDELEIN 4 WSW
5.55 MORTON
5.50 JOLIET BRANDON RD DM
5.49 NORMAL 4NE
5.49 NORMAL 4NE
5.46 SPRINGFIELD CAPITAL AP
5.45 PERU
5.45 PERU
5.45 MINONK
5.42 ALTONA
5.36 CARLINVILLE
5.35 EARLVILLE 3 S
5.35 MORRIS
5.33 CHICAGO BOTANICAL GARDEN
5.32 MENDOTA 2 SE
5.32 OAK BROOK 2W
5.32 JACKSONVILLE 2
5.31 SPRING GROVE
5.30 CHATSWORTH
5.30 WINCHESTER
5.28 EUREKA
5.25 PLAINFIELD 3 NE
5.22 LINCOLN
5.21 ALBERS 1 W
5.16 WOODSTOCK 5 NW
5.13 STREAMWOOD
5.08 BARRINGTON 3 SW
5.08 GLEN ELLYN 4 S
5.06 JACKSONVILLE 2 E
5.04 MOLINE QUAD CITY INTL AP
5.01 PRAIRIE CITY 2S
5.01 CONGERVILLE 2 NW
4.99 LAKE SPRINGFIELD
4.90 CHICAGO OHARE INTL AP
4.88 MCHENRY STRATTON L&D
4.87 VIRGINIA
4.80 MACKINAW
4.78 PITTSFIELD #2
4.78 CHICAGO MIDWAY AP
4.73 MORRISON
4.73 BLOOMINGTON WATRWRKS
4.68 BUFFALO
4.65 QUINCY DAM 21
4.63 WHITE HALL 1 E
4.57 RIPLEY
4.54 FAIRBURY WWTP
4.54 FREEPORT WWP
4.51 TOULON
4.44 AUGUSTA
4.41 DE KALB
4.35 MT PULASKI
4.35 GREENFIELD
4.34 HARVARD
4.33 ATHENS 2 N
4.30 STEWARD 3S
4.25 GENOA 2 SW
4.24 KANKAKEE METRO WWTP
4.21 CISCO
4.20 ROCHELLE
4.20 ROCHELLE
4.18 RUSHVILLE
4.16 ALEDO
4.14 GALESBURG
4.11 SHABBONA 3S
4.11 QUINCY RGNL AP
4.04 PERRY 6 NW
3.98 BELVIDERE
3.97 MONEE RSVR
3.94 BENTLEY
3.91 ROSCOE 2 SE
3.71 STOCKTON 3 NNE
3.66 BEARDSTOWN
3.65 AMBOY
3.62 PAW PAW
3.61 MT CARROLL
3.47 WHEATON 3 SE
3.45 MARENGO
3.40 ROCKFORD GTR ROCKFORD AP
3.20 GRIGGSVILLE
2.61 MONMOUTH 4 NW

