A large, slow-moving low-pressure system moved through the central US, bringing widespread, heavy rains to Illinois and neighboring state. This resulted in considerable flooding ranging from flooded basements to major flooding on the Mississippi River.
Rainfall Maps for December 26-29, 2015
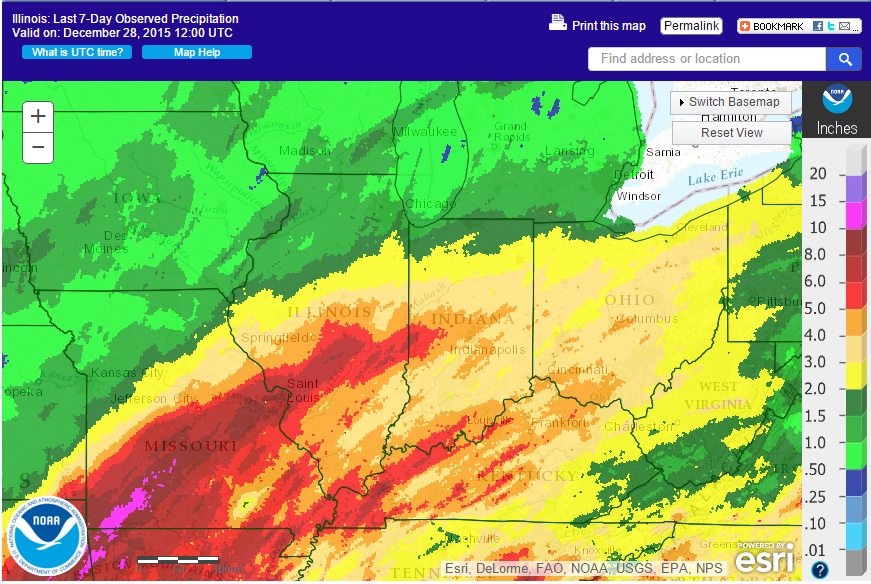
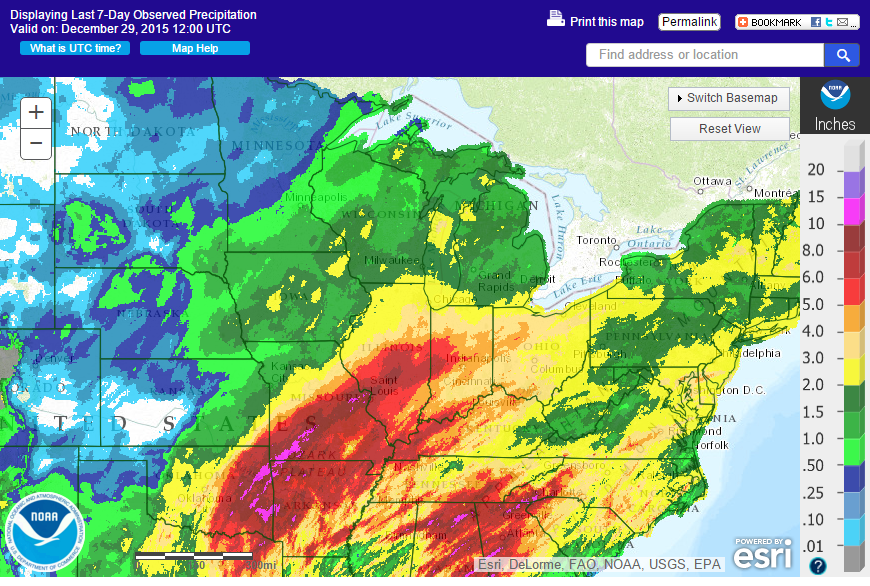
This first map shows the widespread heavy rains from Texas, Oklahoma, Arkansas, Missouri, Illinois, Kentucky, and Indiana. Areas in the three shades of red represent amounts of 5 to 10 inches. The purple streak from Oklahoma to Missouri represents 10 to 15 inches of rain.
Southern and central Illinois were hardest hit with large areas of 5 to 10 inches of rain, falling on soils that were already saturated. Meanwhile, the northern third of Illinois received 2 to 4 inches of precipitation (rain plus water content of snow), as well as 1 to 4 inches of snow.
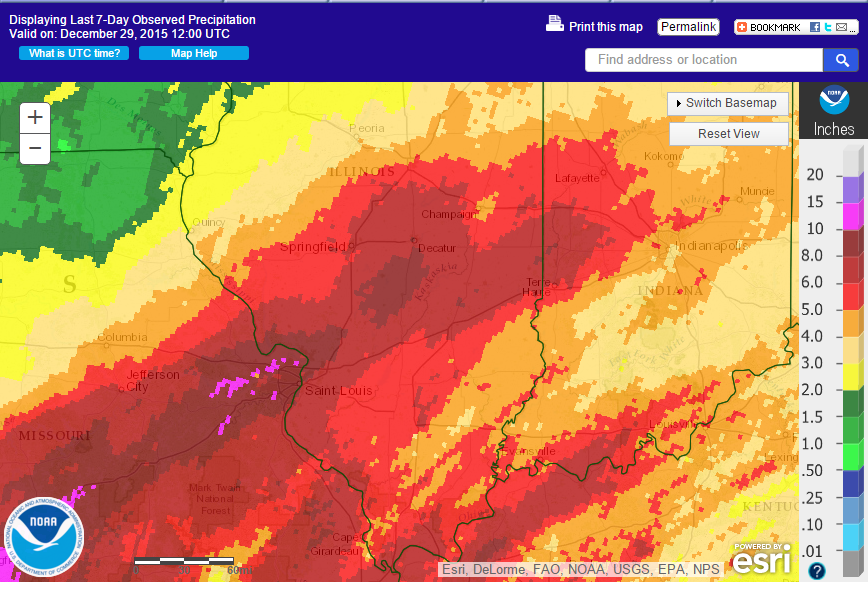
This second map zooms in on Illinois, showing the heavy rains across the state more clearly. The lightest shade of red is 5 to 6 inches, the next darker shade is 6 to 8 inches, and the darkest shade of red east of St. Louis and south of Decatur is 8 to 10 inches.
To put this in perspective, the average December precipitation for Illinois ranges from 4.5 inches in southern Illinois to 2 inches in northwest Illinois. So areas in central Illinois, where the average is about 3 inches, received about 3 times that over the course of 4 days.
Flooding
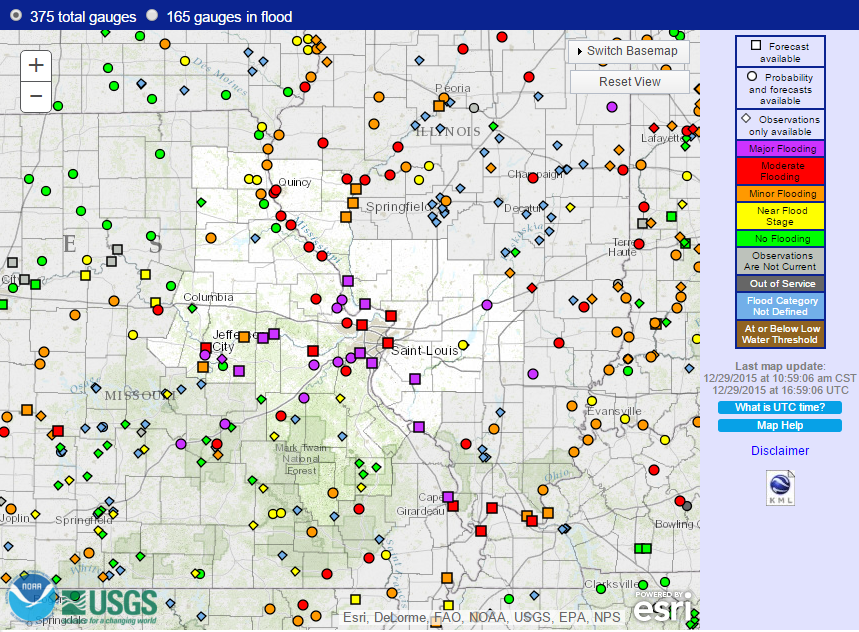
These heavy rains have led to widespread flooding. Here is the NWS map of rivers and streams in various stages of flooding. The purple dots and squares represent areas of major flooding, mostly the Mississippi River from St. Louis southward.
“Major Flooding” means extensive inundation of structures and roads. Significant evacuations of people and property. Red means moderate flooding (some risk of flooding to structures and roads) and tan means minor flooding.
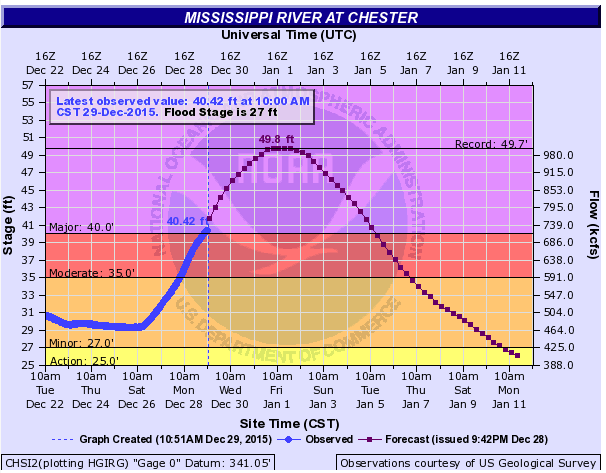
Here is a NWS river flood forecast at Chester IL on the Mississippi River, showing the impact of the heavy rains upstream. Right now they are expecting a record, or near record, stage at that point of the river.
Rainfall Totals for December 26-29, 2015
Here are some rainfall totals from our volunteer CoCoRaHS network around the state, ranked from highest to lowest, with complete data from December 26-29, 2015. Godfrey IL, near St. Louis, reported the highest 4-day total of 10.03 inches.
| Station Number |
Station Name | Total Precip (inches) |
| IL-MD-34 | Godfrey 2.5 SSW | 10.03 |
| IL-MD-28 | Staunton 4.3 SSW | 8.90 |
| IL-SH-1 | Shelbyville 0.5 NE | 8.87 |
| IL-MD-10 | Granite City 1.4 ENE | 8.57 |
| IL-EF-13 | Effingham 6.7 N | 7.61 |
| IL-CN-3 | Pana 6.2 NNE | 7.45 |
| IL-MP-12 | Carlinville 1.1 E | 7.42 |
| IL-SC-18 | Fairmont City 0.9 ENE | 7.05 |
| IL-MY-1 | Nokomis 4.5 NW | 6.98 |
| IL-RH-7 | Sparta 1.6 SW | 6.74 |
| IL-CN-7 | Taylorville 0.6 ENE | 6.73 |
| IL-DG-12 | Camargo 4.5 ESE | 6.65 |
| IL-RH-8 | Sparta 1.9 SSW | 6.56 |
| IL-SH-3 | Mode 3.7 NW | 6.51 |
| IL-ED-6 | Chrisman 3.6 ESE | 6.50 |
| IL-DG-11 | Tuscola 0.6 NNE | 6.27 |
| IL-MP-18 | Girard 0.1 WSW | 6.26 |
| IL-MA-1 | Mount Zion 0.8 ESE | 6.22 |
| IL-CN-4 | Edinburg 3.0 W | 6.15 |
| IL-CP-21 | Broadlands 0.1 SSW | 6.13 |
| IL-DG-4 | Tuscola 0.5 WSW | 6.10 |
| IL-MD-20 | Edwardsville 0.9 WSW | 6.08 |
| IL-MD-33 | Troy 1.5 SSE | 6.04 |
| IL-WM-4 | Bush 2.0 ESE | 6.02 |
| IL-MP-4 | Girard 1.2 W | 5.97 |
| IL-SC-11 | Centreville 1.9 E | 5.87 |
| IL-WS-3 | Okawville 2.3 SW | 5.76 |
| IL-CL-2 | Marshall 4.6 W | 5.75 |
| IL-PT-1 | Monticello 3.5 NNE | 5.72 |
| IL-CP-14 | Philo 0.3 NE | 5.68 |
| IL-SC-9 | Belleville 4.5 WNW | 5.67 |
| IL-CP-1 | Homer 2.0 N | 5.63 |
| IL-SC-3 | Belleville 2.2 SE | 5.57 |
| IL-EF-10 | Watson 0.3 NE | 5.52 |
| IL-SC-23 | Belleville 2.7 SSE | 5.52 |
| IL-MC-1 | Belknap 11.1 ESE | 5.45 |
| IL-JF-4 | Mount Vernon 1.3 SW | 5.44 |
| IL-CP-58 | Urbana 0.9 SSE | 5.43 |
| IL-VR-19 | Danville 7.6 N | 5.34 |
| IL-MG-9 | Jacksonville 1.2 SW | 5.26 |
| IL-CP-95 | Urbana 4.2 ESE | 5.15 |
| IL-VR-4 | Henning 3.4 SSE | 5.15 |
| IL-SG-4 | Riverton 1.9 W | 5.12 |
| IL-PT-6 | Monticello 6.5 WSW | 5.11 |
| IL-CP-31 | St. Joseph 0.9 SSW | 5.04 |
| IL-MG-6 | Murrayville 0.4 NE | 5.03 |
| IL-CP-90 | Champaign 2.4 S | 5.02 |
| IL-VR-20 | Westville 0.6 SSW | 4.99 |
| IL-RC-3 | Olney 0.7 E | 4.95 |
| IL-PT-8 | White Heath 3.7 NNE | 4.94 |
| IL-VR-14 | Danville 0.6 NW | 4.94 |
| IL-CP-37 | Sidney 0.9 N | 4.93 |
| IL-CP-59 | Mahomet 1.7 NNE | 4.92 |
| IL-CP-92 | Mahomet 1.2 S | 4.90 |
| IL-MN-5 | Odin 0.5 SSE | 4.88 |
| IL-SG-47 | Springfield 6.6 S | 4.85 |
| IL-CP-64 | Champaign 2.4 SSE | 4.83 |
| IL-PT-13 | Mansfield 3.0 WSW | 4.83 |
| IL-SG-17 | Springfield 4.4 W | 4.83 |
| IL-CP-81 | Dewey 1.6 NNW | 4.75 |
| IL-LG-36 | Lincoln 1.7 W | 4.71 |
| IL-CS-3 | Arenzville 5.3 NNE | 4.68 |
| IL-ME-10 | Athens 2.4 NNW | 4.61 |
| IL-SG-11 | Chatham 1.4 ESE | 4.56 |
| IL-MO-4 | Fults 3.7 ENE | 4.50 |
| IL-LG-8 | Lincoln 1.4 SE | 4.46 |
| IL-ME-9 | Athens 1.0 N | 4.46 |
| IL-LG-13 | Lincoln 0.9 NNW | 4.38 |
| IL-LG-22 | Lincoln 0.87 SE | 4.38 |
| IL-CK-14 | Chicago 5.5 ESE | 4.36 |
| IL-MCL-4 | Heyworth 0.6 E | 4.35 |
| IL-MCL-7 | Le Roy 4.1 SSW | 4.31 |
| IL-LG-9 | Beason 4.0 SW | 4.27 |
| IL-PT-17 | Monticello 3.8 NNE | 4.25 |
| IL-VR-17 | Hoopeston 0.8 W | 4.18 |
| IL-LG-40 | Lincoln 0.4 NE | 4.17 |
| IL-CP-47 | Champaign 2.3 NNW | 4.15 |
| IL-FK-5 | West Frankfort 0.3 WNW | 4.02 |
| IL-LG-30 | Atlanta 7.1 W | 4.01 |
| IL-CP-28 | Champaign 1.3 SSW | 4.00 |
| IL-MCL-30 | Saybrook 4.3 SSE | 3.96 |
| IL-SG-48 | Springfield 2.6 WNW | 3.92 |
| IL-FD-9 | Gibson 3.0 WNW | 3.86 |
| IL-CW-3 | Hutsonville 0.3 WNW | 3.79 |
| IL-LV-6 | Pontiac 1.0 SE | 3.71 |
| IL-GY-2 | Dwight 4.1 NNW | 3.68 |
| IL-TZ-26 | Pekin 3.6 SSE | 3.66 |
| IL-MCL-23 | Normal 1.9 ESE | 3.53 |
| IL-KK-7 | Kankakee 4.5 WNW | 3.44 |
| IL-KK-23 | Bonfield 4.0 WSW | 3.40 |
| IL-SG-44 | Sherman 4.1 N | 3.40 |
| IL-KK-25 | Bonfield 4.2 NNE | 3.39 |
| IL-MCL-2 | Arrowsmith 1.7 NNE | 3.25 |
| IL-WF-12 | Germantown Hills 1.3 NW | 3.21 |
| IL-IR-2 | Ashkum 5.6 E | 3.19 |
| IL-LV-7 | Chatsworth 0.4 ESE | 3.19 |
| IL-WL-23 | Beecher 3.4 SSE | 3.15 |
| IL-CK-145 | Oak Park 1.5 S | 3.14 |
| IL-MCL-9 | Danvers 1.7 WNW | 3.14 |
| IL-WL-26 | Manhattan 0.8 ESE | 3.14 |
| IL-GY-12 | Braceville 0.5 SSE | 3.12 |
| IL-WL-131 | Homer Glen 0.7 NNE | 3.12 |
| IL-GY-9 | Mazon 0.5 ENE | 3.10 |
| IL-CK-82 | Burnham-Hegewisch 1.6 NNW | 3.09 |
| IL-PR-9 | Dunlap 2.6 S | 3.09 |
| IL-WL-73 | Wilmington 2.6 SE | 3.09 |
| IL-WL-20 | Manhattan 4.7 ENE | 3.00 |
| IL-CK-152 | Chicago Ridge 0.2 WSW | 2.99 |
| IL-CK-206 | Park Forest 1.0 SW | 2.98 |
| IL-TZ-14 | Morton 1.0 SSE | 2.97 |
| IL-WL-63 | New Lenox 1.8 SE | 2.96 |
| IL-CK-154 | Worth 0.1 E | 2.92 |
| IL-GY-10 | Minooka 0.3 NE | 2.88 |
| IL-WL-118 | Elwood 4.6 NE | 2.84 |
| IL-GY-1 | Carbon Hill 3.1 N | 2.83 |
| IL-WL-97 | New Lenox 3.3 E | 2.83 |
| IL-WL-99 | Manhattan 1.9 SE | 2.83 |
| IL-GY-21 | Coal City 2.8 N | 2.82 |
| IL-MCD-7 | Colchester 3.5 NE | 2.80 |
| IL-CK-253 | Midlothian 0.1 SSE | 2.79 |
| IL-WL-67 | Channahon 2.5 SSE | 2.75 |
| IL-DP-79 | Burr Ridge 1.9 SW | 2.73 |
| IL-LS-33 | Streator 3.7 ENE | 2.73 |
| IL-WL-16 | Homer Glen 0.8 ENE | 2.73 |
| IL-WL-25 | Crete 2.6 E | 2.72 |
| IL-HN-1 | Dallas City 3.0 SSE | 2.71 |
| IL-KK-26 | Kankakee 3.2 SE | 2.70 |
| IL-GY-16 | Morris 6.4 ESE | 2.68 |
| IL-LS-1 | Ottawa 1.3 NW | 2.65 |
| IL-CK-50 | Palos Park 1.3 SW | 2.64 |
| IL-CK-153 | Alsip 0.2 E | 2.64 |
| IL-WL-71 | Plainfield 1.1 SW | 2.62 |
| IL-CK-196 | Harwood Heights 1.9 NNE | 2.61 |
| IL-CK-211 | Oak Lawn 1.6 WNW | 2.60 |
| IL-LS-17 | Ottawa 1.6 N | 2.58 |
| IL-CR-4 | Chadwick 2.7 WSW | 2.56 |
| IL-DP-127 | Downers Grove 0.4 NNE | 2.55 |
| IL-WL-100 | Joliet 2.9 WNW | 2.54 |
| IL-CK-180 | Park Ridge 0.5 SSW | 2.50 |
| IL-DP-85 | Villa Park 1.0 NW | 2.50 |
| IL-KD-24 | Oswego 5.0 SSE | 2.50 |
| IL-WL-119 | Homer Glen 1.6 NW | 2.50 |
| IL-WL-80 | Lockport 1.3 SE | 2.48 |
| IL-CK-106 | Hoffman Estates 4.6 W | 2.45 |
| IL-LK-42 | Gurnee 1.6 W | 2.44 |
| IL-CK-61 | Oak Park 1.0 SW | 2.42 |
| IL-DP-57 | Aurora 3.5 NE | 2.42 |
| IL-CK-232 | Rogers Park 0.6 ESE | 2.40 |
| IL-CK-98 | La Grange Park 0.7 SSW | 2.37 |
| IL-DP-102 | Bolingbrook 2.7 NE | 2.34 |
| IL-DP-32 | Lisle 1.3 SE | 2.32 |
| IL-LS-7 | Sheridan 3.4 SSE | 2.32 |
| IL-LS-56 | Ottawa 0.4 N | 2.32 |
| IL-DP-77 | Roselle 1.1 W | 2.31 |
| IL-GY-20 | Morris 2.5 SSE | 2.30 |
| IL-KN-62 | Batavia 1.3 WNW | 2.29 |
| IL-KX-9 | Knoxville 0.7 NW | 2.29 |
| IL-GY-11 | Morris 4.8 NNW | 2.27 |
| IL-LS-57 | Mendota 0.4 ENE | 2.26 |
| IL-CK-75 | Elk Grove Village 2.2 WSW | 2.25 |
| IL-CK-149 | Oak Lawn 0.5 SSW | 2.25 |
| IL-LE-8 | Ashton 0.4 SSW | 2.22 |
| IL-DP-132 | Wheaton 2.0 NNE | 2.19 |
| IL-HD-1 | Stronghurst 0.4 SSW | 2.19 |
| IL-CK-94 | Lincolnwood 1.8 E | 2.18 |
| IL-BU-8 | Tiskilwa 2.1 N | 2.16 |
| IL-LK-8 | Gurnee 2.5 NE | 2.15 |
| IL-LK-22 | Lake Forest 2.1 NNE | 2.15 |
| IL-DP-109 | Elmhurst 0.8 ESE | 2.14 |
| IL-KN-51 | Sugar Grove 1.4 ENE | 2.14 |
| IL-DP-75 | Naperville 1.1 NW | 2.13 |
| IL-LS-34 | La Salle 0.1 W | 2.11 |
| IL-KN-4 | Sugar Grove 0.7 NE | 2.10 |
| IL-CK-63 | Elk Grove Village 0.6 ESE | 2.09 |
| IL-DP-101 | Aurora 3.8 SE | 2.09 |
| IL-KD-34 | Plainfield 4.8 SW | 2.09 |
| IL-LK-39 | Riverwoods 0.4 ENE | 2.09 |
| IL-DP-40 | Lombard 1.0 NNW | 2.08 |
| IL-KN-33 | North Aurora 1.5 NE | 2.08 |
| IL-LK-69 | Highwood 0.9 S | 2.06 |
| IL-KN-63 | Geneva 1.7 WSW | 2.04 |
| IL-DP-100 | Bartlett 1.1 SE | 2.00 |
| IL-WL-46 | Peotone 0.4 ENE | 1.99 |
| IL-LS-11 | Mendota 0.9 N | 1.98 |
| IL-DK-24 | Somonauk 1.9 NE | 1.95 |
| IL-LK-16 | Buffalo Grove 1.5 N | 1.95 |
| IL-DP-16 | Aurora 3.6 SE | 1.94 |
| IL-WN-26 | Rockford 1.5 ENE | 1.92 |
| IL-KN-23 | Batavia 1.5 WNW | 1.91 |
| IL-KN-30 | Elburn 0.4 NW | 1.90 |
| IL-KN-64 | St. Charles 0.1 E | 1.84 |
| IL-KN-9 | Elgin 1.0 S | 1.82 |
| IL-WN-8 | Rockford 0.7 NW | 1.82 |
| IL-BN-14 | Capron 0.1 N | 1.78 |
| IL-KN-110 | Elgin 1.9 NE | 1.78 |
| IL-LE-21 | Dixon 5.2 WSW | 1.74 |
| IL-LK-3 | Beach Park 1.4 W | 1.69 |
| IL-MCH-43 | Algonquin 0.7 N | 1.69 |
| IL-MCH-30 | Wonder Lake 0.8 WNW | 1.66 |
| IL-LK-81 | Lake Villa 2.3 WSW | 1.63 |
| IL-CK-131 | Schaumburg 2.0 E | 1.62 |
| IL-KN-95 | Elgin 2.5 W | 1.53 |
| IL-WN-3 | Machesney Park 3.1 ENE | 1.51 |
| IL-CR-12 | Mount Carroll 6.8 NNW | 1.47 |
| IL-RI-13 | Moline 0.7 NNE | 1.44 |
| IL-WN-2 | Roscoe 1.6 ESE | 1.44 |
| IL-SP-6 | Freeport 2.0 NW | 1.43 |
| IL-RI-3 | Moline 0.9 N | 1.41 |
| IL-CK-192 | Park Ridge 0.7 WNW | 1.38 |
| IL-SP-7 | Davis 0.5 N | 1.38 |
| IL-LE-17 | Dixon 1.5 SW | 1.32 |
| IL-OG-4 | Byron 3.2 N | 1.23 |
| IL-CR-13 | Shannon 0.2 S | 1.22 |
| IL-MCH-66 | Harvard 2.8 SSE | 1.02 |
| IL-CK-36 | Chicago 4.7 NE | 1.01 |
| IL-SP-8 | Winslow 4.3 ESE | 0.77 |
| IL-LE-14 | Amboy 0.5 ESE | 0.17 |