We saw highly variable temperatures across the state this month, with record-breaking heat in the early part of October, and record-breaking cold in the latter part. The preliminary statewide October average temperature was 53.7 degrees, less than 1 degree below our 30-year normal. Temperatures were near normal in eastern Illinois, and between 2 and 6 degrees below normal across western Illinois. Preliminary data suggest October was considerably wetter than normal for the entire state. The statewide average October precipitation total was 5.20 inches, approximately 2 inches above the 30-year normal. The wet deviations were particularly large in the northern and southern reaches of the state.
Data are provisional and may change slightly over time
Temperature Variability
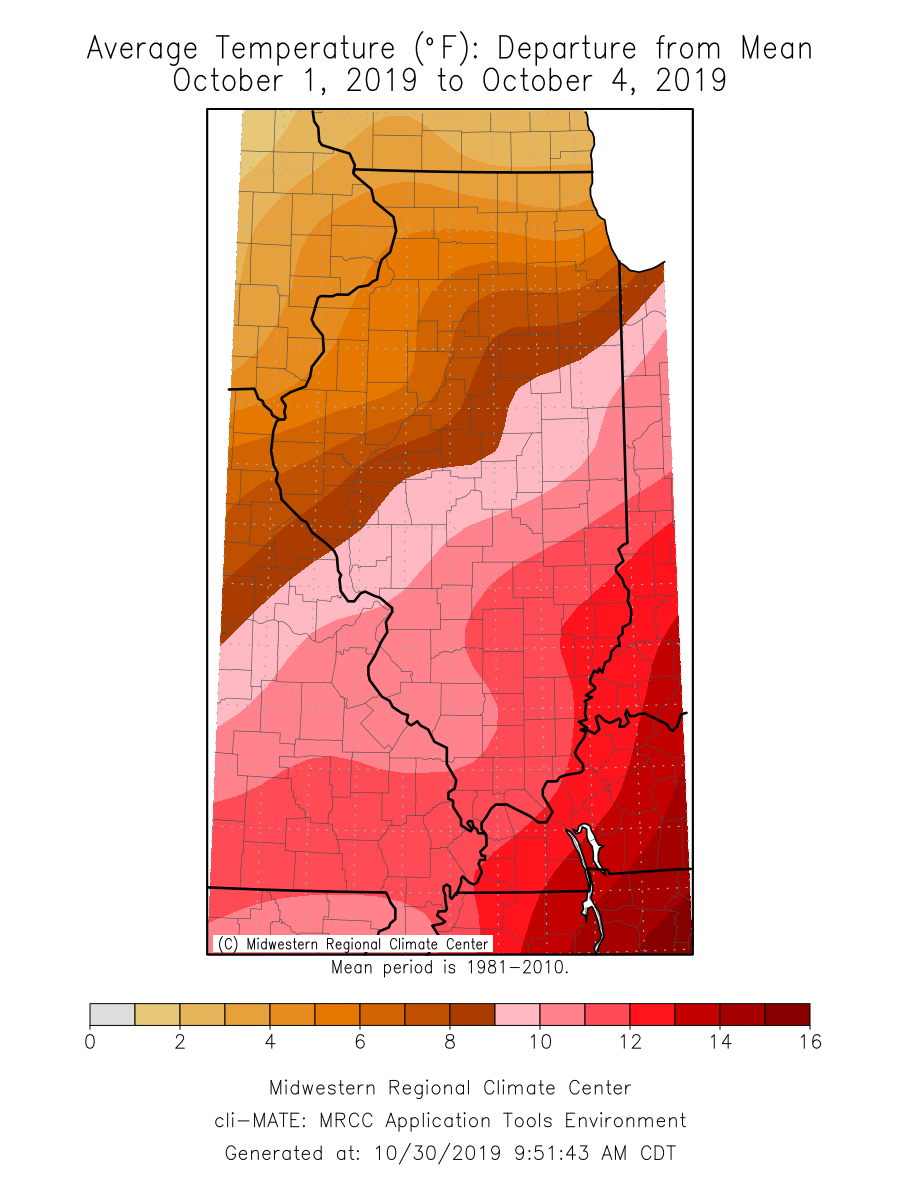
Record-breaking high temperatures persisted from September into early October. Average temperatures during the first four days of October were 10 to 14 degrees above normal in the southeast part of the state, and 3 to 8 degrees above normal for the northwest part (see map below). Maximum temperatures broke 90 degrees and minimum temperatures remained in the 70s for several days in southern Illinois. Stations in Saint Clair and White Counties reached 96 degrees on October 2. Between October 1 and October 4, 46 daily high maximum temperature records and 73 daily high minimum temperature records were broken across Illinois, according to the NOAA National Centers for Environmental Information (NCEI). Additionally, 9 stations broke their all-time October high maximum temperature records, and 13 stations broke their all-time October high minimum temperature records. In one particularly extreme event, the October 1 nighttime minimum temperature at Kaskaskia Lock and Dam in Randolph County was 72 degrees, 10 degrees above the previous daily record and 2 degrees above the all-time October minimum temperature record at that station.
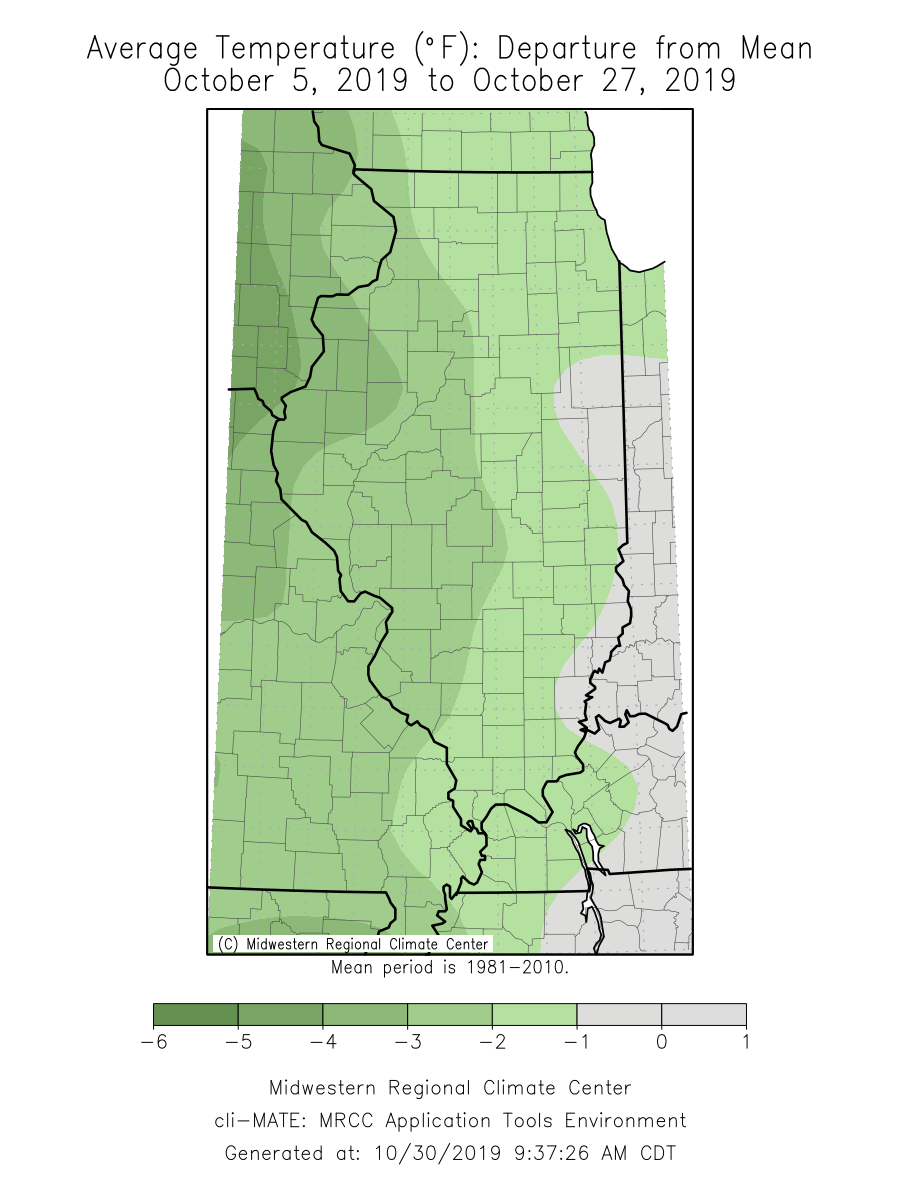
Seasonable temperatures ensued after the heat was broken toward the end of the first week of October. Temperatures from October 5 to October 27 were near normal in eastern Illinois and between 3 and 6 degrees below normal for western Illinois (see map below). Nearly all the state experienced the first fall frost event in the second week of October. Nighttime minimum temperatures dipped below 32 degrees as far south as Pope County and below 28 degrees in Warren and Jo Daviess Counties.
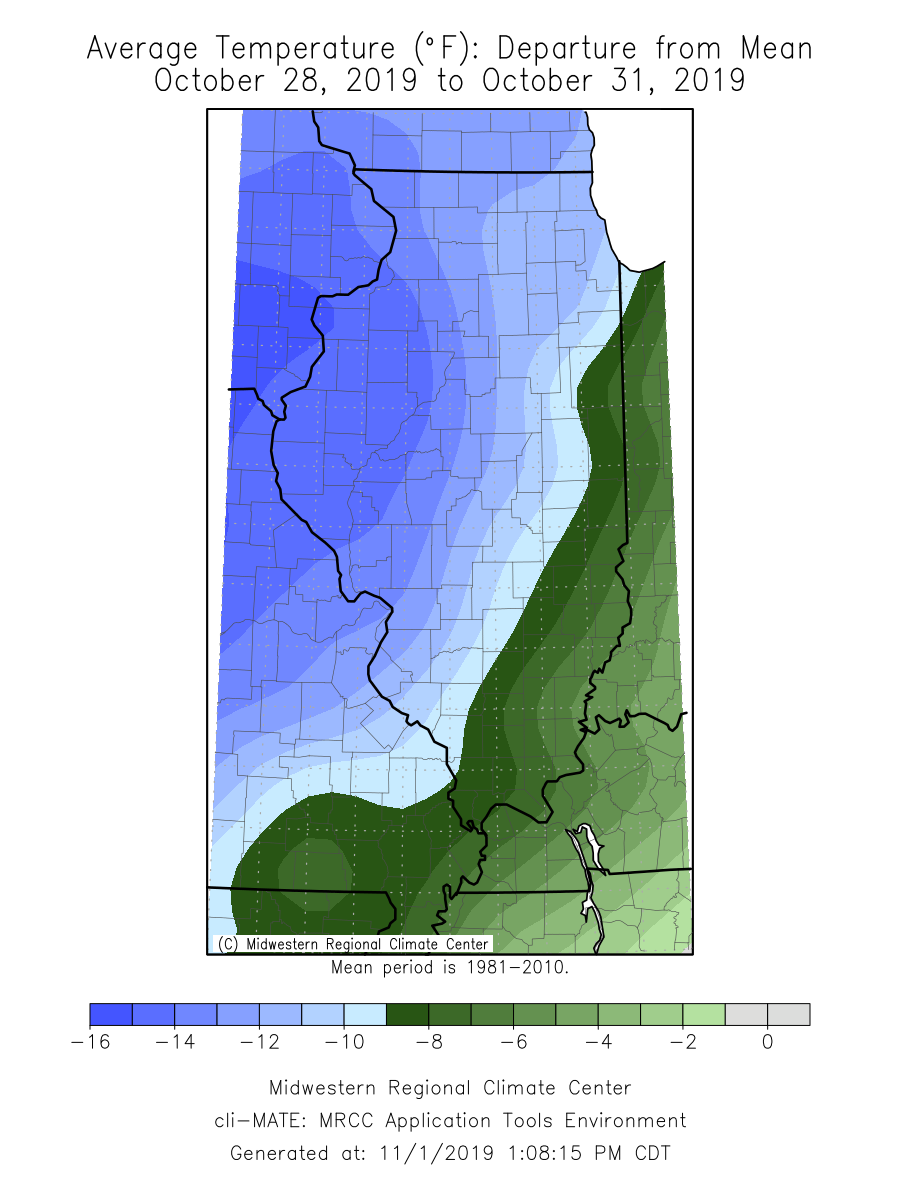
The heat wave that started the month was matched by a strong burst of cold air to close out the month. Temperatures between October 28 and October 31 were 8 to 16 degrees below normal. Similarly, 48 daily low maximum temperature records and 12 daily low minimum temperature records were broken across Illinois over the last four days of the month. Nighttime minimum temperatures dropped below 30 degrees as far south as Pulaski County. The lowest minimum temperature observed in October was 14 degrees in both Carroll and Lee Counties on Halloween night. Halloween was also the coldest on record for 51 stations across Illinois.
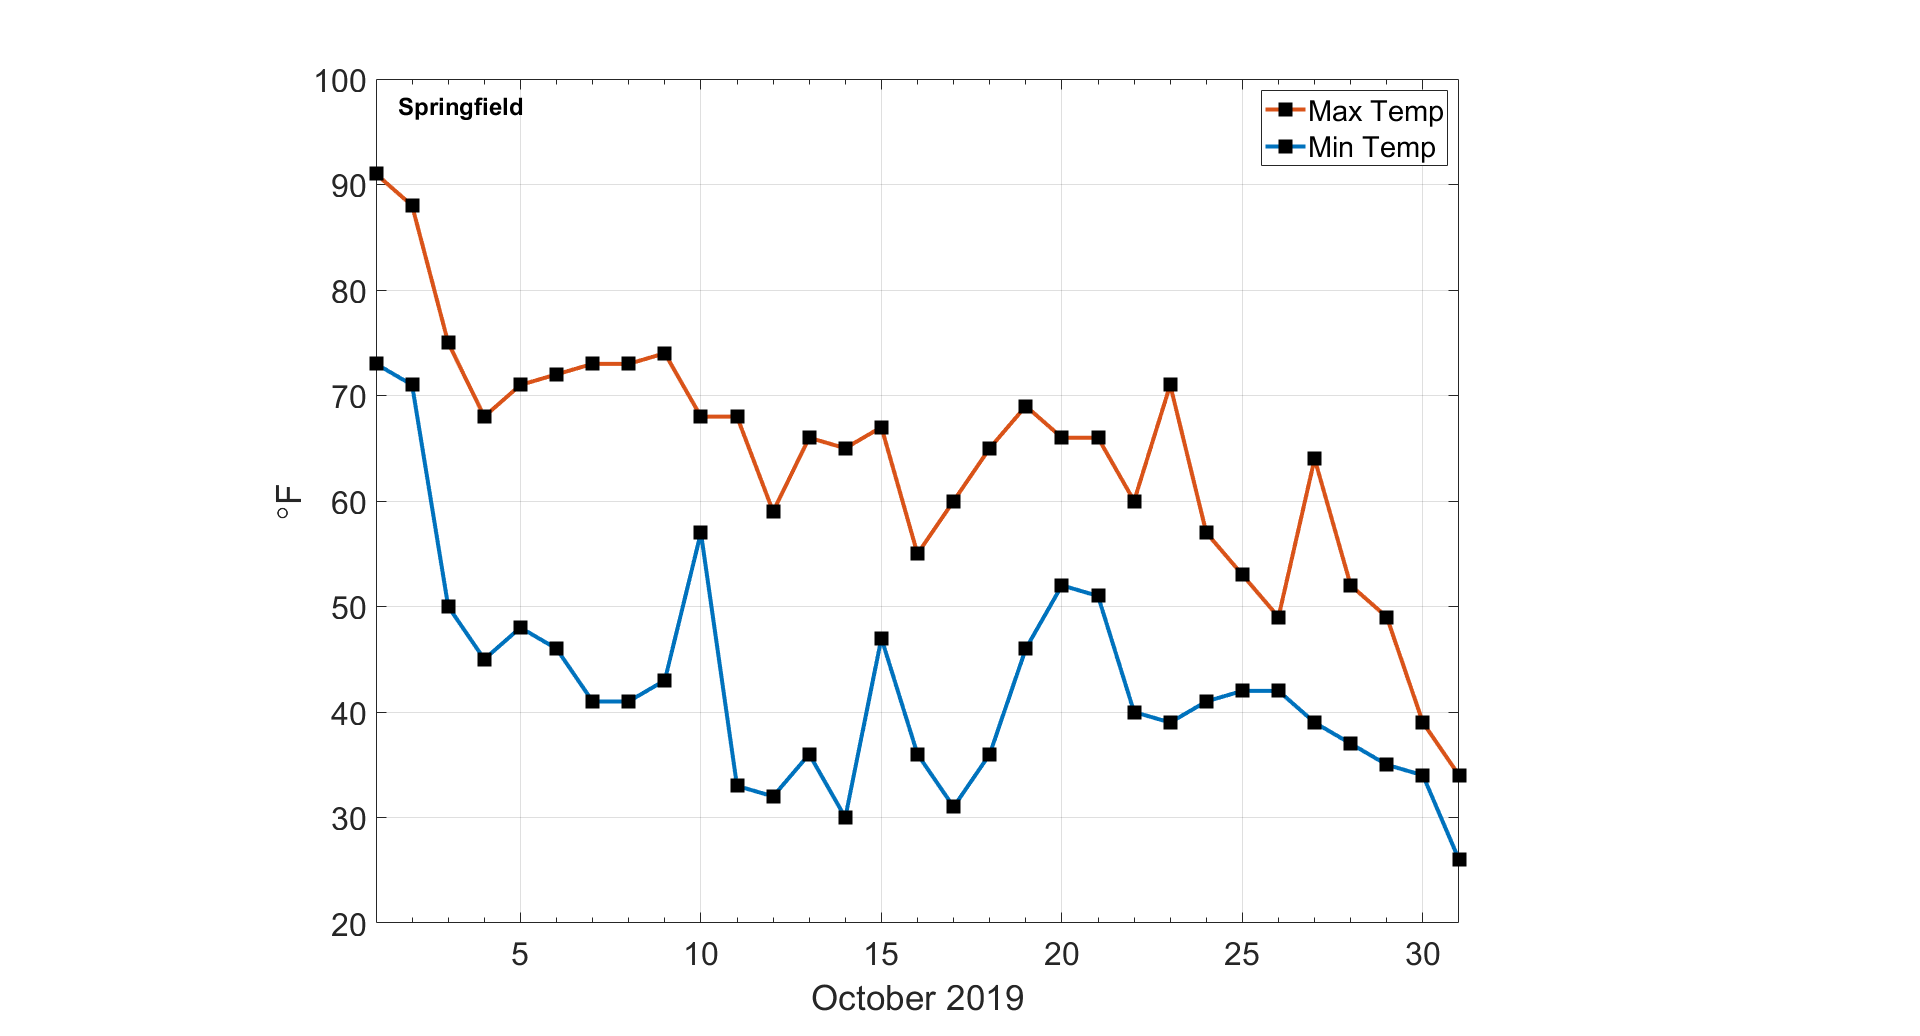
The temperature contrast between the start and end of this month may be best summarized in the graph below, which shows daily maximum and minimum temperatures at Springfield Abraham Lincoln Capital Airport this last month. There was a 57° difference between daily maximum temperatures on October 1st and October 31st in Springfield, both of which broke daily records. In fact, 10 Illinois COOP stations broke their daily high maximum temperature record on October 1st and their daily low maximum temperature record on October 31st.
Precipitation
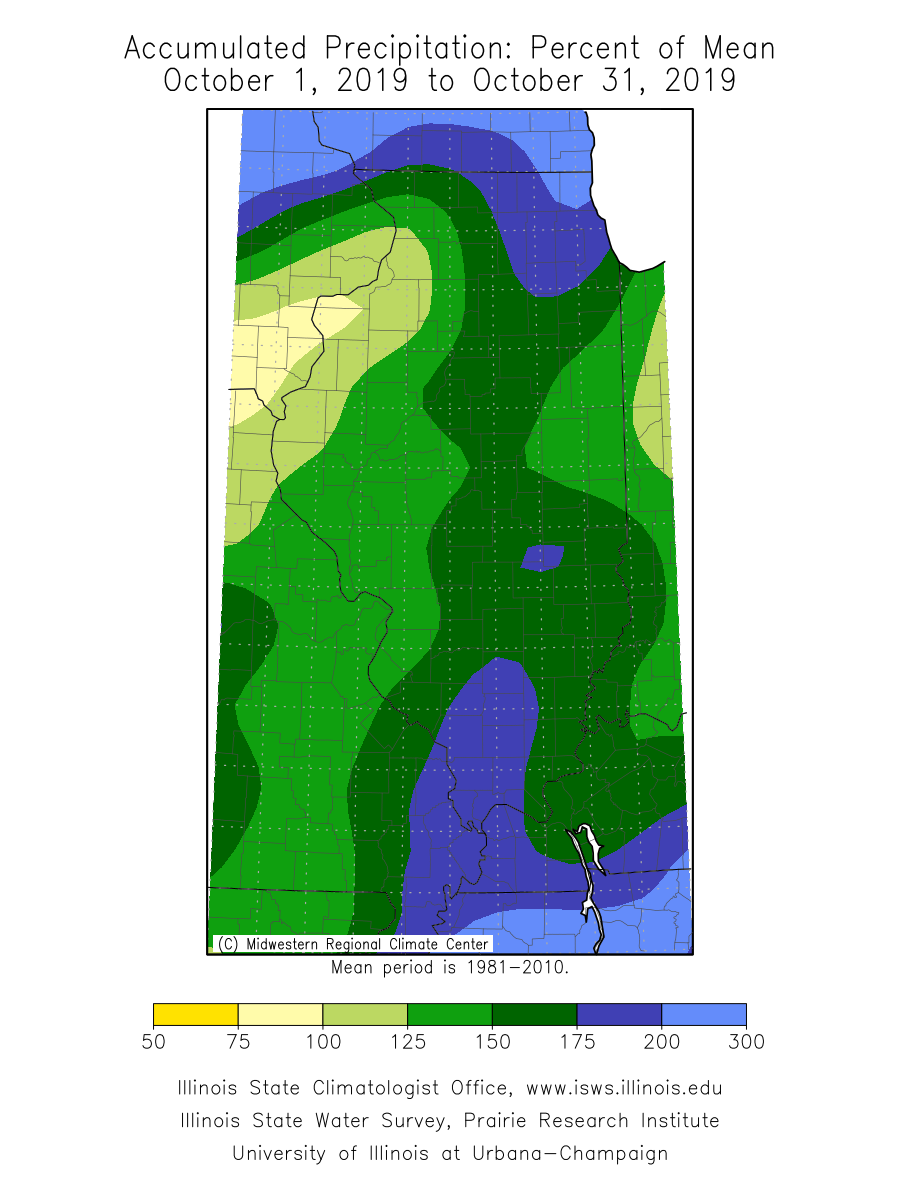
October precipitation was above normal for virtually all of Illinois. The statewide total precipitation in October was 5.20 inches, approximately 2 inches more than the 30-year normal. Areas of far northern and southern Illinois received over 7 inches of rainfall in October. CoCoRaHS observers in New Lenox in Will County and Riverwoods in Lake County recorded over 12 inches of precipitation in October. Expressed as a percent of the long-term mean, areas of northeastern Illinois received more than 200 percent of mean October precipitation, and a broad swath of southern Illinois received over 150 percent of mean October precipitation (see maps below). Significant rainfall helped improve drought conditions in southern Illinois. The latest U.S. Drought Monitor map – current as of October 29 – shows no drought in Illinois for the first time since early August.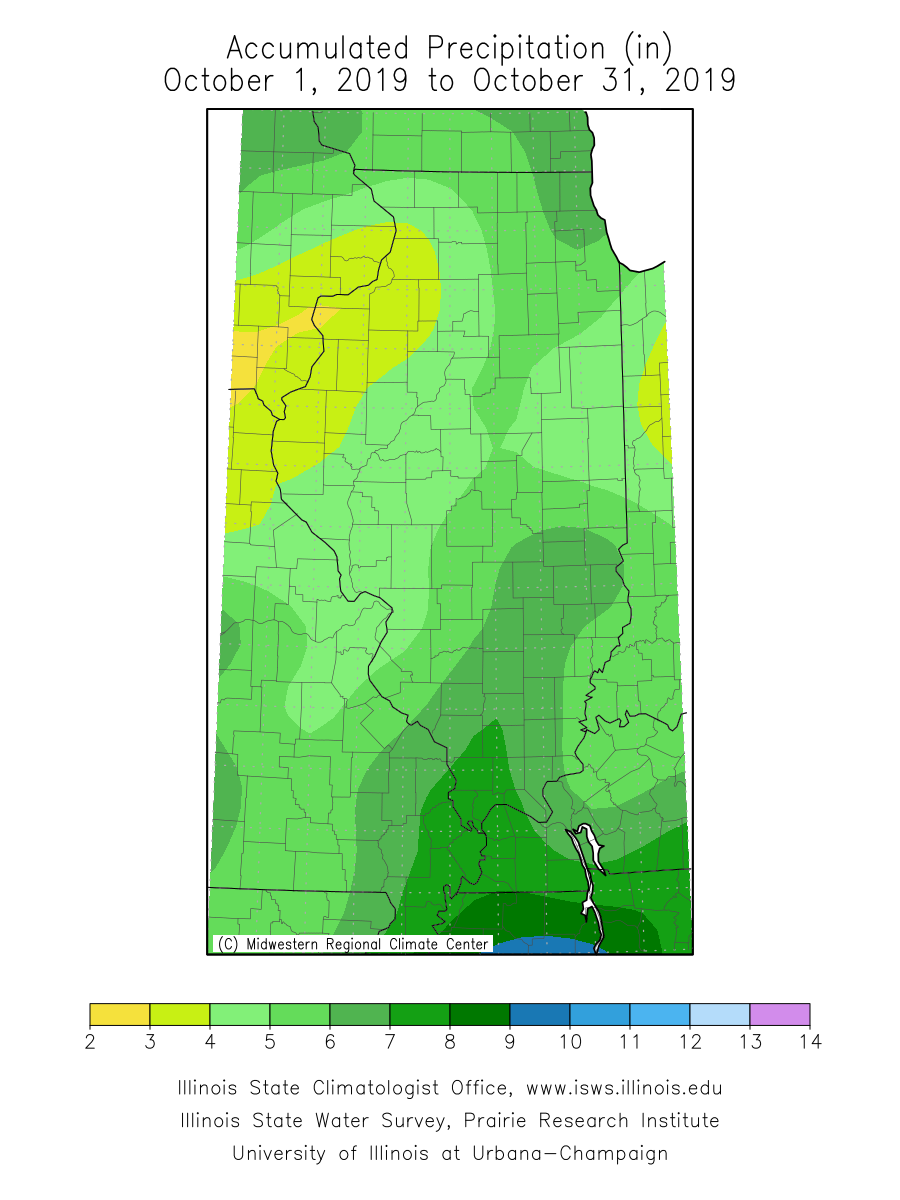
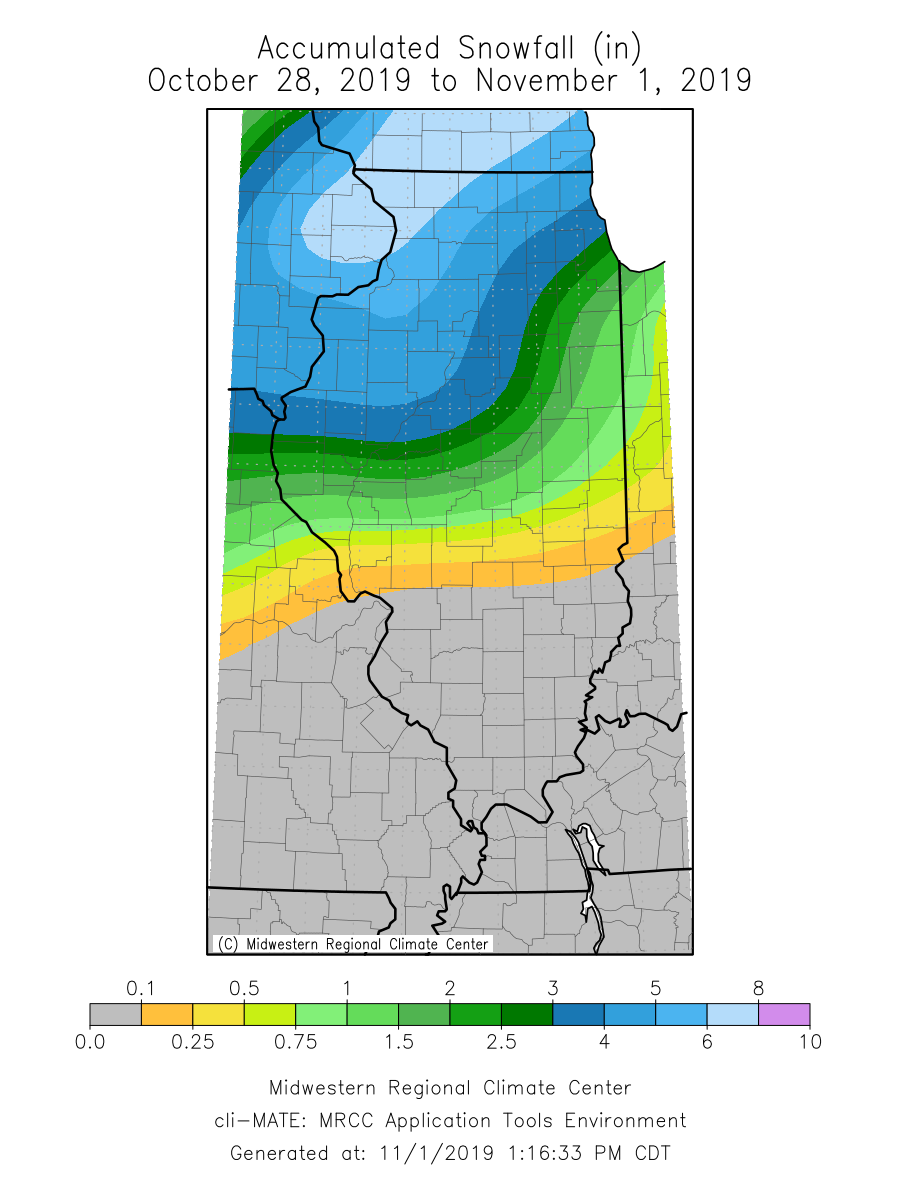
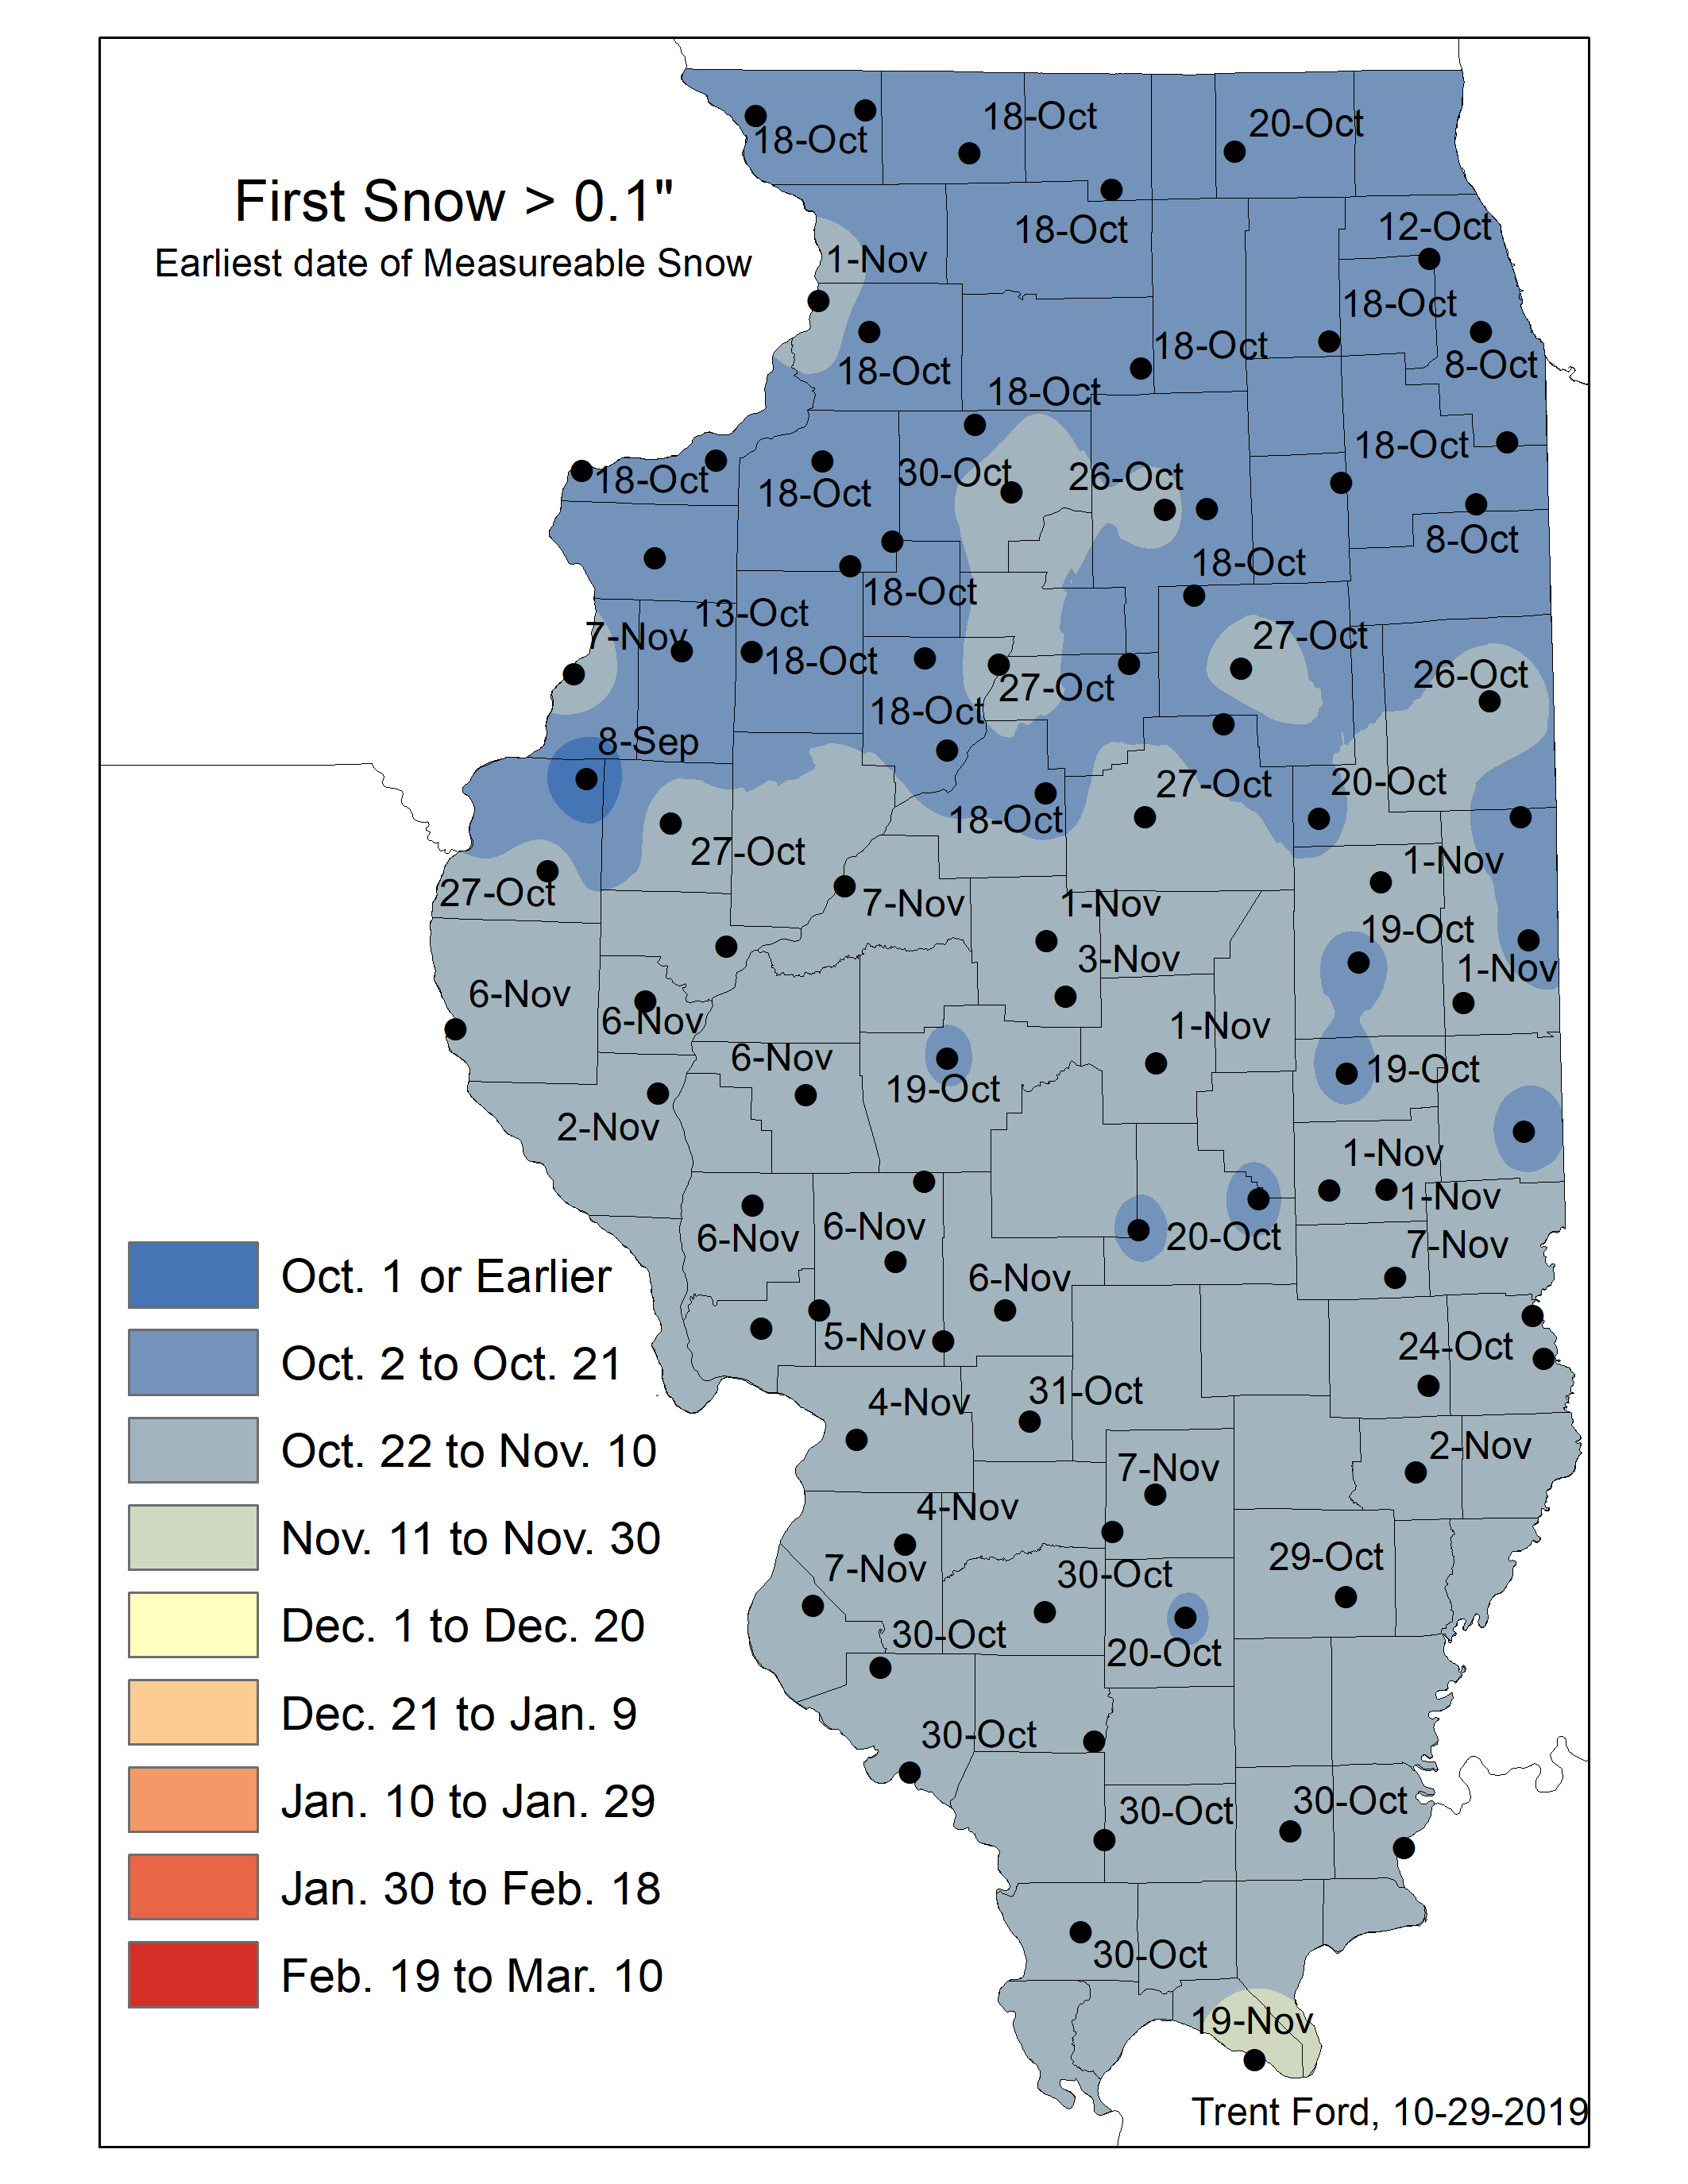
 The cool down that came at the end of this month brought a variety of precipitation, including snowfall and some snow accumulation in northern and western Illinois. Total snowfall accumulation over the last week of October ranged from over 8 inches in northwestern Illinois to just over a tenth of an inch as far south as Nokomis in Montgomery County. The highest October snowfall total, 8.5 inches, was in Orangeville in Stephenson County. Although late October is early for the first snowfall in Illinois, it is certainly precedented. The map below shows the date of the earliest recorded snowfall (> 0.1 inch) at COOP stations across the state.
Short- and Long-Term Outlooks
Short-term 8- to 14-day outlooks from the Climate Prediction Center show strongly elevated odds of below normal temperatures persisting into the first couple of weeks of November. Concurrently, probabilities are elevated for below normal precipitation out to 14 days, as drier weather is likely to prevail following the first winter storm of the season in Illinois.
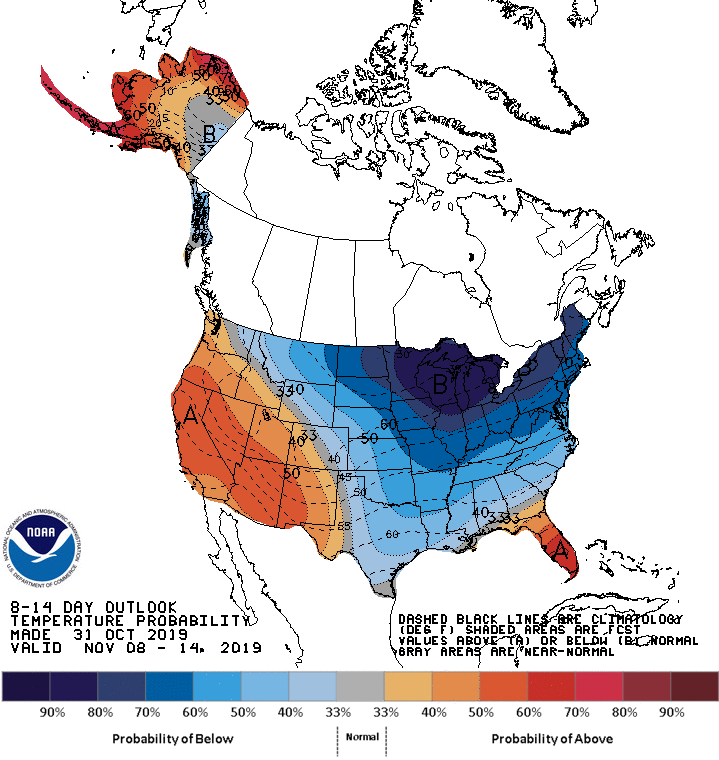
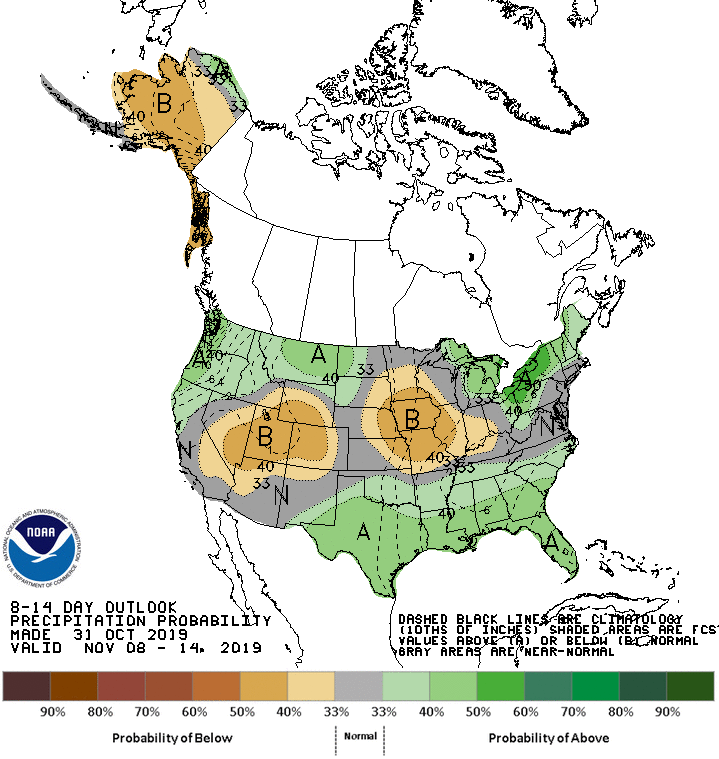
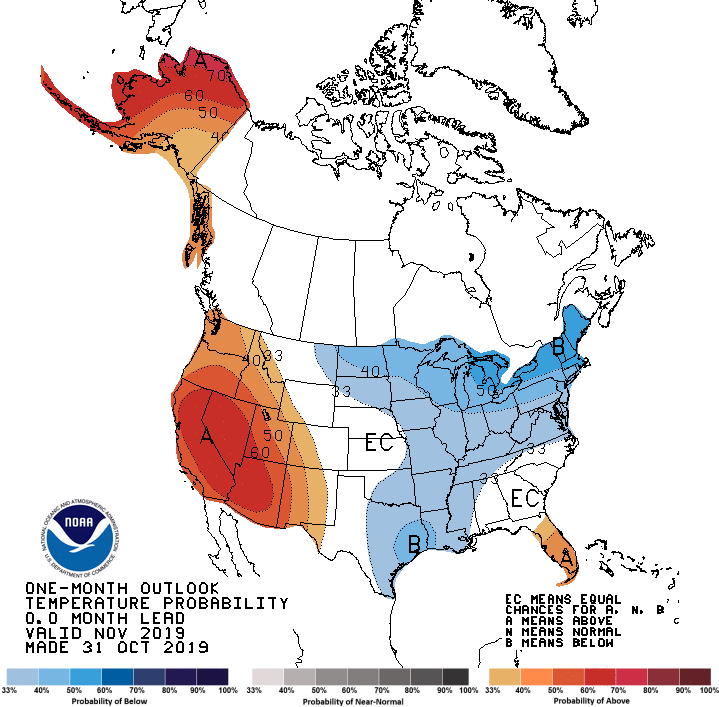
Longer-term outlooks for November also show increased odds of below normal temperatures and increased odds of above below normal precipitation. Winter (December–February) outlooks show greater odds of a wetter than normal winter.
