May Brought a Cool End to Spring

This past month is quite challenging to summarize across the state. Overall, the preliminary statewide average May temperature was 60.8 degrees, 2.5 degrees below the 1991–2020 average and tied for 42nd coldest on record going back to 1895. The preliminary statewide average total May precipitation was 4.50 inches, 0.26 inches below the 1991–2020 average and tied for the 50th wettest on record going back to 1895.  

Data are provisional and may change slightly over time

May Continued Spring Temperature Rollercoaster

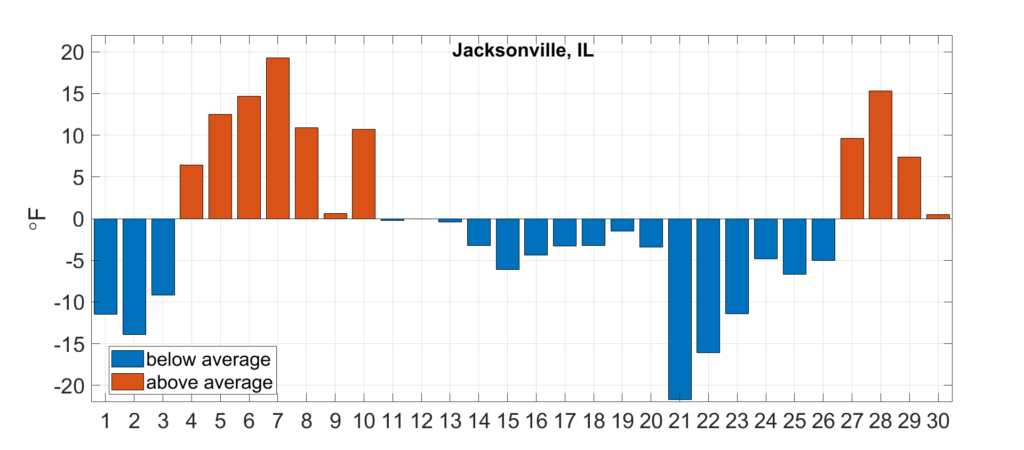
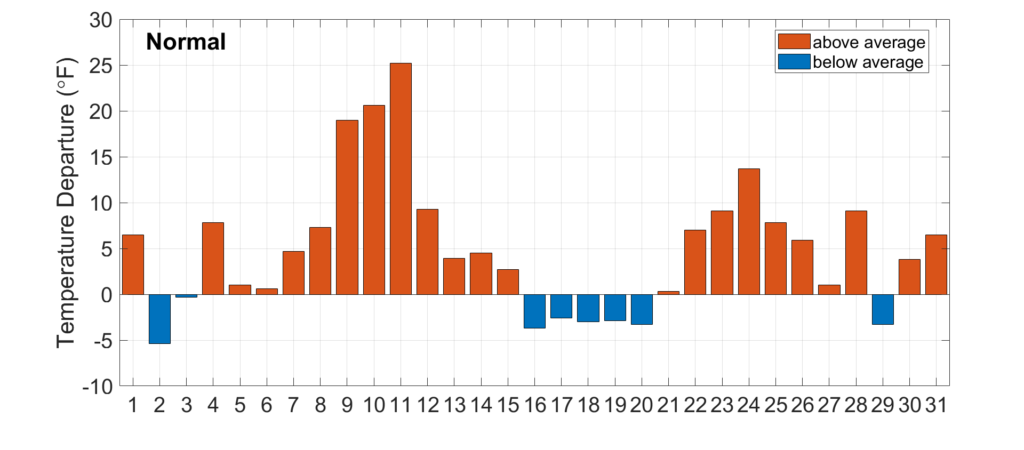
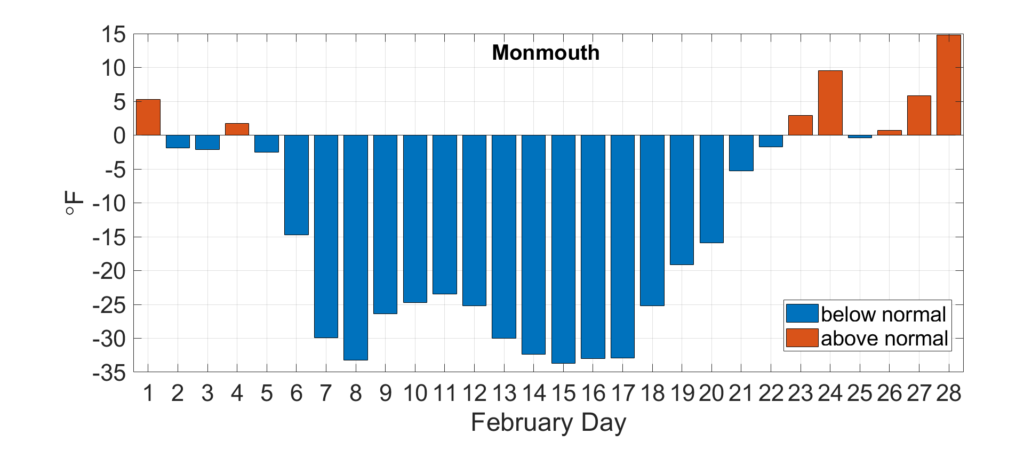
May temperatures varied substantially as the daily temperature departures from Aurora show below (Figure 1). Average temperatures ranged between 5 and 15 degrees below normal for all but a handful of days in the first half of the May, followed by a 10-day period of average temperatures 5 to 15 degrees above normal. Temperatures dropped in the last week of May as a cold front moved through the Midwest ahead of the Memorial Day weekend.

Figure 1. Daily temperatures in Aurora (black line) and daily temperature departures from the 1991-2020 normal (red and blue bars).

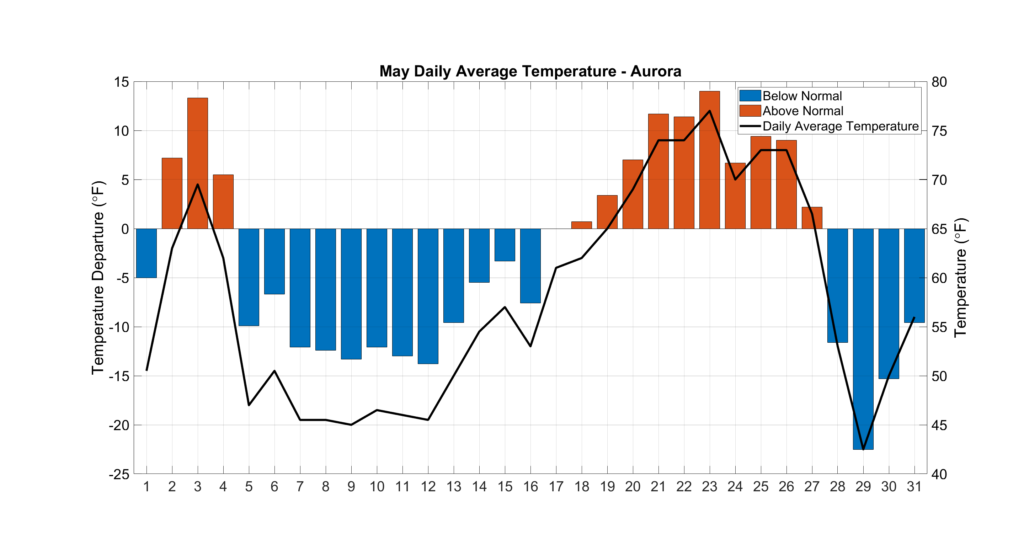
The temperature swings broke 10 daily high maximum temperature records, 39 daily high minimum temperature records, 14 daily low maximum temperature records, and 33 daily low minimum temperature records.

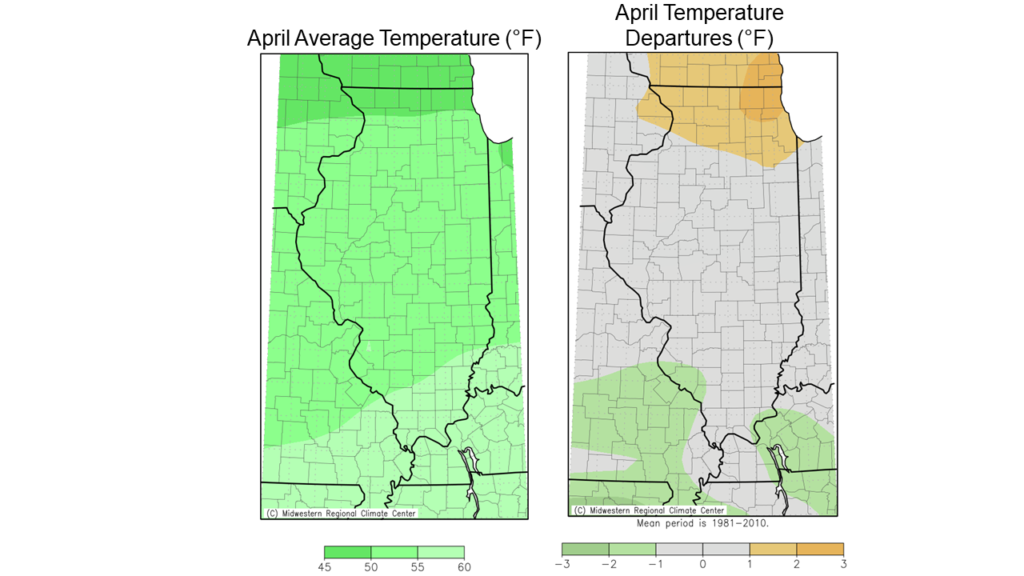
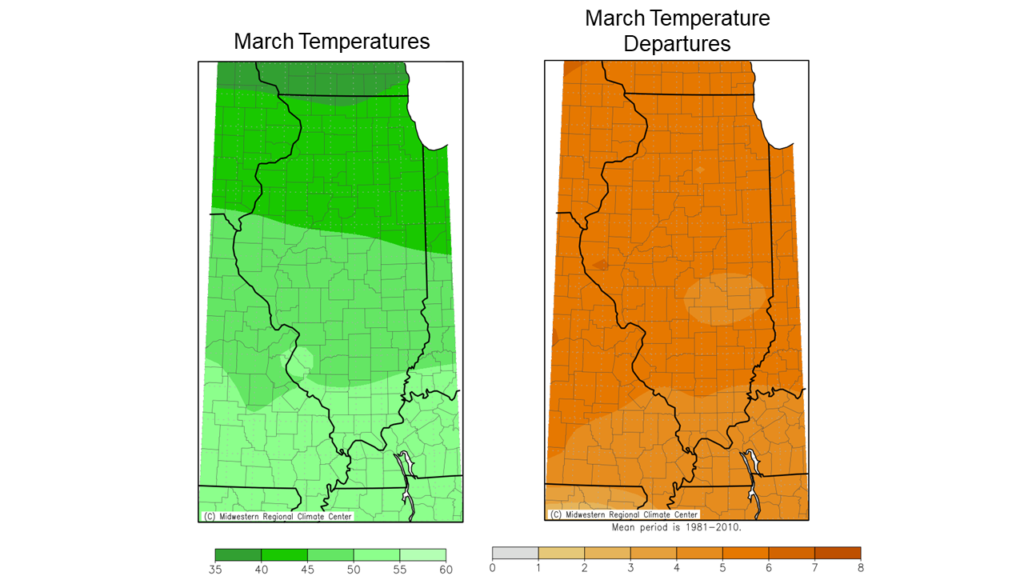
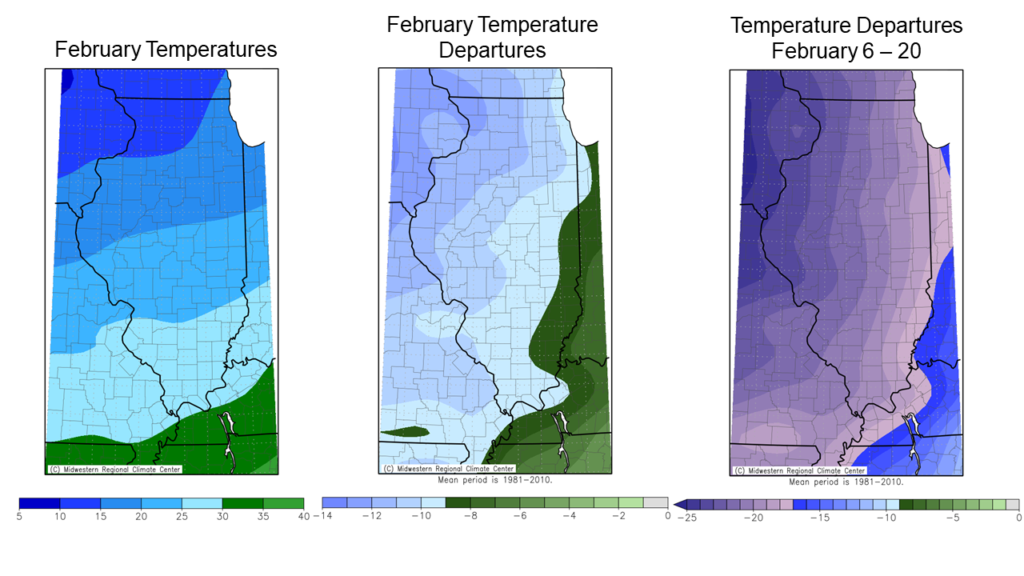
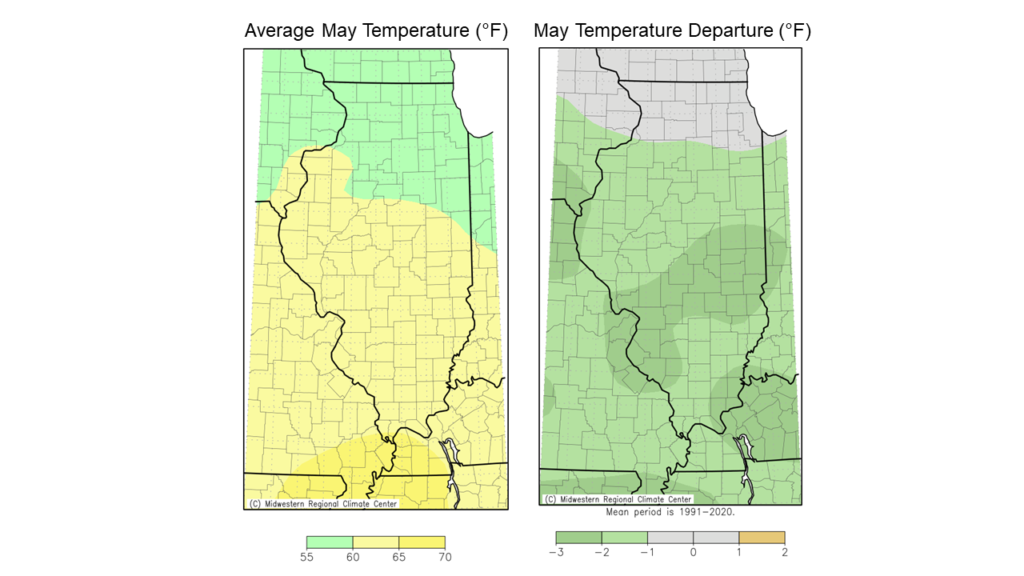
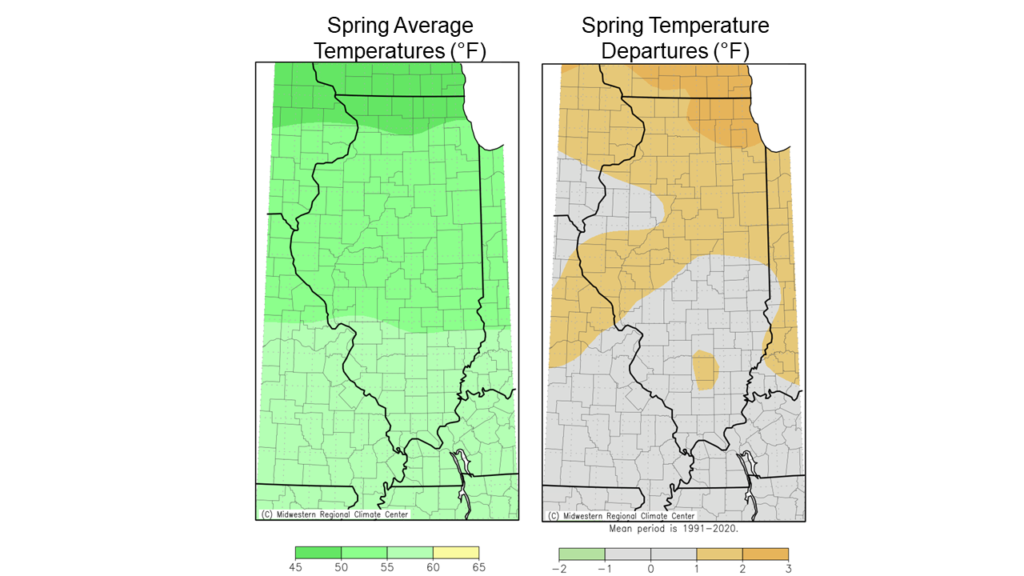
May average temperatures ranged from the high 50s in northern Illinois to the mid-60s in southern Illinois, between 1 and 3 degrees colder than normal in all but northern Illinois.

Figure 2. May average temperature (left) and departure from the 1981-2010 normal (right).

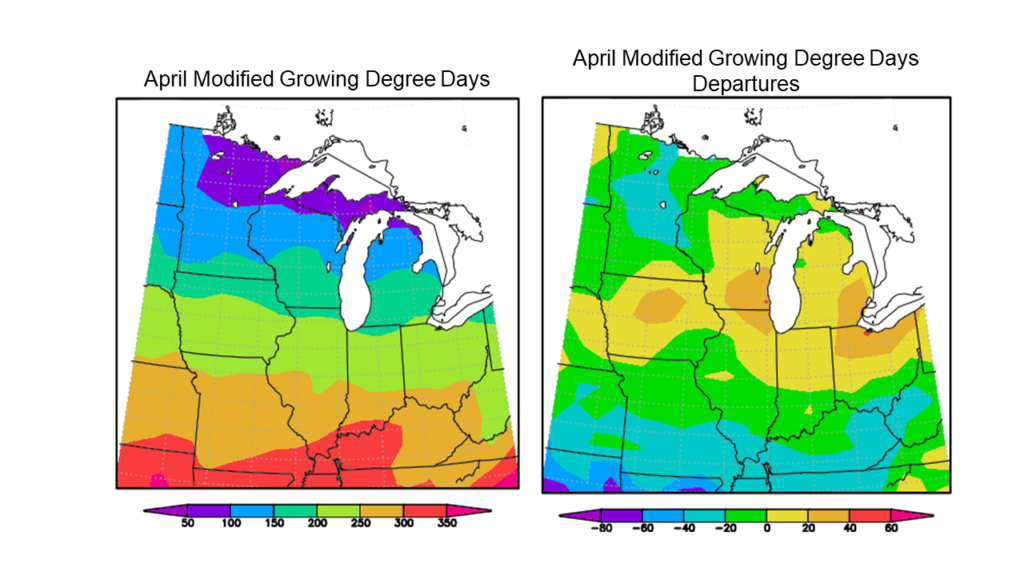
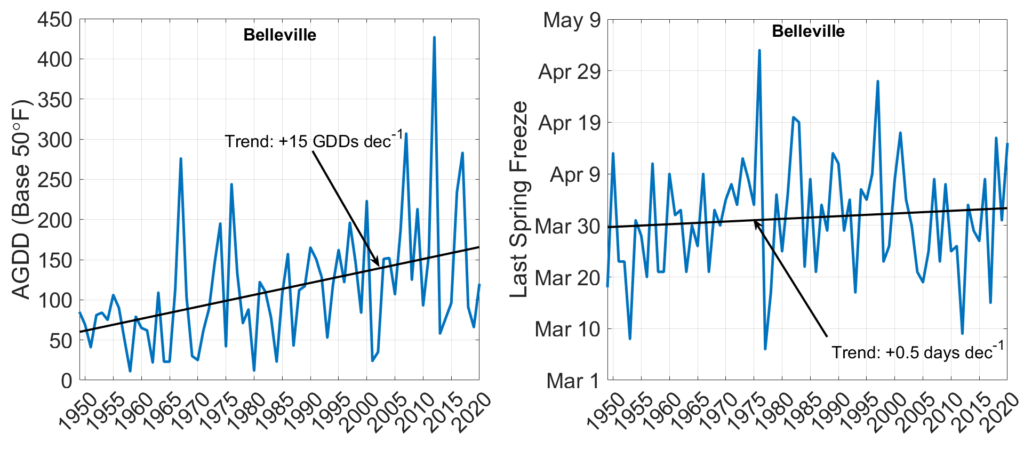
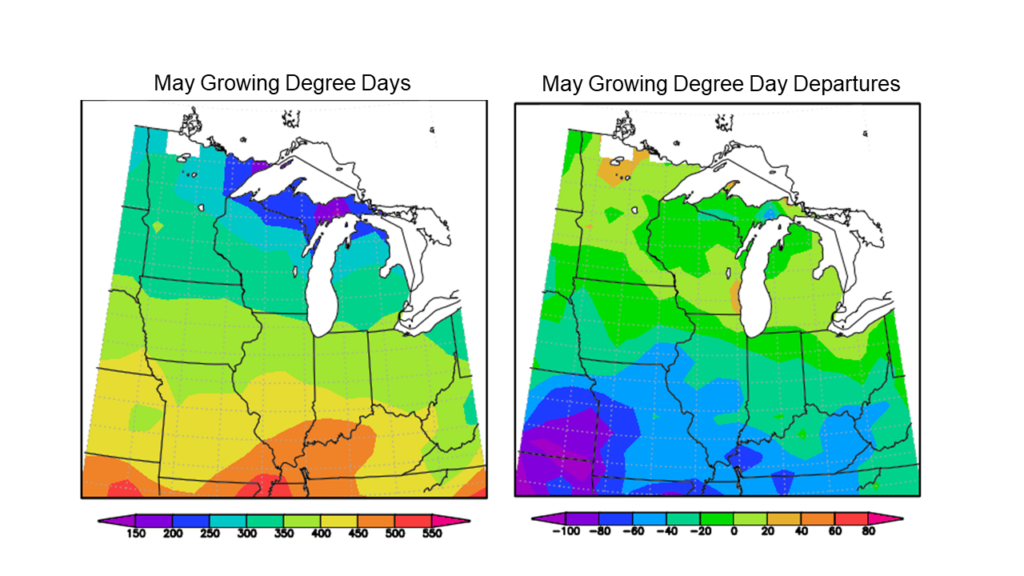
May temperatures kept growing degree accumulation below normal across the state. Base 50-degree modified growing degree day accumulation in May ranged from over 450 in southern Illinois to around 400 in northern Illinois. May growing degree day accumulation was between 10 and 60 below the 1991-2020 average across the state, with the largest departures in southern Illinois (Figure 3).  

Figure 3. Maps show May total base 50-degree modified growing degree day accumulation (left) and growing degree day departures from the 1991-2020 normal (right).

Overall, the preliminary statewide average May temperature was 60.8 degrees, 2.5 degrees below the 1991–2020 average and tied for 42nd coldest on record going back to 1895.

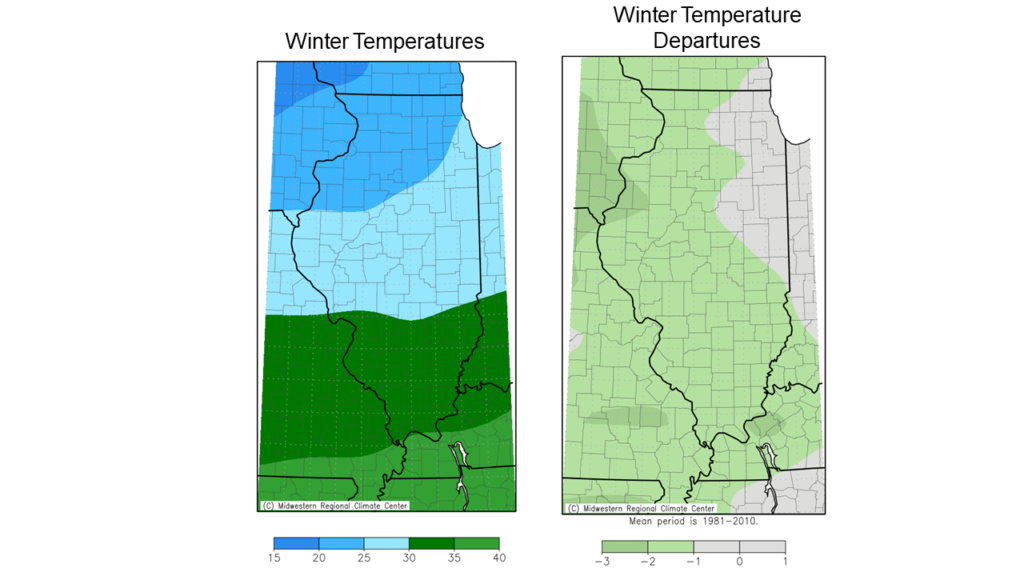
Average spring temperatures ranged from the high 40s in northern Illinois to the mid-50s in southern Illinois, between 2 and 3 degrees warmer than the 1991-2020 normal in northern Illinois and within 1 degree of normal in central and southern Illinois. Spring 2021 was the 6th warmest on record in Rockford (record back to 1893) and the warmest spring since 2012.

Figure 4. Maps show spring (March to May) average temperature and departure from 1991 to 2020 normal.

Wet West, Dry Elsewhere in May

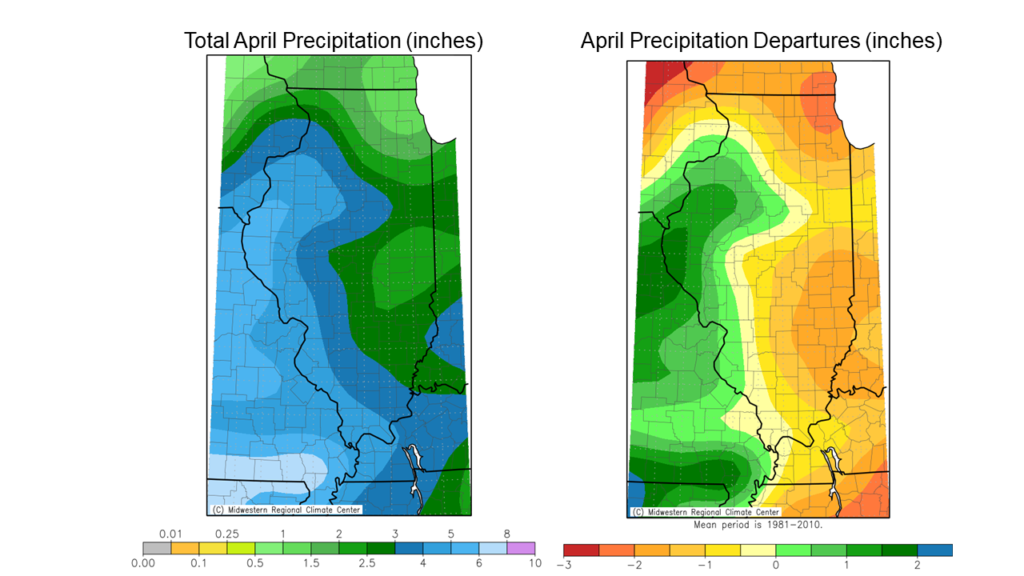
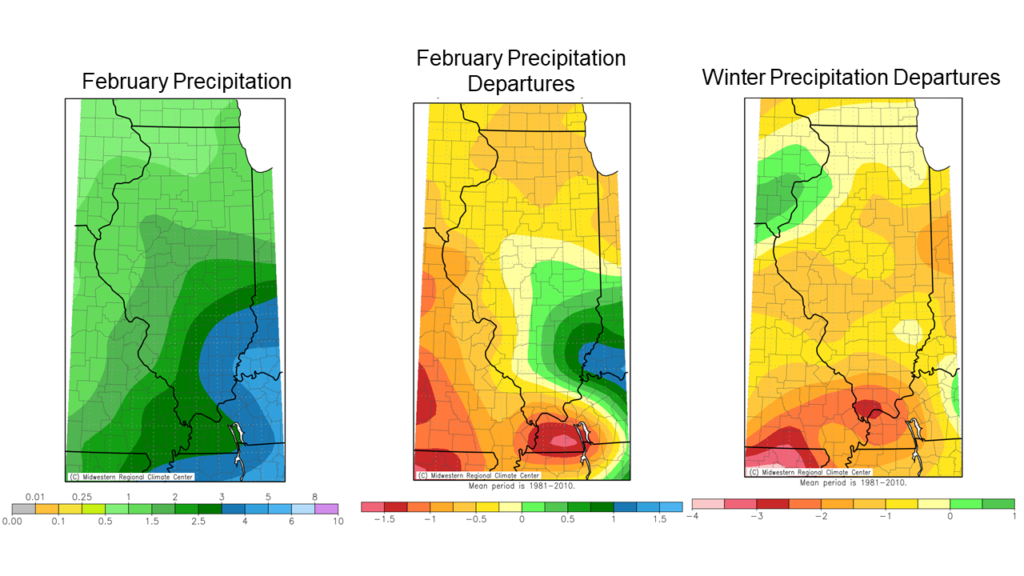
May precipitation was highly variable across Illinois. Monthly totals ranged from over 6 inches in western Illinois to less than 2 inches in far northern Illinois. These totals represent from a 2- to 3-inch surplus in western Illinois to 2- to 3-inch deficits in southwest and northeast Illinois, relative to the 1991-2020 normal.

Overall, the preliminary statewide average total May precipitation was 4.50 inches, 0.26 inches below the 1991–2020 average and tied for the 50th wettest on record going back to 1895.  

Figure 5. Maps show (left) total May precipitation and (right) total May precipitation departure from 1991-2020 normal.

Spring Drought Continues in Northern Illinois

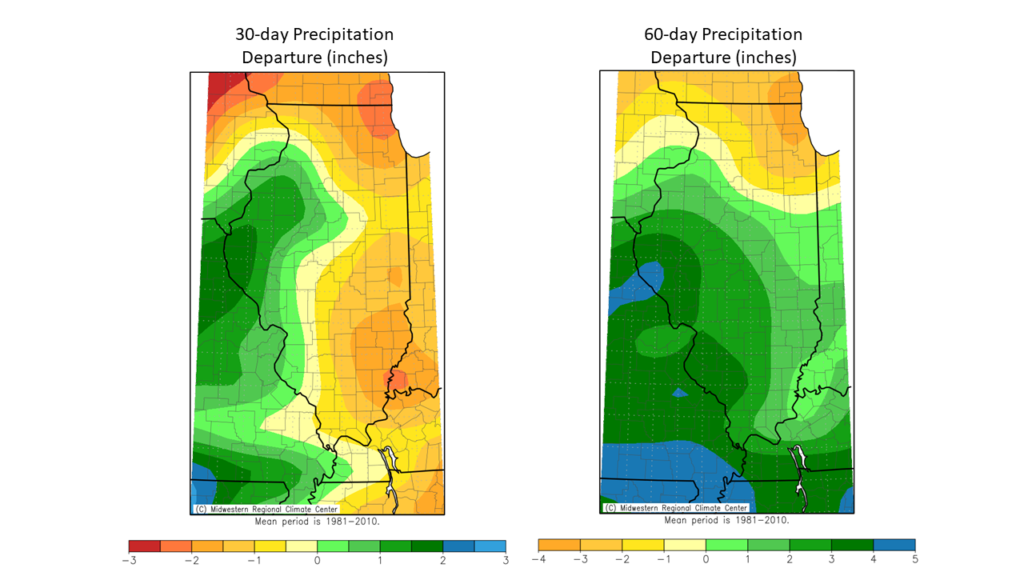
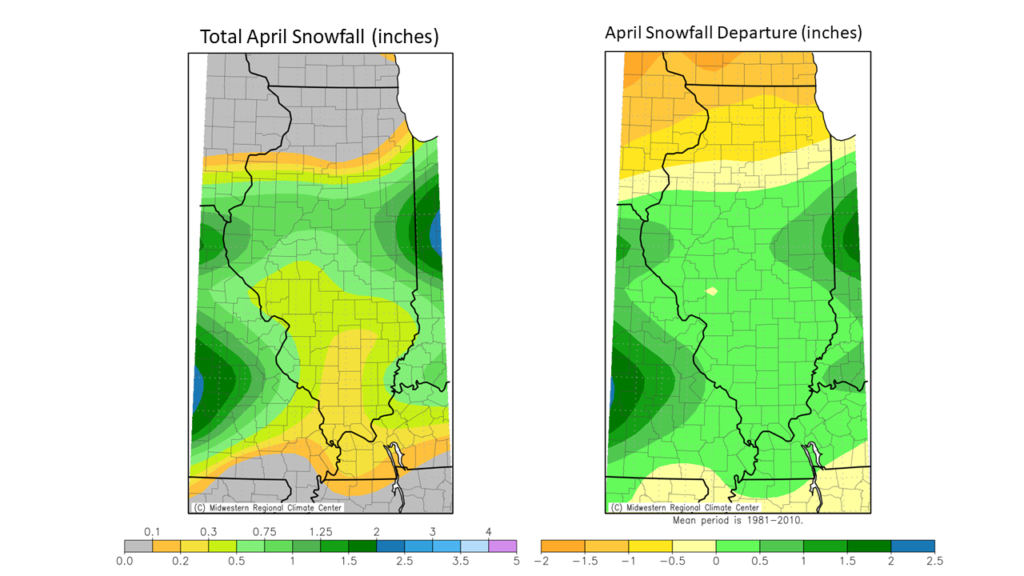
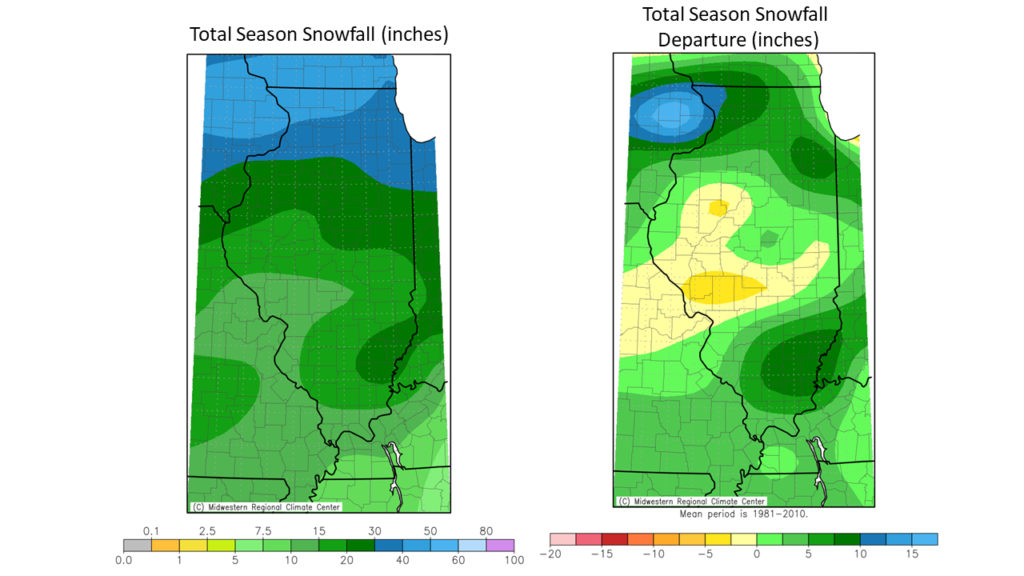
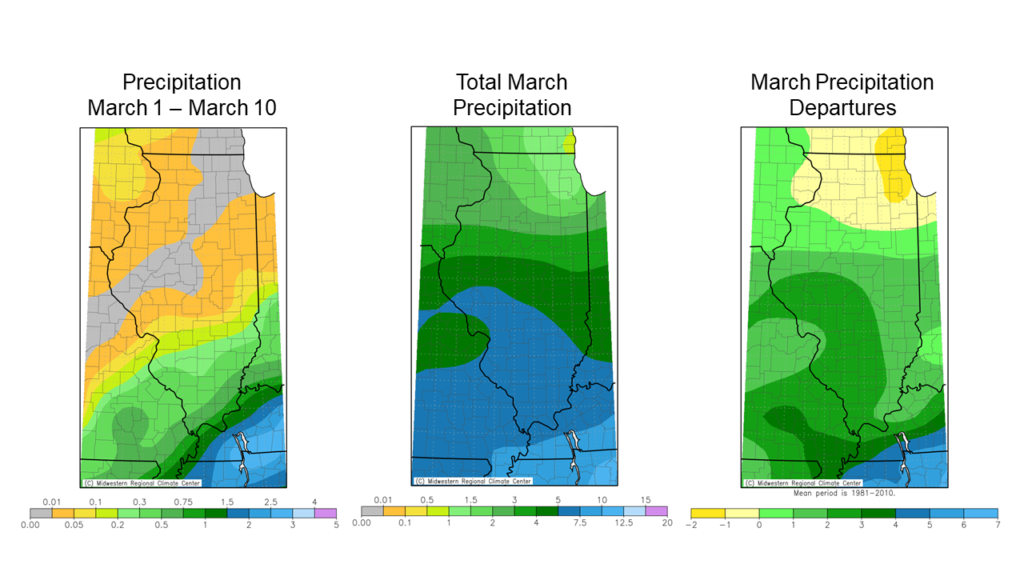
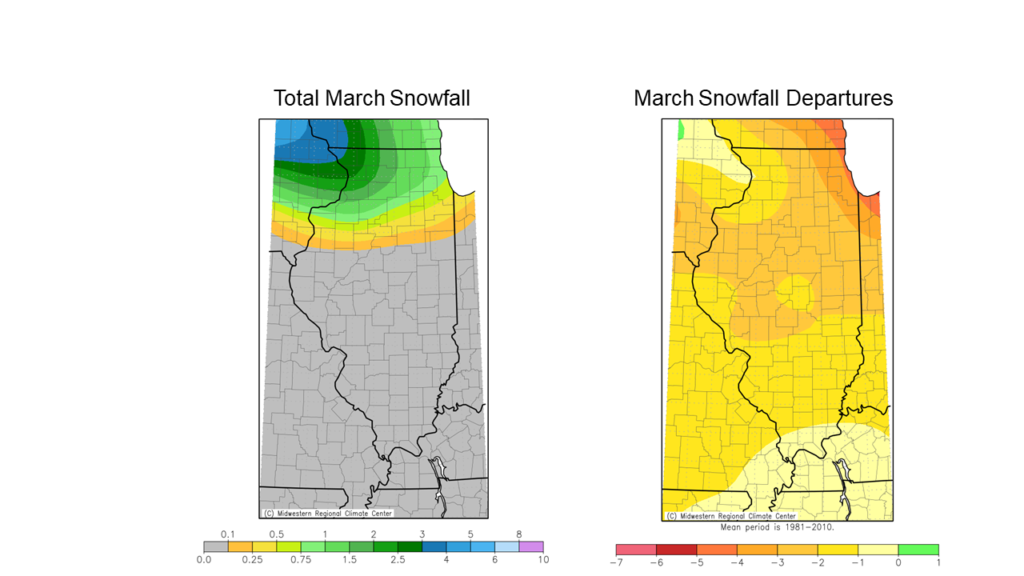
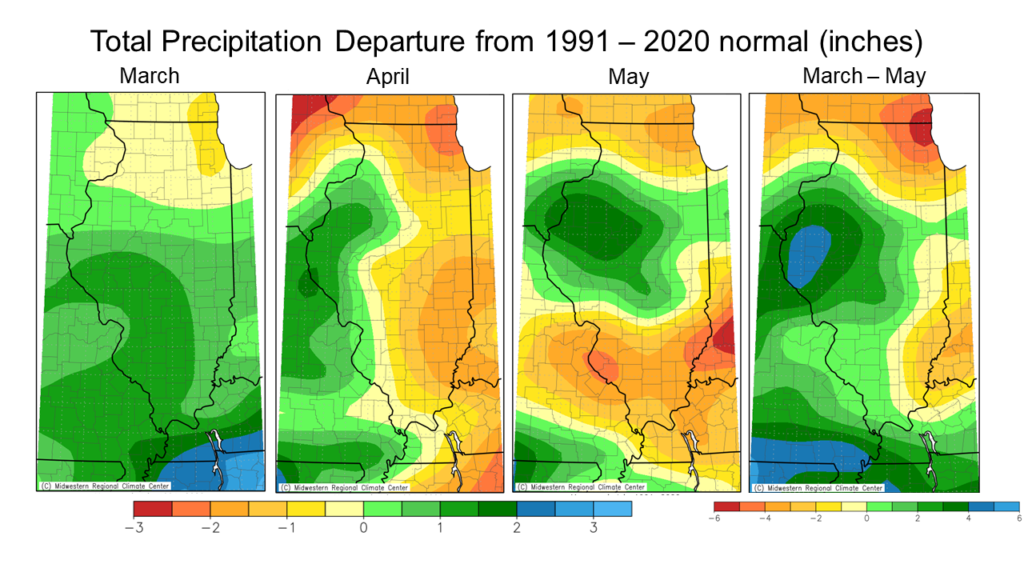
May marked the fourth consecutive month of below average precipitation in northeast Illinois. The maps below show total precipitation as a departure from the 1991-2020 normals for March, April, and May and the climatological spring. Through each of the three spring months, the northeast corner of the state experienced well below normal precipitation, culminating in a 6- to 7-inch precipitation deficit in northeast Illinois since March 1.   

Figure 6. Maps show March, April, and May and climatological spring (March – May) total precipitation as a departure from the 1991 to 2020 normal.

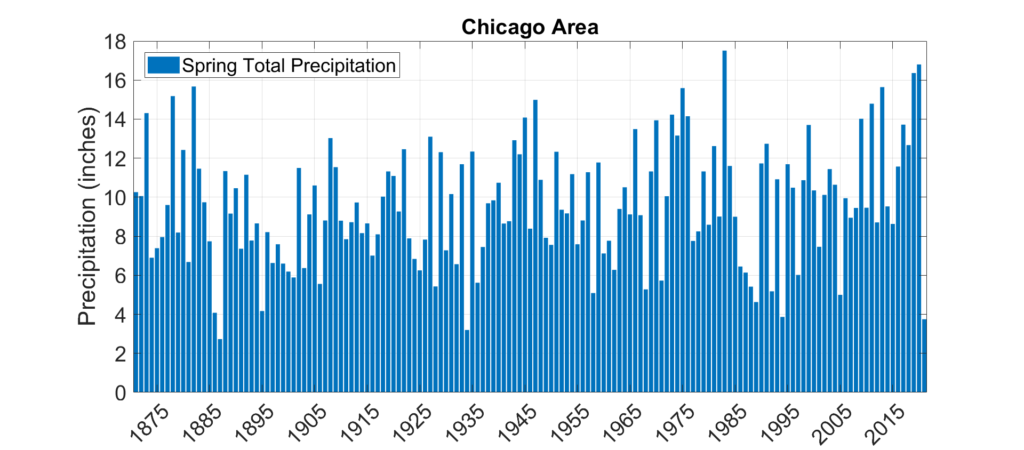
This spring ended as the third driest on record in Chicago (back to 1871) and the driest since 1934 with only 3.75 inches of total precipitation between March and May (Figure 7). For reference, the long-term average spring precipitation total in Chicago is 9.36 inches. Incredibly, this extremely dry spring followed the very wet springs of 2019 and 2020, which were the 2nd and 3rd wettest on record in Chicago.
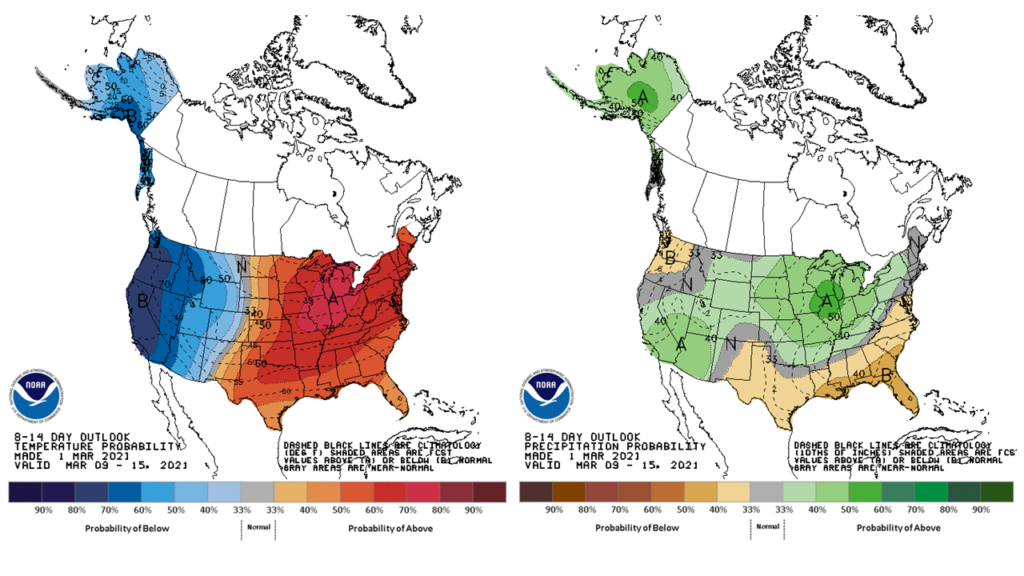
Figure 7. Total spring (March – May) precipitation in Chicago from 1871 to present.

Outlooks

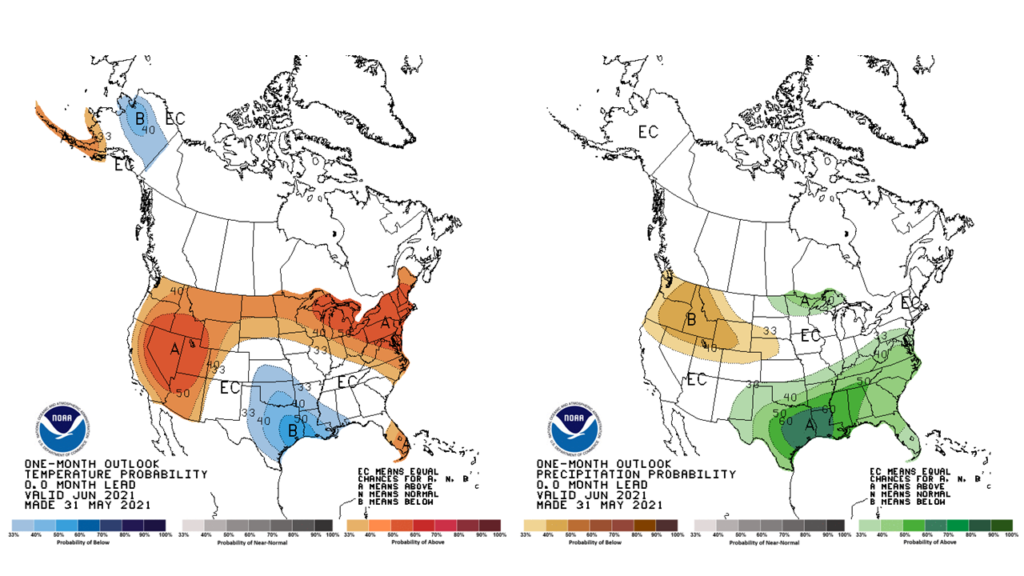
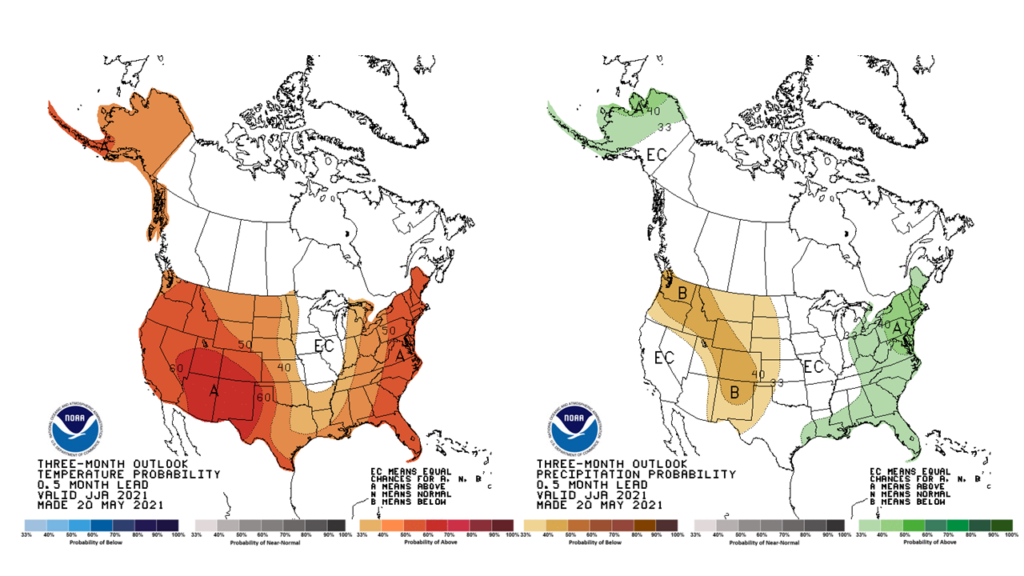
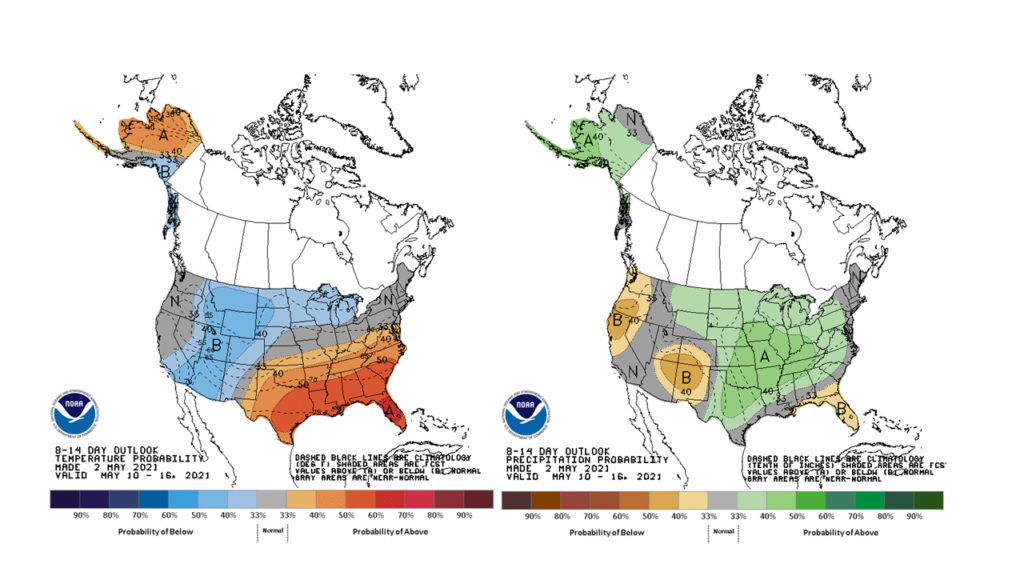
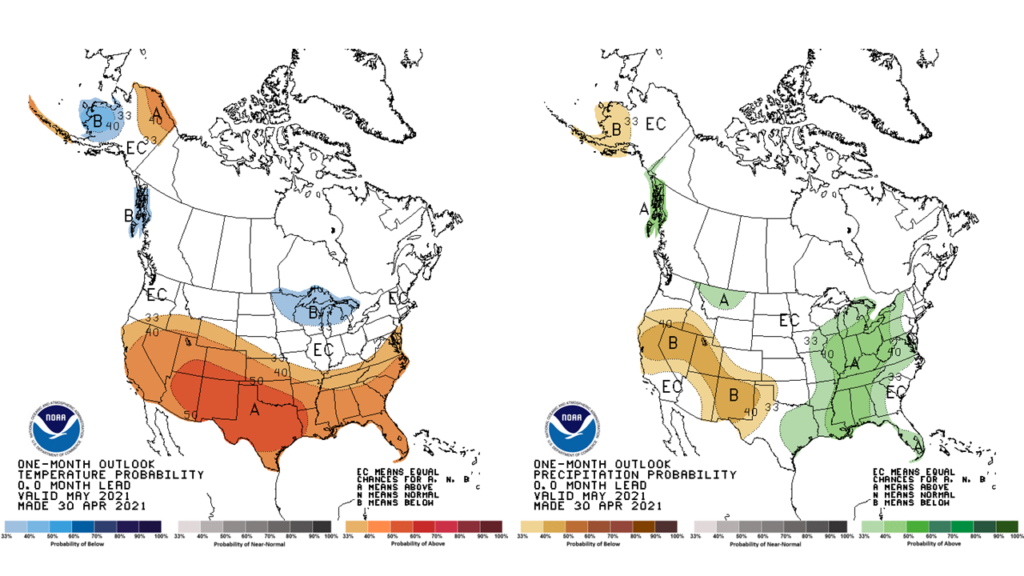
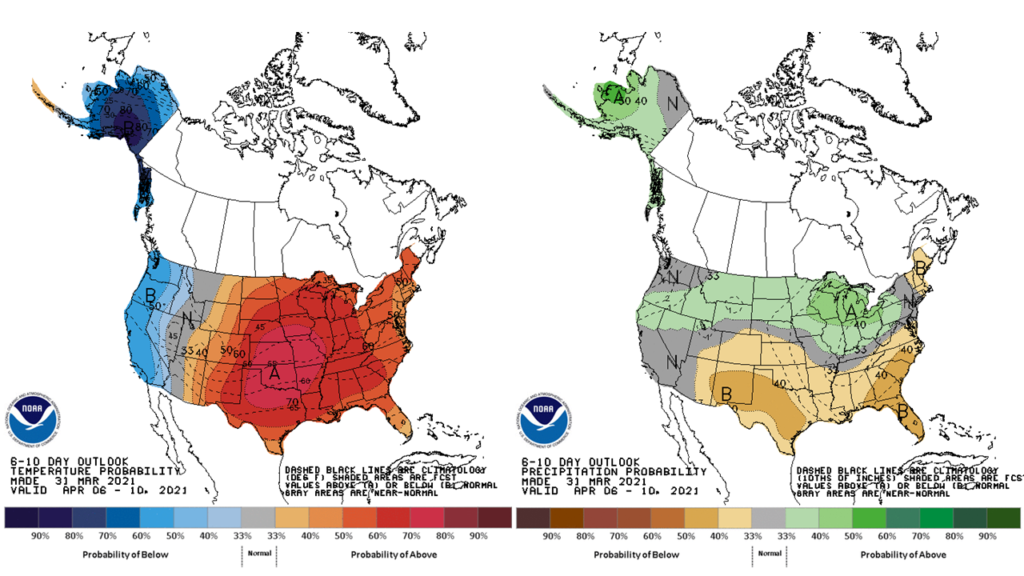
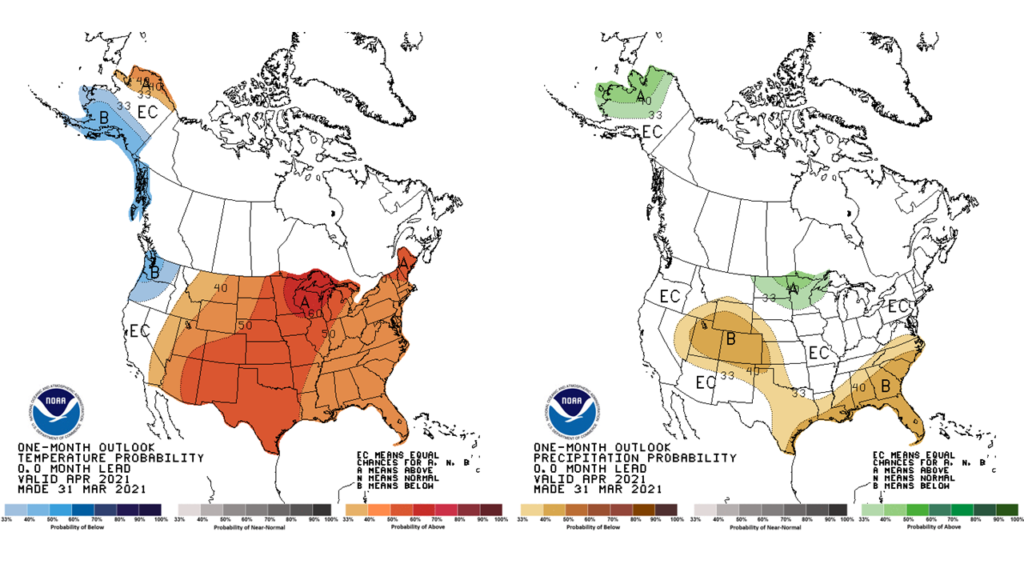
Summer is notoriously challenging for skillful seasonal climate prediction because of the lack of influence of large-scale patterns like the El Niño-Southern Oscillation (ENSO) on summer climate in the central U.S. The most recent 1-month and 3-month outlooks from the Climate Prediction Center reflect the relatively low confidence in summer climate prediction. Both the outlooks for June and those for climatological summer (June – August) show mostly equal chances of above normal, normal, and below normal temperature and precipitation across the state.

Without large-scale atmospheric conditions that are conducive to wetter weather in northern Illinois, amelioration of drought conditions will depend mostly on small-scale thunderstorms and precipitation from tropical systems, both of which are very difficult to forecast more than a few days ahead. Therefore, the Climate Prediction Center drought outlook shows drought in northern Illinois persisting through the month of June.

Figure 8. Climate Prediction Center Outlooks of (left) temperature and (right) precipitation for (top) June and (bottom) June – August.

April Brought a Mix of Winter, Spring, and Summer Weather

The preliminary statewide average April temperature was 52.1 degrees, 0.5 degrees above the 1991–2020 average and tied for the 48th warmest on record going back to 1895. The preliminary statewide average total April precipitation was 3.16 inches, 1.08 inches below the 1991–2020 average and the 51st driest on record.  

Data are provisional and may change slightly over time

April Temperature Rollercoaster

Temperatures varied considerably this past month, as the plot of daily temperature departures from Jacksonville shows below (Figure 1). Average temperatures ranged between 5 and 20 degrees above normal in the first week to 10 days of the month, followed by a dramatic cool down. Average temperatures in the third week of April ranged from 5 to 20 degrees below normal.

Figure 1. Daily temperatures in Jacksonville, expressed as a departure from the long-term average.

As the maps below show, April average temperatures ranged from the high 40s in northern Illinois to high 50s in southern Illinois, slightly warmer than normal in northern Illinois and slightly cooler than normal in southern Illinois. Temperatures during the warm start and end to last month broke 36 daily high maximum temperature records and 55 high minimum temperature records statewide. The cool down in the middle of April resulted in 39 daily low maximum temperature records and 44 daily low minimum temperature records broken statewide.

Figure 2. April average temperature (left) and departure from the 1981-2010 normal (right).

Base 50-degree modified growing degree day accumulation in April ranged from over 250 in southern Illinois to around 150 in northern Illinois. As the maps below show, growing degree day accumulation is between 20 and 30 below the 1981-2010 average in the southern half of the state, and 10 to 20 above average in the northern half of the state (Figure 3).

Figure 3. Maps show April total base-50 degree modified growing degree day accumulation (left) and growing degree day departures from the 1981-2010 normal (right).

The mid-month cool down also affected soil temperatures across the state. The plot below shows 4-inch bare soil temperatures measured at the Illinois Climate Network stations in Monmouth, Champaign, and Carbondale. April began with soil temperatures in the low to mid-40s, but temperatures quickly increased in response to warm, dry weather. Soil temperatures reached 60 degrees for the first time in the season in the first week of the month, but quickly regressed back into the 50s and 40s and remained there until the final week of the month. Drier soil conditions combined with warmer weather in the final week of April caused soil temperatures to increase rapidly, and the month ended with 4-inch bare soil temperatures near or above 60 degrees statewide.

Overall, the preliminary statewide average April temperature was 52.1 degrees, 0.5 degrees below the 1991–2020 average and tied for 48th warmest on record going back to 1895.

East-West Precipitation Divide

April precipitation was highly variable from west to east. Month-long totals ranged from just over 6 inches in far western Illinois to less than an inch in northeast Illinois. These totals ranged from nearly 2 inches wetter than the 1981–2010 average April total precipitation to more than 2 inches drier than the average. Last month was the driest April on record at Chicago’s O’Hare Airport, with a total of 0.71 inches. Meanwhile, the stout 6.76 inches observed last month in Quincy was the sixth highest April precipitation total on record there.

Figure 4. Maps show (left) total April precipitation and (right) April total precipitation departure from 1981-2010 normal.

Dry April weather followed a relatively dry March in northeast Illinois. The maps below show precipitation departures from the 1981–2010 average over the past 30 and 60 days. Most of the area from Winnebago to Kankakee Counties is experiencing a 1.5- to 2.0-inch precipitation deficit over the past 30 days and a 2- to 4-inch deficit over the past 60 days. In response, the latest version of the U.S. Drought Monitor shows moderate drought across the northeast corner of the state, and abnormal dryness along the Indiana Border from Lake Michigan to the Ohio River.

April Snow (Hopefully) Brings an End to Winter Weather

We were all done with winter, but it was not finished with us. The dramatic cool down in mid-April brought a late spring snowfall to much of the state. April snowfall totals ranged from just under a tenth of an inch in most of far northern and southern Illinois, to nearly 2 inches in east-central Illinois.

April snowfall ranged from normal in northern Illinois to highly unusual south of Interstate 64. The measurable snowfall on April 21 this year was the third latest on record in Champaign, the fourth latest on record in Peoria, and the latest on record in Belleville. The long-term station in Normal only has recorded observable snowfall after April 15 in 9 out of 117 years of record but has observed snowfall after April 15 in each of the past four years.
The maps below show total winter season snowfall and departures from the 1981–2010 normal. Total season snowfall, back to October 2020, ranged from nearly 50 inches in northwest Illinois to just under 10 inches in southern and southwest Illinois. Most of northern and southern Illinois received 5 to 10 inches more snowfall than the 30-year average, whereas central Illinois was within 5 inches of the 30-year average. Stockton in Jo Daviess County recorded 49 inches of snowfall this past season, the 11th highest on record and snowiest since 2014.

Overall, the preliminary statewide average total April precipitation was 3.61 inches, 1.08 inches below the 1991–2020 average and the 51st driest on record going back to 1895.

Outlooks

The Climate Prediction Center outlooks suggest wetter conditions ahead for the Midwest. The 8- to 14-day outlook for the second week of May shows elevated odds of wetter than normal conditions, and the highest odds of near normal temperatures.

Looking at the whole month of May, the 1-month Climate Prediction Center outlooks also show elevated odds of wetter than normal conditions for this month, with an equal chance of above and below normal temperatures in May.

Mild March Was Quite a Contrast to February

The preliminary statewide average March temperature was 45.9 degrees, 4.5 degrees above the 1991–2020 average and the 13th warmest on record going back to 1895. Preliminary statewide average total March precipitation was 4.10 inches, 1.16 inches above the 1991–2020 average and the 30th wettest on record going back to 1895.  

Data are provisional and may change slightly over time

Warm Start to Spring

Our suffering in February was rewarded by persistent mild temperatures in March. Figure 1 shows 23 out of 31 March days were warmer than the 1991–2020 average in the village of Normal. 

Figure 1. Daily temperatures in Normal, expressed as a departure from the long-term average.

As the maps below show, March average temperatures ranged from the low 40s in northern Illinois to low 50s in southern Illinois, which was between 3 and 5 degrees above the 1981–2010 normal (Figure 2). Last month, 20 daily high maximum temperature records and 16 daily high minimum temperature records were broken statewide. Chicago’s O’Hare Airport recorded a minimum temperature of 57 degrees on March 10, which broke the previous daily high minimum temperature record by 11 degrees.

Figure 2. February average temperature (left) and departure from the 1981-2010 normal (right).

The persistent warmth last month accelerated growing degree day accumulation and prompted an earlier than normal spring greening, the result of which was earlier stone fruit blooms. Unfortunately, an early bloom increases the risk of significant freeze damage to vulnerable crops such as peaches and cherries. This pattern is consistent with longer trends in early spring growing degree day accumulation. Figure 3 shows base 50 growing degree day accumulation between January 1 and April 1 each year and the date of the last spring 28-degree freeze between 1949 and 2020 in Belleville.

Figure 3. (Left) Accumulated base 50-degree growing degree day accumulation between January 1 and April 1 in Belleville. (Right) the date of last spring’s 28-degree freeze in Belleville. Trends are calculated over the period 1949 to 2020.

Growing degree day accumulation in the first three months of the year in Belleville shows a strong increase over the past seven decades, with a trend of 15 additional growing degree days per decade. Concurrently, the date of the last spring freeze has not changed significantly over that same time period and overall exhibits quite a bit of year-to-year variability. The combination of increasing heat accumulation in the first three months of the year with no appreciable change in the last spring freeze results in an overall increased risk of freeze damage to tender perennials and fruit trees.

The preliminary statewide average March temperature was 45.9 degrees, 4.5 degrees above the 1991–2020 average and the 13th warmest on record going back to 1895. In fact, last month was the warmest March statewide since 2012; however, the statewide average temperature last month was still nearly 10 degrees below that in 2012, demonstrating how unusually warm March 2012 was.

Have and Have Nots of March Rain

The first third of last month was very dry across the state. As the maps in Figure 4 show, most of the state north of Interstate 64 received less than 0.05 inches of precipitation in the first 10 days of March. A pattern change around the middle of the month brought several rounds of storms and heavier rain to southern and central Illinois. One CoCoRaHS observer south of Carbondale in Jackson County observed 3.98 inches of rain on March 12. In all, March total precipitation ranged from just over 1 inch in northeast Illinois to over 5 inches throughout most of southern Illinois. March precipitation departures ranged from nearly 3 inches above the 1981–2010 normal in southwest Illinois to nearly 2 inches below the 1981–2010 normal in northeast Illinois.

Figure 4. Maps show (left) total precipitation between March 1 and 10, (middle) total precipitation for the entire month, and (right) March total precipitation departure form 1981-2010 normal.

The heavier precipitation was received either well or poorly depending on the part of the state. Southern Illinois soils were previously at or above normal moisture levels coming into March, so the additional precipitation resulted in standing water in fields and minor to moderate flooding along the Big Muddy River and Wabash River, among others in the region. However, the rain was welcome on drier central Illinois soils. In response to the improvement in moisture conditions in central Illinois, the U.S. Drought Monitor removed all moderate drought in its March 16 map; the first time Illinois was free of drought since August 2020.

March isn’t usually an exceptionally snowy month, but most of the state will typically see some flakes in the first month of spring. Snowfall last month was well below normal statewide, attributable to the mild temperatures. Total March snowfall ranged from less than a quarter of an inch in north-central Illinois to just over 4 inches in northwest Illinois. March snowfall departures ranged from less than an inch below normal in far southern Illinois to nearly 5 inches below normal in northeast Illinois.

Figure 5. Maps show (left) total March snowfall and (right) snowfall departures from 1981-2010 normal.

Overall, the preliminary statewide average total March precipitation was 4.10 inches, 1.16 inches above the 1991–2020 average and the 30th wettest on record going back to 1895.  

Outlooks

Once past these first, cooler days in April, the Climate Prediction Center outlooks suggest warmer conditions are ahead. The 6–10-day outlook for the second week of April shows strongly elevated odds (70% to 80%) of warmer than normal conditions, with only slightly elevated odds of wetter than normal conditions. The warm, dry pattern to start the month will certainly help further progress spring greening.

Looking at the month of April as a whole, the 1-month Climate Prediction Center outlooks also show elevated odds of warmer than normal conditions, with an equal chance of above and below normal precipitation in April.

Figure 6. maps show temperature (left) and precipitation (right) outlooks for the second week of April (top maps) and the month of April as a whole (bottom maps).

A Wild February Ended an Otherwise Mild Winter

Who ordered winter? The cold season came with a vengeance in February, bringing bitter cold and snow across the state. The preliminary statewide average February temperature was 20.0 degrees, 11.1 degrees below the 1991–2020 average and the 10th coldest on record going back to 1895. Preliminary statewide average total February precipitation was 2.01 inches, 0.10 inches below the 1991–2020 average and tied for the 51st wettest on record going back to 1895.  

Data are provisional and may change slightly over time

February Can Still Be Cold

Winter average temperatures in Illinois have increased by 0.20 degrees per decade since 1895 and by 0.80 degrees per decade since 1970. Two thirds of the 2020-21 winter season followed this pattern, but February did not abide. The plot in Fig. 1 shows daily February temperatures as a departure of the 1981–2010 normal in Monmouth. Average temperatures on all but one day between February 7 and February 18 in Monmouth were at least 25 degrees below the 30-year normal, and many were more than 30 degrees below normal. Most places in Illinois experienced at least 20 days of below normal temperatures in February, following fewer than 20 days with below normal temperatures in January and December combined.


Figure 1. Daily temperatures in Monmouth, expressed as a departure from the long-term average.

The extreme cold broke 218 daily low maximum temperature records and 81 daily low minimum temperature records at stations around Illinois, from Galena to Cairo. No February low maximum and minimum temperature records were broken last month. However, among stations with at least 30-year records, last month was the coldest February on record in Dixon, Du Quoin, Olmsted, Carmi, and Mt. Vernon. Some of the most extreme observed temperatures include -21 degrees in Altona and Mt. Carroll, -17 in Aurora, and -15 in Moline.

As the maps below show, February average temperatures ranged from the low teens in northwest Illinois to the high 20s in southern Illinois, which was between 8 and 14 degrees below the 1981–2010 normal (Figure 2). The two-week stretch during February 620 exhibited temperatures between 18 and 25 degrees below the 1981-2010 normal across the state.

Figure 2. February average temperature (left) and departure from the 1981-2010 normal (middle). Right map shows average temperature departures between February 6 and 20.

The preliminary statewide average February temperature was 20.0 degrees, 11.1 degrees below the 1991-2020 average and 10th coldest on record going back to 1895. February propelled the 2020-21 winter season temperatures below the 1981-2010 normal, despite a warmer than normal January and December. Winter average temperatures ranged from the high teens in northern Illinois to the high 30s in southern Illinois, between 0 and 4 degrees below normal (Fig. 3).

Figure 3. Winter season (December–February) average temperatures (left) and departures from 1981–2010 normal (right).

More Snow Than Rain

February was noteworthy not only for extremely cold weather, but also for exceedingly high snowfall totals. The position of the subpolar jet stream created an active winter storm track across the state, bringing multiple heavy snowfall events. One storm in particular produced 10 to 20 inches of snow in a 24-hour period in the northeast part of the state. This included 13 inches observed in Kankakee on February 16 alone, which was the largest single day snowfall total on record in Kankakee. February snowfall totals ranged from just under 34 inches in the northern Chicago suburbs to about 3 inches in Mt. Vernon.

The maps below show February total snowfall ranged from 8 inches in southwest Illinois to over 30 inches in northeast Illinois, between 5 and 15 inches above the 1981–2010 normal (Fig. 4). The incredibly snowy month pushed winter season totals above normal across most of the state.

Figure 4. Maps show total February snowfall (left) and departure from 1981-2010 normal (middle). The right map shows total winter season snowfall departures from normal. All maps are in units of inches.

Because February snow fell from very cold air, it did not produce a large amount of equivalent liquid precipitation. February total precipitation ranged from just over an inch in far northern Illinois to just over six inches in southeast Illinois. All areas except for the southeast quadrant were a tenth to one inch drier than the 1981–2010 normal in February. Combined with drier than average months in January and December, most parts of the state experienced a winter season that was one-half inch to three inches drier than normal (Fig. 5).

Figure 5. February total precipitation (left) and departure from the 1981–2010 normal (middle). The right map shows winter season total precipitation departure from normal.

Overall, preliminary statewide average total February precipitation was 2.01 inches, 0.10 inches below the 1991–2020 average and tied for the 51st wettest on record going back to 1895.  

Outlooks

Both the short-term 8- to 14-day outlooks and the one-month March outlooks from the Climate Prediction Center show strongly elevated odds of warmer than normal conditions this month. The outlooks also indicate the highest odds of wetter than normal conditions in the first half and through the entirety of March (Fig. 6). Lastly, the newest three-month outlooks for climatological spring (March–May) also indicate the highest odds of warmer and wetter than normal conditions.

Figure 6. Temperature (left) and precipitation (right) outlooks from the Climate Prediction Center for the period March 9th to 15th.
Figure 7. Temperature (left) and precipitation (right) outlooks from the Climate Prediction Center for the entire month of March.