The preliminary statewide average April temperature was 52.1 degrees, 0.5 degrees above the 1991–2020 average and tied for the 48th warmest on record going back to 1895. The preliminary statewide average total April precipitation was 3.16 inches, 1.08 inches below the 1991–2020 average and the 51st driest on record.
Data are provisional and may change slightly over time
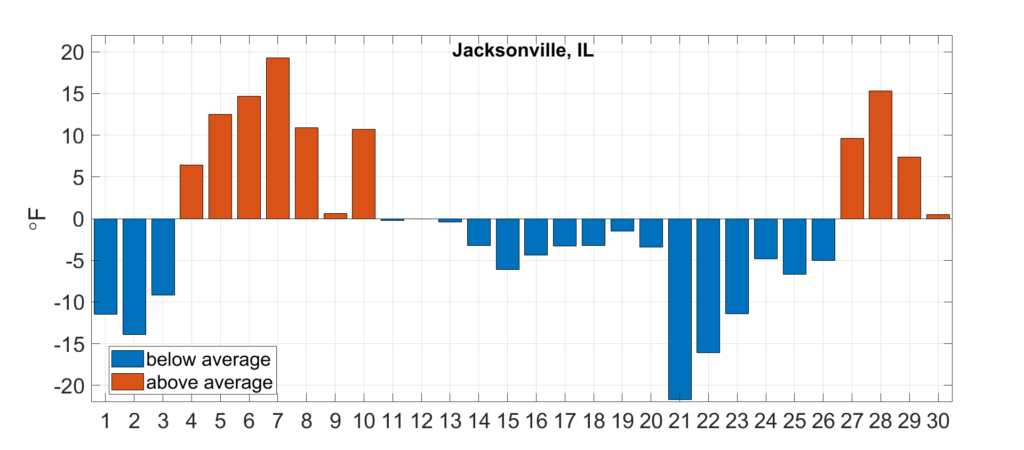
April Temperature Rollercoaster
Temperatures varied considerably this past month, as the plot of daily temperature departures from Jacksonville shows below (Figure 1). Average temperatures ranged between 5 and 20 degrees above normal in the first week to 10 days of the month, followed by a dramatic cool down. Average temperatures in the third week of April ranged from 5 to 20 degrees below normal.
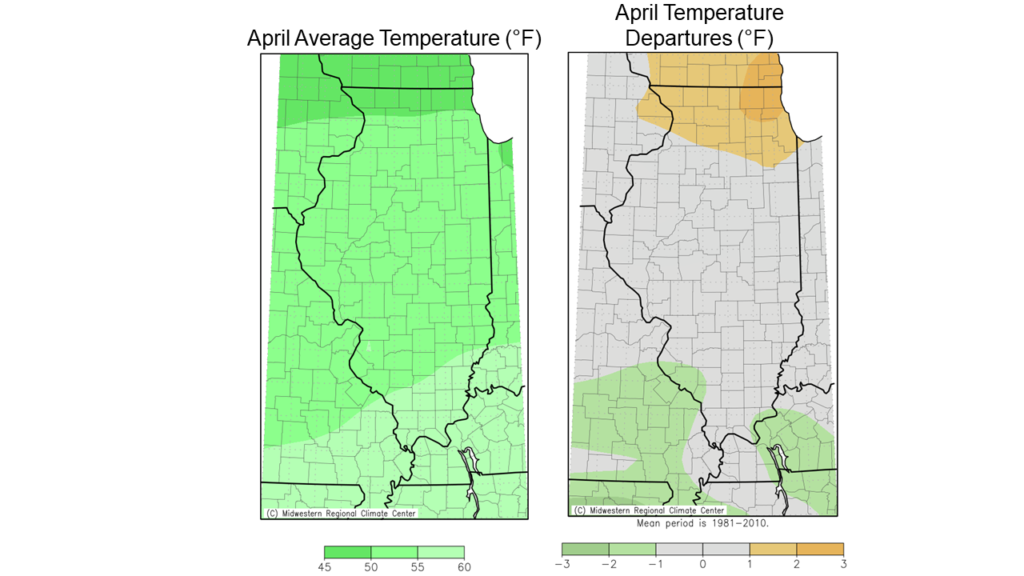
As the maps below show, April average temperatures ranged from the high 40s in northern Illinois to high 50s in southern Illinois, slightly warmer than normal in northern Illinois and slightly cooler than normal in southern Illinois. Temperatures during the warm start and end to last month broke 36 daily high maximum temperature records and 55 high minimum temperature records statewide. The cool down in the middle of April resulted in 39 daily low maximum temperature records and 44 daily low minimum temperature records broken statewide.
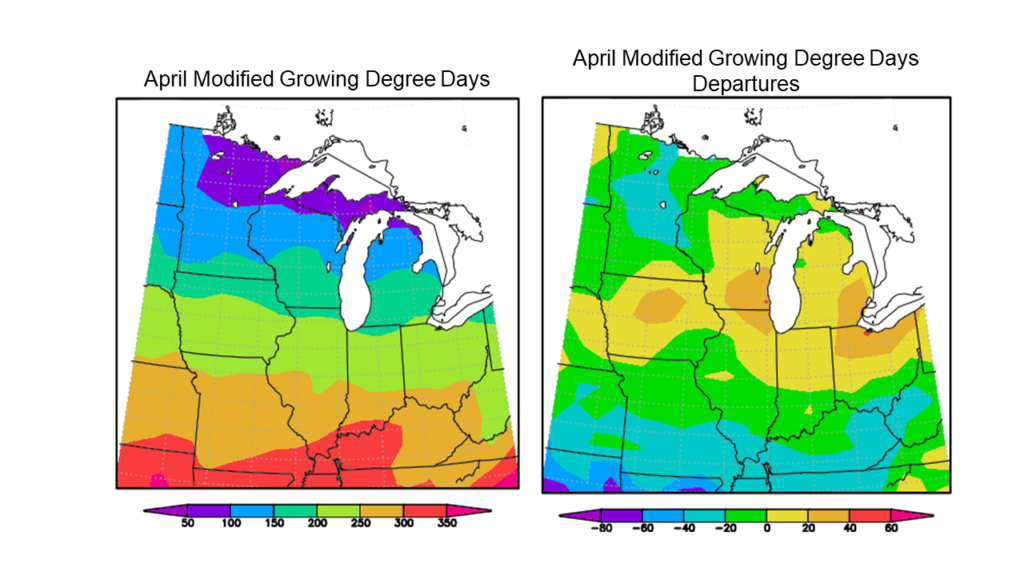
Base 50-degree modified growing degree day accumulation in April ranged from over 250 in southern Illinois to around 150 in northern Illinois. As the maps below show, growing degree day accumulation is between 20 and 30 below the 1981-2010 average in the southern half of the state, and 10 to 20 above average in the northern half of the state (Figure 3).
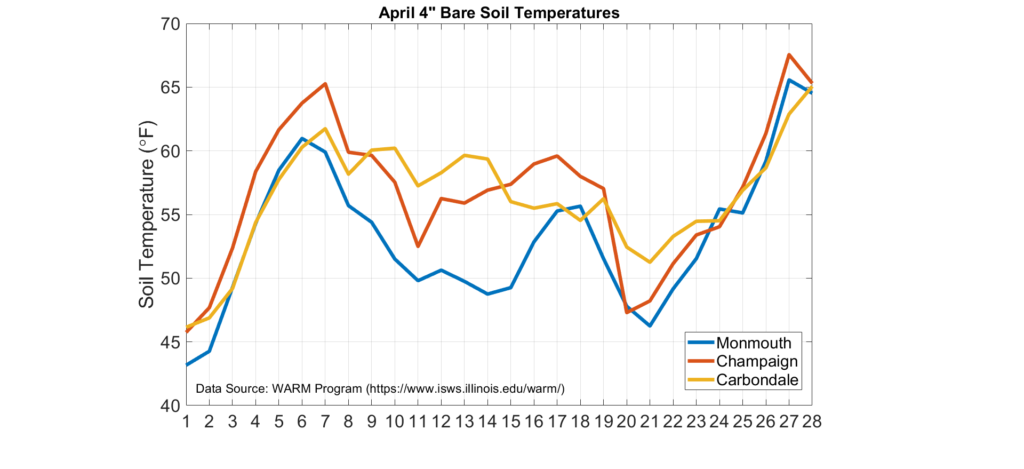
The mid-month cool down also affected soil temperatures across the state. The plot below shows 4-inch bare soil temperatures measured at the Illinois Climate Network stations in Monmouth, Champaign, and Carbondale. April began with soil temperatures in the low to mid-40s, but temperatures quickly increased in response to warm, dry weather. Soil temperatures reached 60 degrees for the first time in the season in the first week of the month, but quickly regressed back into the 50s and 40s and remained there until the final week of the month. Drier soil conditions combined with warmer weather in the final week of April caused soil temperatures to increase rapidly, and the month ended with 4-inch bare soil temperatures near or above 60 degrees statewide.
Overall, the preliminary statewide average April temperature was 52.1 degrees, 0.5 degrees below the 1991–2020 average and tied for 48th warmest on record going back to 1895.
East-West Precipitation Divide
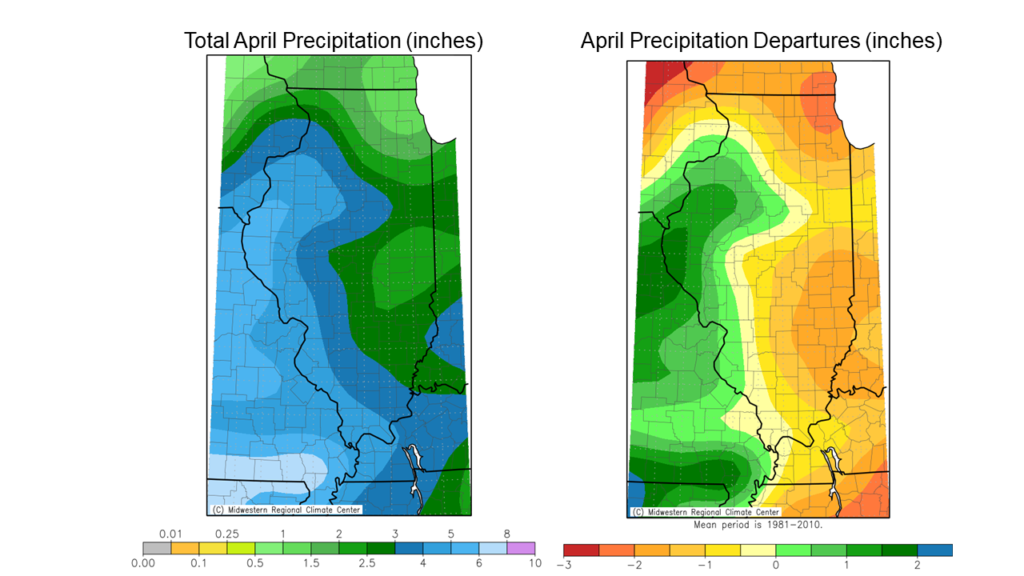
April precipitation was highly variable from west to east. Month-long totals ranged from just over 6 inches in far western Illinois to less than an inch in northeast Illinois. These totals ranged from nearly 2 inches wetter than the 1981–2010 average April total precipitation to more than 2 inches drier than the average. Last month was the driest April on record at Chicago’s O’Hare Airport, with a total of 0.71 inches. Meanwhile, the stout 6.76 inches observed last month in Quincy was the sixth highest April precipitation total on record there.
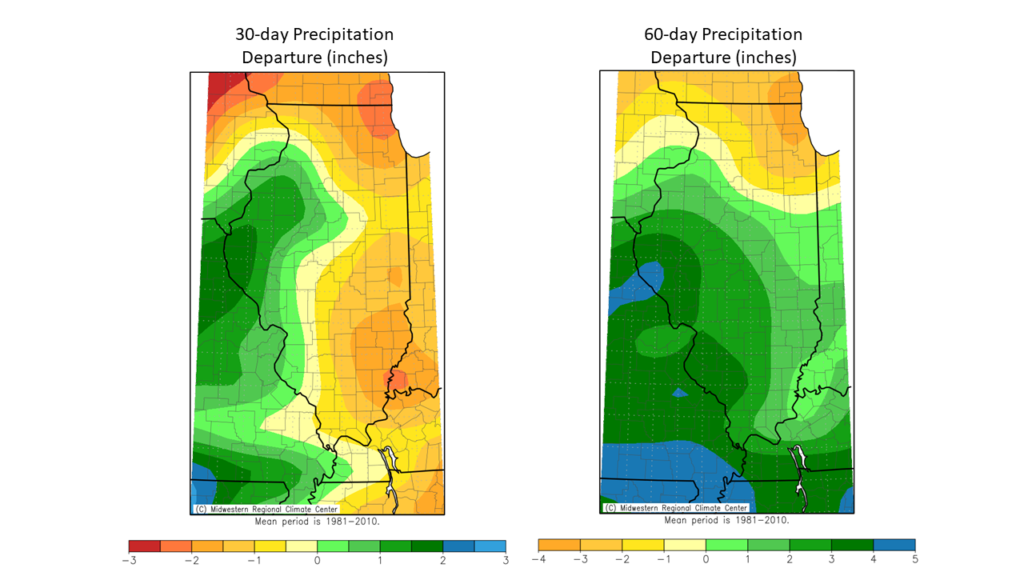
Dry April weather followed a relatively dry March in northeast Illinois. The maps below show precipitation departures from the 1981–2010 average over the past 30 and 60 days. Most of the area from Winnebago to Kankakee Counties is experiencing a 1.5- to 2.0-inch precipitation deficit over the past 30 days and a 2- to 4-inch deficit over the past 60 days. In response, the latest version of the U.S. Drought Monitor shows moderate drought across the northeast corner of the state, and abnormal dryness along the Indiana Border from Lake Michigan to the Ohio River.
April Snow (Hopefully) Brings an End to Winter Weather
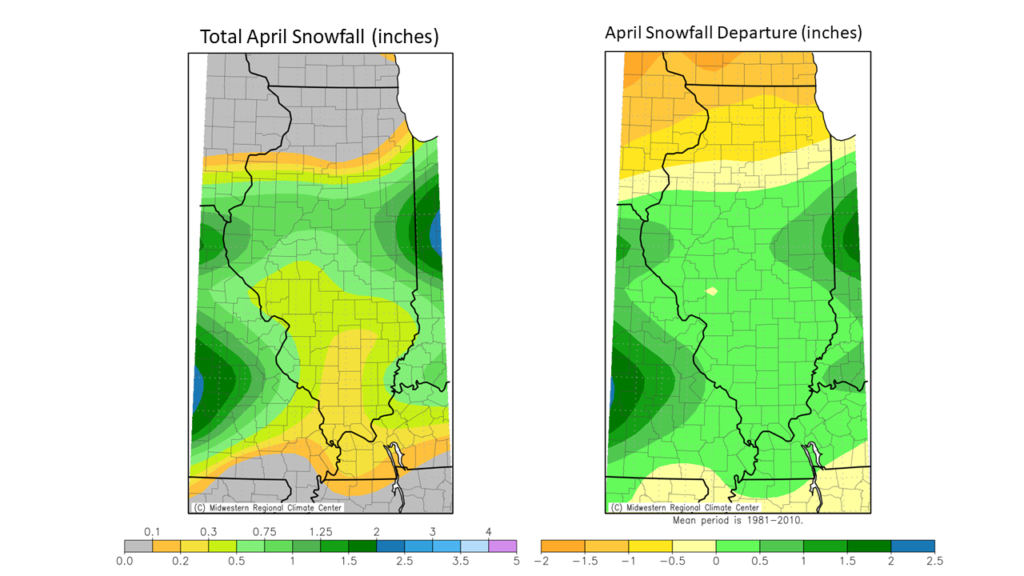
We were all done with winter, but it was not finished with us. The dramatic cool down in mid-April brought a late spring snowfall to much of the state. April snowfall totals ranged from just under a tenth of an inch in most of far northern and southern Illinois, to nearly 2 inches in east-central Illinois.
April snowfall ranged from normal in northern Illinois to highly unusual south of Interstate 64. The measurable snowfall on April 21 this year was the third latest on record in Champaign, the fourth latest on record in Peoria, and the latest on record in Belleville. The long-term station in Normal only has recorded observable snowfall after April 15 in 9 out of 117 years of record but has observed snowfall after April 15 in each of the past four years.
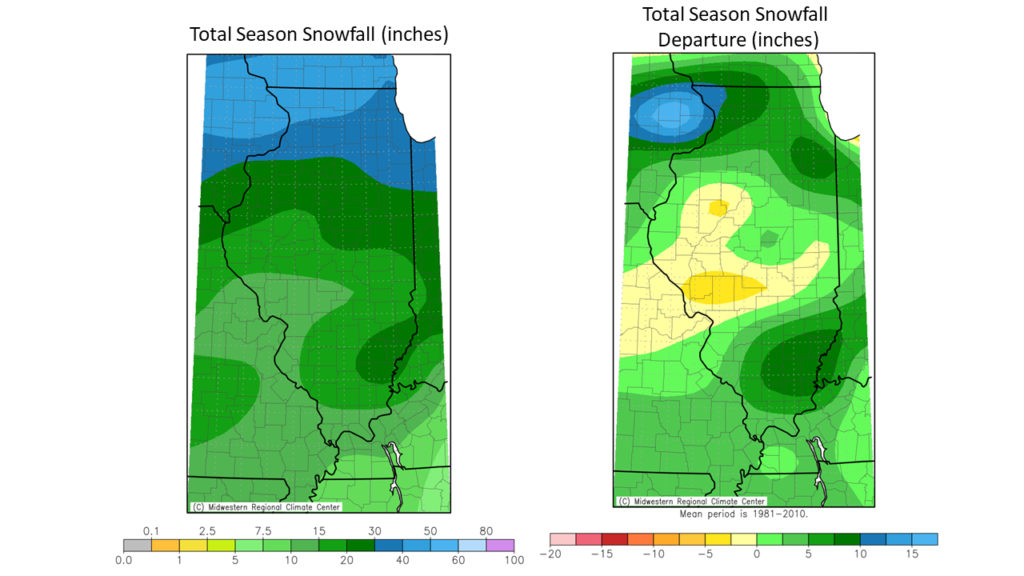
The maps below show total winter season snowfall and departures from the 1981–2010 normal. Total season snowfall, back to October 2020, ranged from nearly 50 inches in northwest Illinois to just under 10 inches in southern and southwest Illinois. Most of northern and southern Illinois received 5 to 10 inches more snowfall than the 30-year average, whereas central Illinois was within 5 inches of the 30-year average. Stockton in Jo Daviess County recorded 49 inches of snowfall this past season, the 11th highest on record and snowiest since 2014.
Overall, the preliminary statewide average total April precipitation was 3.61 inches, 1.08 inches below the 1991–2020 average and the 51st driest on record going back to 1895.
Outlooks
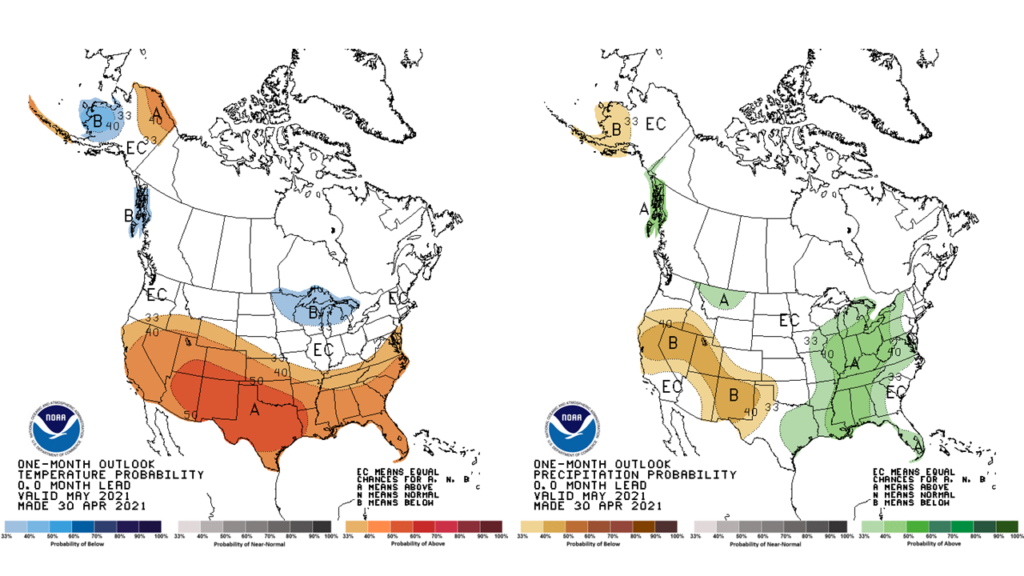
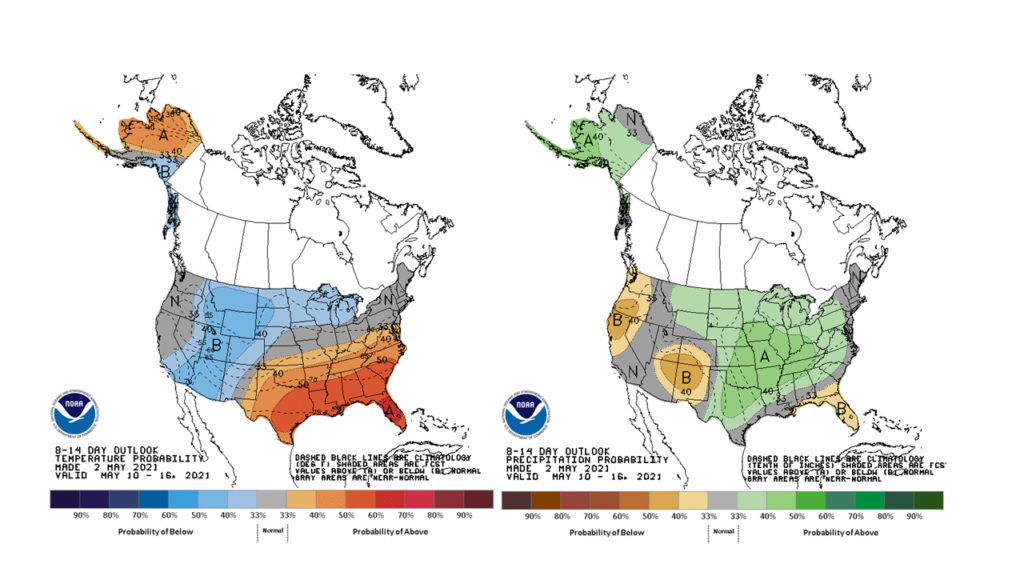
The Climate Prediction Center outlooks suggest wetter conditions ahead for the Midwest. The 8- to 14-day outlook for the second week of May shows elevated odds of wetter than normal conditions, and the highest odds of near normal temperatures.
Looking at the whole month of May, the 1-month Climate Prediction Center outlooks also show elevated odds of wetter than normal conditions for this month, with an equal chance of above and below normal temperatures in May.