This past month is quite challenging to summarize across the state. Overall, the preliminary statewide average May temperature was 60.8 degrees, 2.5 degrees below the 1991–2020 average and tied for 42nd coldest on record going back to 1895. The preliminary statewide average total May precipitation was 4.50 inches, 0.26 inches below the 1991–2020 average and tied for the 50th wettest on record going back to 1895.
Data are provisional and may change slightly over time
May Continued Spring Temperature Rollercoaster
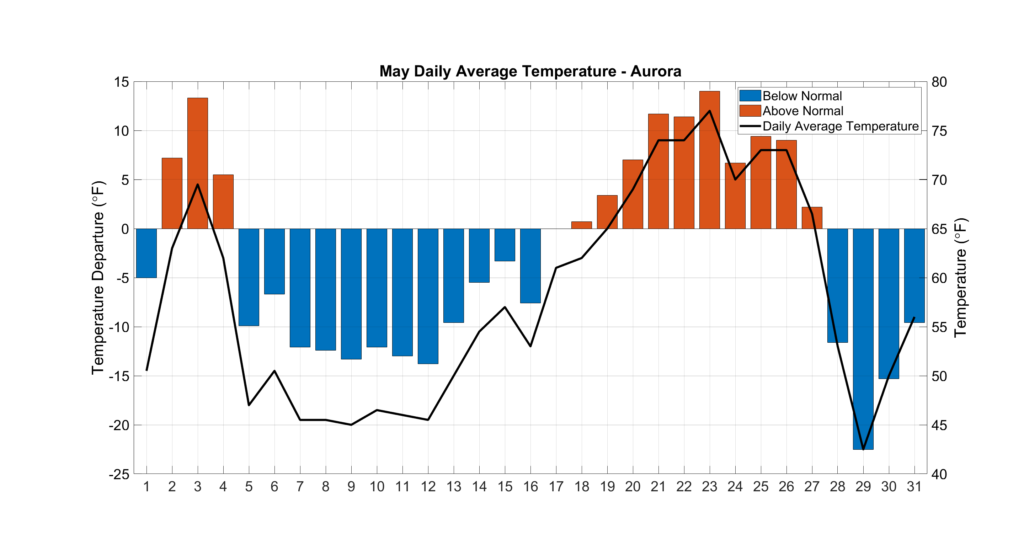
May temperatures varied substantially as the daily temperature departures from Aurora show below (Figure 1). Average temperatures ranged between 5 and 15 degrees below normal for all but a handful of days in the first half of the May, followed by a 10-day period of average temperatures 5 to 15 degrees above normal. Temperatures dropped in the last week of May as a cold front moved through the Midwest ahead of the Memorial Day weekend.
The temperature swings broke 10 daily high maximum temperature records, 39 daily high minimum temperature records, 14 daily low maximum temperature records, and 33 daily low minimum temperature records.
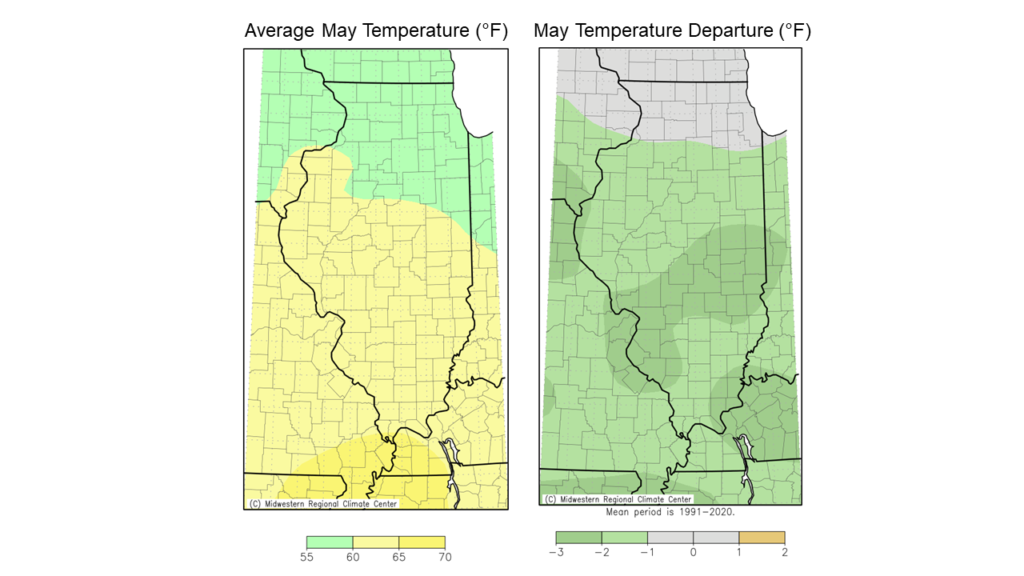
May average temperatures ranged from the high 50s in northern Illinois to the mid-60s in southern Illinois, between 1 and 3 degrees colder than normal in all but northern Illinois.
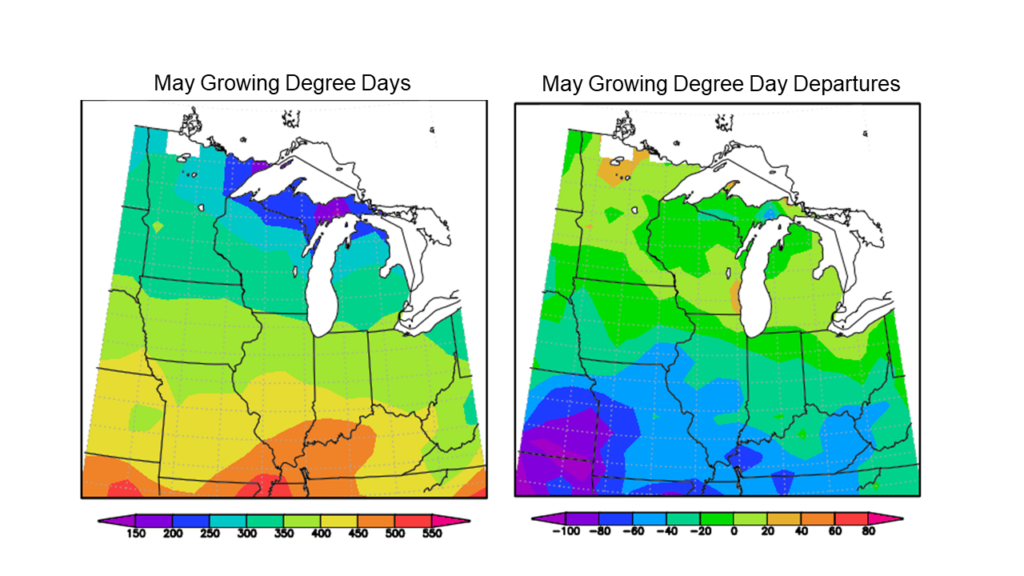
May temperatures kept growing degree accumulation below normal across the state. Base 50-degree modified growing degree day accumulation in May ranged from over 450 in southern Illinois to around 400 in northern Illinois. May growing degree day accumulation was between 10 and 60 below the 1991-2020 average across the state, with the largest departures in southern Illinois (Figure 3).
Overall, the preliminary statewide average May temperature was 60.8 degrees, 2.5 degrees below the 1991–2020 average and tied for 42nd coldest on record going back to 1895.
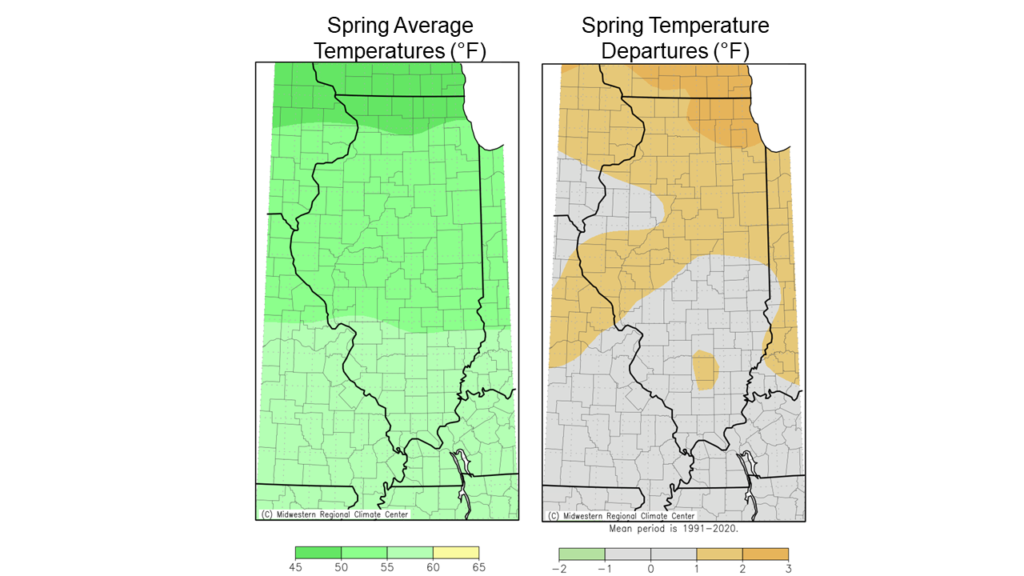
Average spring temperatures ranged from the high 40s in northern Illinois to the mid-50s in southern Illinois, between 2 and 3 degrees warmer than the 1991-2020 normal in northern Illinois and within 1 degree of normal in central and southern Illinois. Spring 2021 was the 6th warmest on record in Rockford (record back to 1893) and the warmest spring since 2012.
Wet West, Dry Elsewhere in May
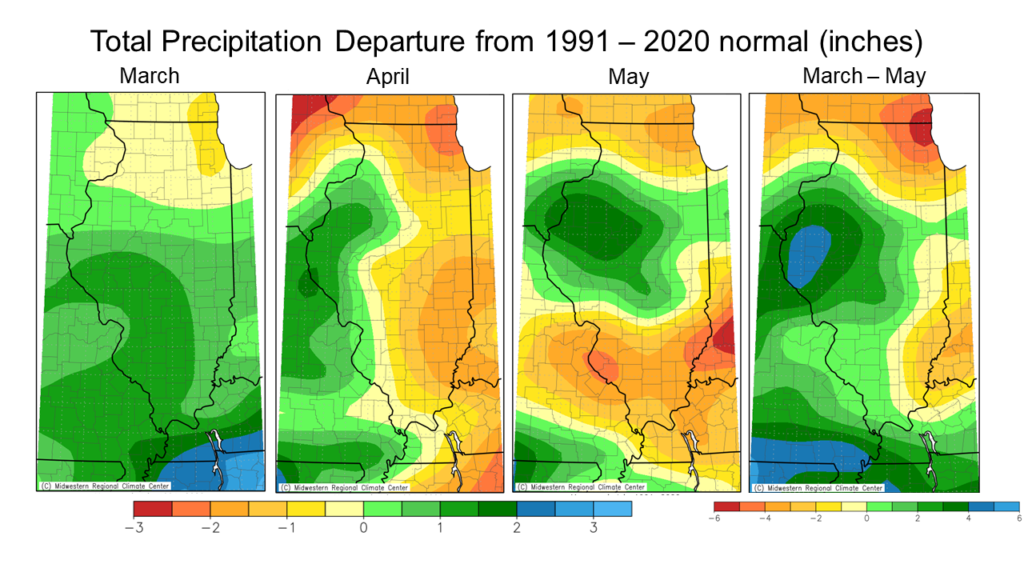
May precipitation was highly variable across Illinois. Monthly totals ranged from over 6 inches in western Illinois to less than 2 inches in far northern Illinois. These totals represent from a 2- to 3-inch surplus in western Illinois to 2- to 3-inch deficits in southwest and northeast Illinois, relative to the 1991-2020 normal.
Overall, the preliminary statewide average total May precipitation was 4.50 inches, 0.26 inches below the 1991–2020 average and tied for the 50th wettest on record going back to 1895.

Spring Drought Continues in Northern Illinois
May marked the fourth consecutive month of below average precipitation in northeast Illinois. The maps below show total precipitation as a departure from the 1991-2020 normals for March, April, and May and the climatological spring. Through each of the three spring months, the northeast corner of the state experienced well below normal precipitation, culminating in a 6- to 7-inch precipitation deficit in northeast Illinois since March 1.
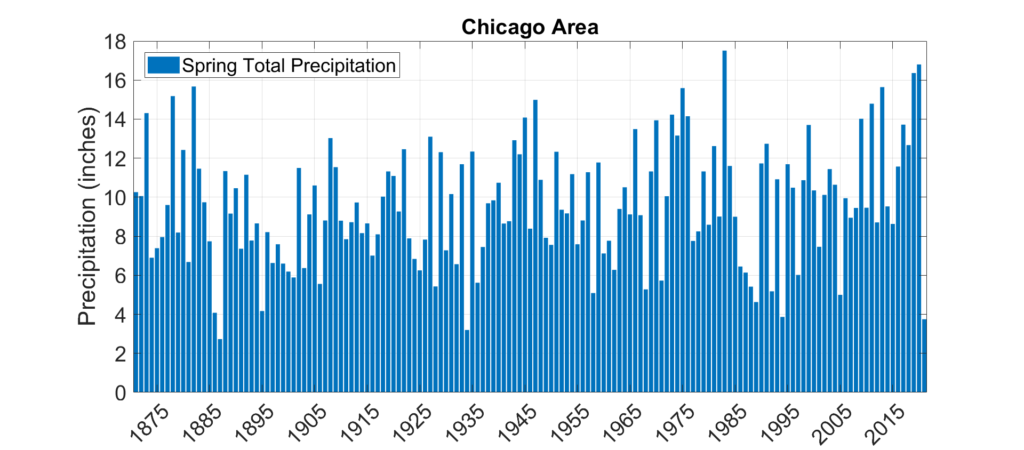
This spring ended as the third driest on record in Chicago (back to 1871) and the driest since 1934 with only 3.75 inches of total precipitation between March and May (Figure 7). For reference, the long-term average spring precipitation total in Chicago is 9.36 inches. Incredibly, this extremely dry spring followed the very wet springs of 2019 and 2020, which were the 2nd and 3rd wettest on record in Chicago.
Outlooks
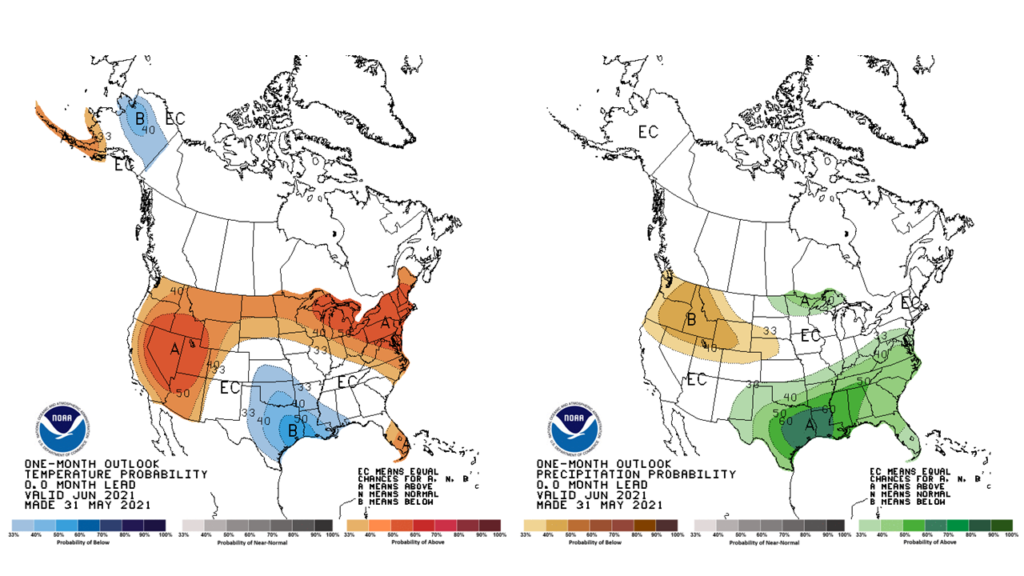
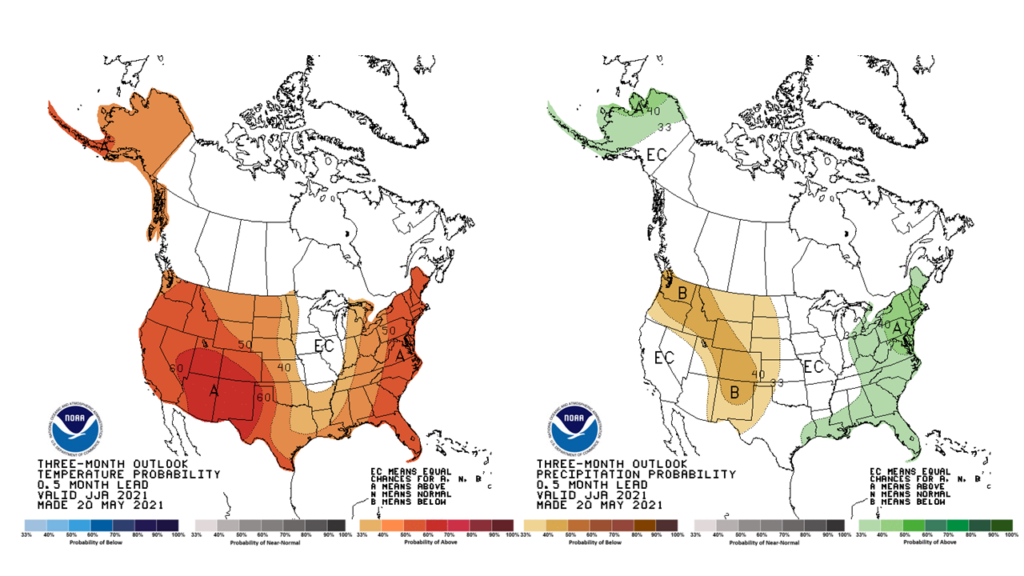
Summer is notoriously challenging for skillful seasonal climate prediction because of the lack of influence of large-scale patterns like the El Niño-Southern Oscillation (ENSO) on summer climate in the central U.S. The most recent 1-month and 3-month outlooks from the Climate Prediction Center reflect the relatively low confidence in summer climate prediction. Both the outlooks for June and those for climatological summer (June – August) show mostly equal chances of above normal, normal, and below normal temperature and precipitation across the state.
Without large-scale atmospheric conditions that are conducive to wetter weather in northern Illinois, amelioration of drought conditions will depend mostly on small-scale thunderstorms and precipitation from tropical systems, both of which are very difficult to forecast more than a few days ahead. Therefore, the Climate Prediction Center drought outlook shows drought in northern Illinois persisting through the month of June.
