The statewide average June temperature was 71.6 degrees, 0.6 degrees below the 1991–2020 average and the 52nd warmest on record going back to 1895. The statewide total June precipitation was 1.81 inches, 2.84 inches below normal and the 9th driest June on record statewide.
Pleasant June Temperatures
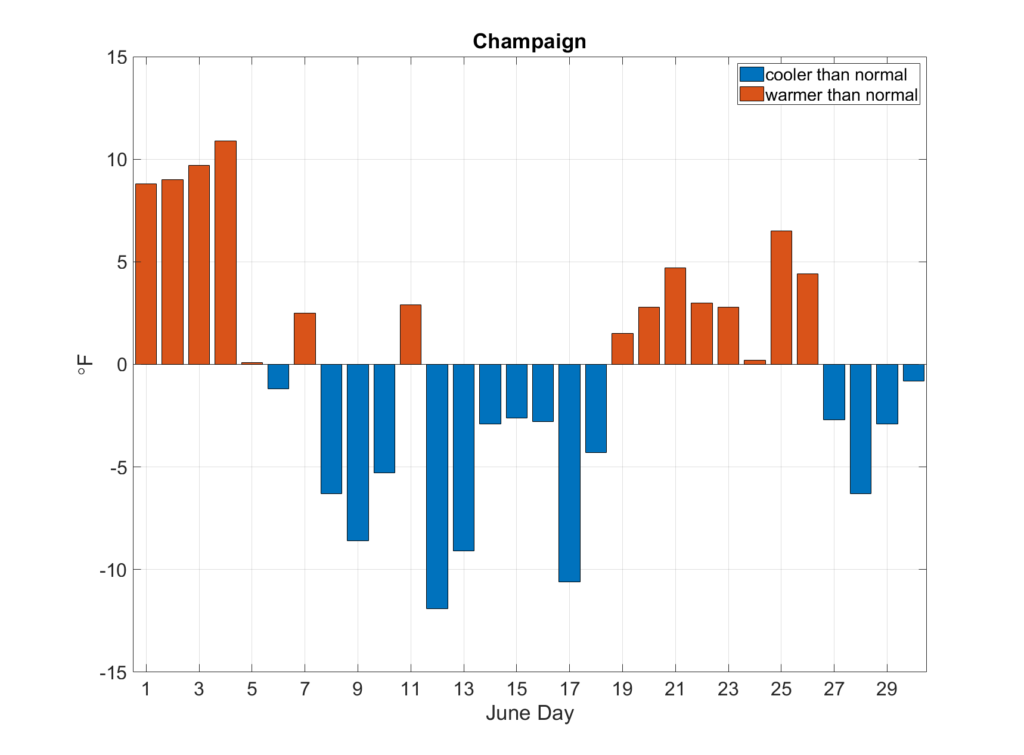
June began summer-like, with daily high temperatures in the high 80s to low 90s statewide. As the temperature departures from Champaign in Figure 1 show, a cool front toward the end of the first week of the month dropped temperatures considerably, and most of the second and third weeks of June had below normal temperatures in Illinois. The heat came back in the last 10 days of the month but was not extremely high until the last couple days of June.
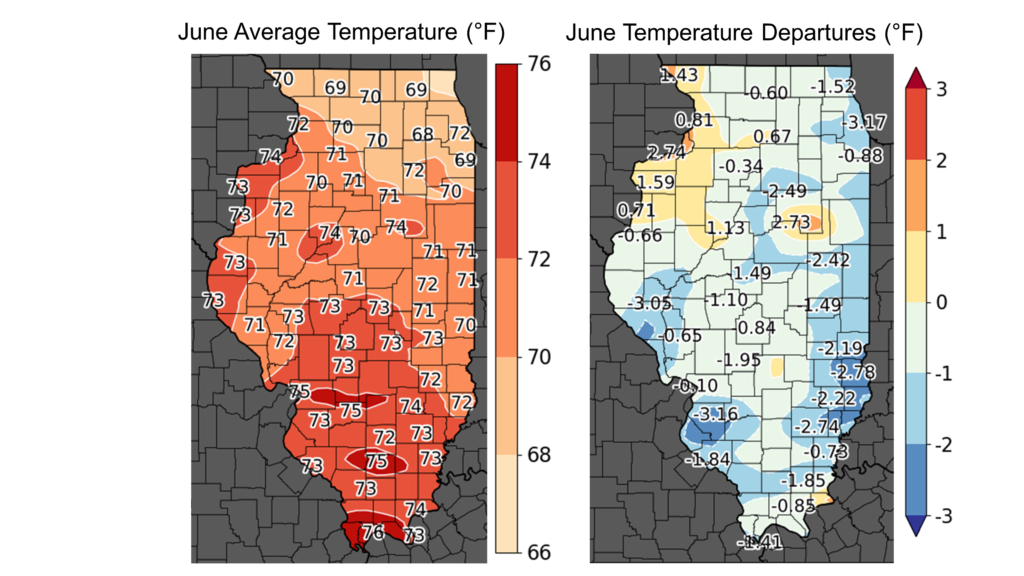
June average temperatures ranged from the high 60s in northern Illinois to the high 70s in southern Illinois, between 1 and 3 degrees above normal in northwest and parts of central Illinois, and between 1 and 4 degrees below normal in eastern and most of southern Illinois (Table 1a, Figure 1). The dry air in the Midwest for most of the month kept daytime temperatures high but allowed nighttime temperatures to regularly dip into the 50s. In fact, while daytime high temperatures in June were 1 to 4 degrees above normal, nighttime low temperatures were 1 to 4 degrees below normal, making for one of the most comfortable Junes in recent memory. The warmest place in the state last month was Olmstead in Pulaski County with an average temperature of 75.9 degrees, and the coolest place in the state in June was Waukegan with an average temperature of 65.5 degrees.
Altogether, 20 daily high maximum temperature records and 3 daily high minimum temperature records were broken in June. In addition, 13 daily low maximum temperature records and 24 daily low minimum temperature records were broken last month.
Many stations had daytime high temperatures in the upper 90s, and a few places hit or exceeded 100 degrees in the last few days of June. These included 101 degrees in Randolph County and 100 degrees in Perry County. Carbondale hit 100 degrees for the first time since 2012, reaching the mark on June 25. Meanwhile, many places saw nighttime lows dip into the mid- to low 40s in mid-June, including 40 degrees in McHenry County and 42 degrees in Woodford County. The warmest place in the state last month was Olmstead in Pulaski County with an average temperature of 75.9 degrees, and the coolest place in the state in June was Waukegan with an average temperature of 65.5 degrees.
Overall, the statewide average June temperature was 71.6 degrees, 0.6 degrees below the 1991–2020 average and the 52nd warmest on record going back to 1895
Very Dry June Adds to Deficits
June is typically a wet month in Illinois, but this year June followed the dry pattern of April and May. Last month was the driest June since 2012. June precipitation ranged from less than 1 inch in far western and southwest Illinois to isolated spots of over 7 inches in northwest and southeast Illinois. Most places in the state had between 2 and 5 inches below normal rainfall in June (Figure 3). Last month capped off an extremely dry start to the growing season, going back to April 1st. The period between April 1st and June 30th was the 2nd driest on record in Quincy, the 3rd driest in Moline, the 5th driest in Champaign, the 8th driest in Peoria, and the 11th driest on record in Chicago. Quincy, for example, had 4.53 inches of rain in April, May, and June together, which was 0.80 inches less than that period in 2012 and 1.48 inches less than in 1988.
The statewide total June precipitation was 1.81 inches, 2.84 inches below normal and the 9th driest June on record statewide.
Drought in Illinois
The dry weather from April through June has put Illinois in its most serious drought since 2012. Soils throughout the state are very to extremely dry down to 12 inches and in some places down to 20 inches. The 8-inch soil moisture at the Illinois Climate Network station in Champaign was at its lowest (driest) point on record as of June 28, with a record going back to 2004. Streams and ponds are much lower than normal across the state, but conditions have not progressed to affect rural wells or municipal water supply.
Agricultural impacts have multiplied in the past few weeks, including visible stunting and stress in corn and beans, especially late-planted beans. Producers have reported spider mite damage, which is a common problem in drought years. It is not clear if the drought has yet caused widespread, significant yield loss in corn or beans. The critical growth stages of both crops tend to occur in the last few weeks of July and first week of August, so there may still be an opportunity for a decent crop if the state can get more consistent rain throughout July. Pasture conditions remain poor in many areas, with little regrowth since the first cutting of hay, which increases concerns of hay supplies later this year. Mature trees in central and northern Illinois are showing significant stress from the prolonged dry conditions, including dropping leaves. Lawns in many places have been dormant since Memorial Day.
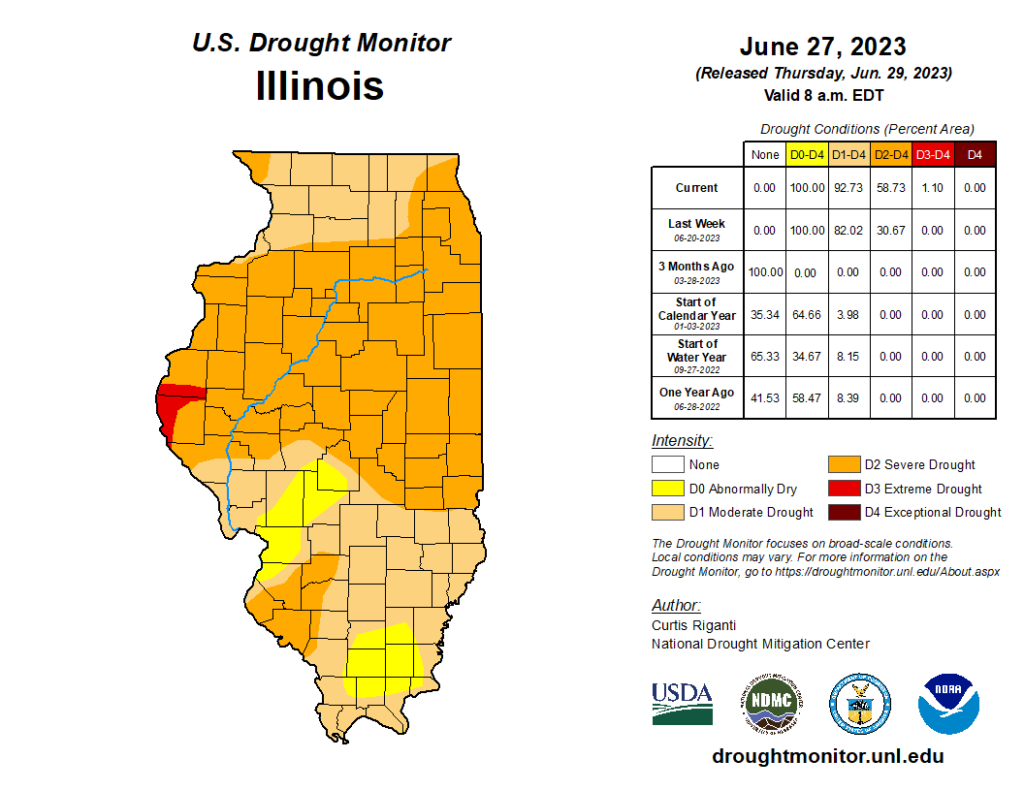
The most recent U.S. Drought Monitor map shows over 90 percent of the state in at least moderate drought and over half of the state now in severe drought. Extreme drought (D3) has sneaked across the Mississippi River into a sliver of Adams and Hancock counties in western Illinois (Figure 4).
The recent rain will at least stall worsening drought conditions and may help to improve conditions in some places. However, we will need at least another three to four weeks of consistent rain of 1 to 1.5 inches per week to improve drought conditions in earnest. As conditions evolve, for better or worse, please continue to report conditions and impacts with the National Drought Mitigation Center’s CMOR system: go.illinois.edu/cmor.
Air Quality Issues
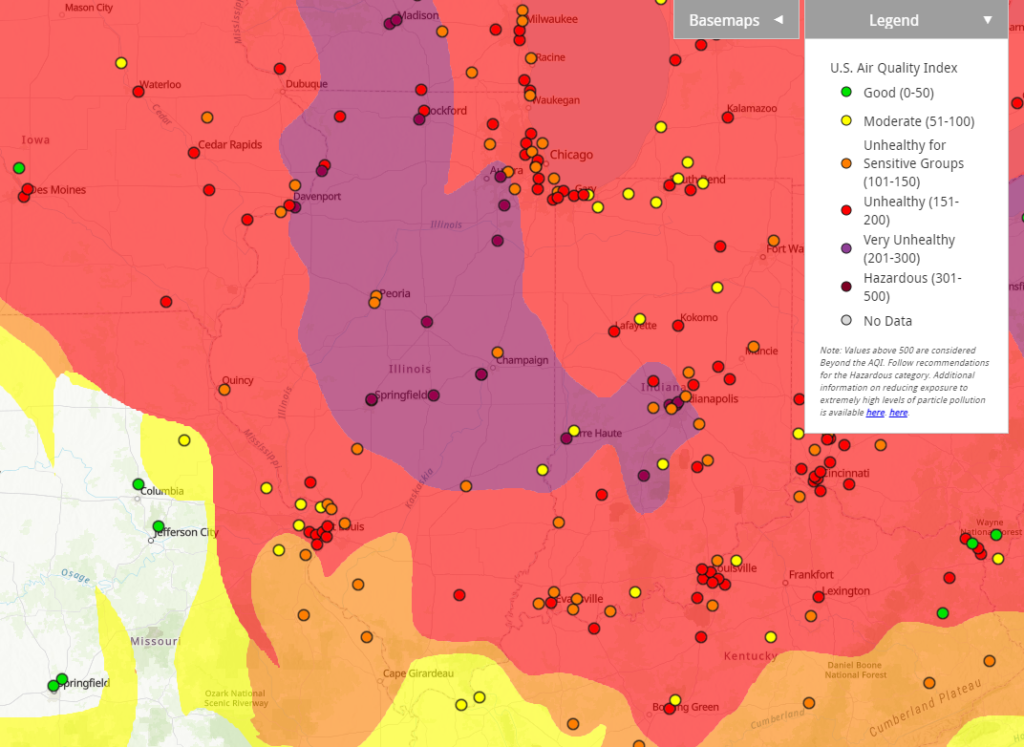
Wildfires have been burning in parts of central and eastern Canada most of this summer. The location of the ridge and corresponding high-pressure center in the Great Lakes region created unusual northeasterly wind, meaning the wind blew from northeast to southwest in late June. As a result, wildfire smoke moved into parts of the Midwest and caused extremely poor air quality, mostly from particulate matter. Figure 5 shows a snapshot of the EPA’s air quality index (AQI) from June 28 over Illinois. The AQI ranges from 0 (very good air quality) to 500+ (hazardous air), and much of northern and central Illinois spent 24–48 hours in the “unhealthy” or “very unhealthy” categories, representing some of the worst air quality the state has experienced in many years. A weather pattern shift on June 29 helped move the wildfire smoke farther to the east and improved air quality in Illinois; however, air quality issues will continue to be a periodic problem as long as the Canadian wildfires continue to burn.
Outlooks
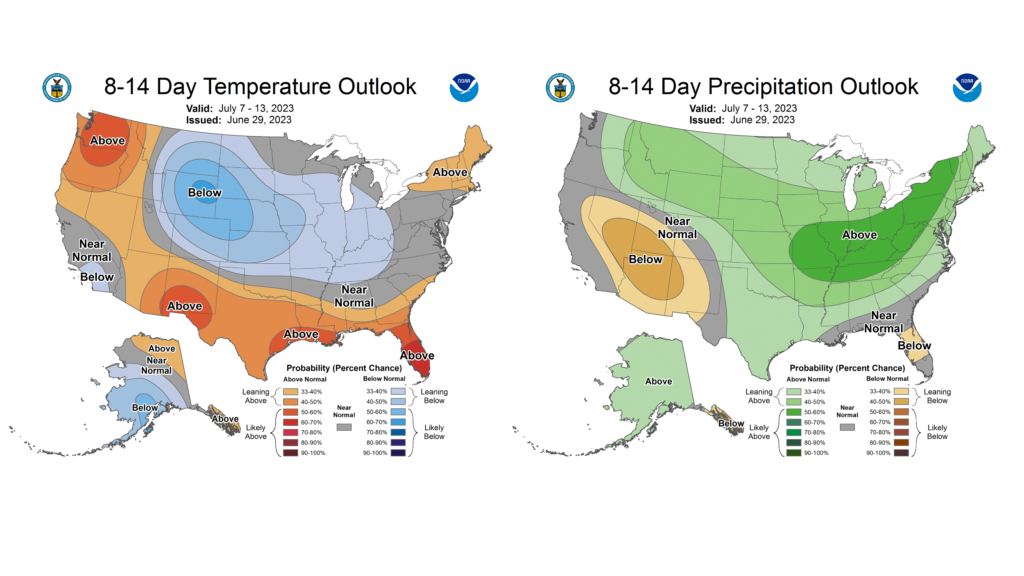
July is the climatological hottest month of the year in Illinois and can make or break a growing season with its rain (or lack thereof). The first week of July is looking wetter than normal, with widespread forecasted totals exceeding 1 inch across the state. The latest 8- to 14-day outlooks from the Climate Prediction Center lean toward wetter than normal, hopefully continuing that wetter trend (Figure 6). Although the drought in Illinois will take many weeks to break, wetter conditions in July can help limit drought impacts as we move into late summer.