

Following a fairly wet start to 2023, most of Illinois has experienced well below normal precipitation between April and June. In this summary, we review the evolution of the 2023 drought between the beginning of April and middle of July and discuss the drought’s implications to Illinois so far.
Dry April, No Worries
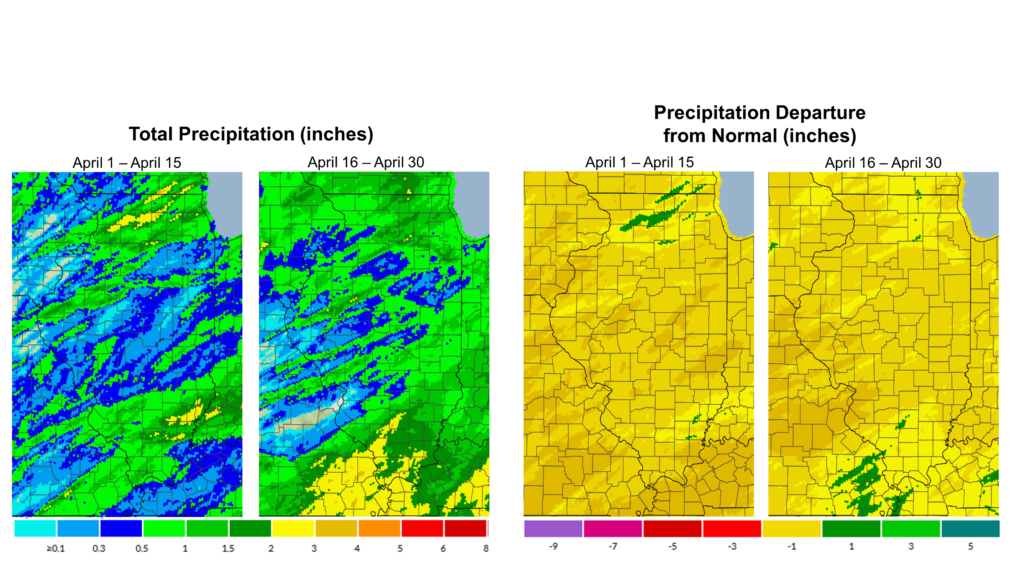
The first half of April was 1 to 2 inches drier than normal and included a full seven days without any precipitation in the entire state of Illinois. The very unusual dryness in early April came after wetter than normal months of January, February, and March, and was well timed for spring fieldwork that depends on workable soils. The dryness persisted through the second half of April, as much of Illinois was 1 to 2 inches drier than normal. April ended 1 to 3 inches drier than normal across the state, with the largest departures in central Illinois. Champaign, for example, experienced its 18th driest April on record with 1.68 inches total, more than 2 inches below normal.
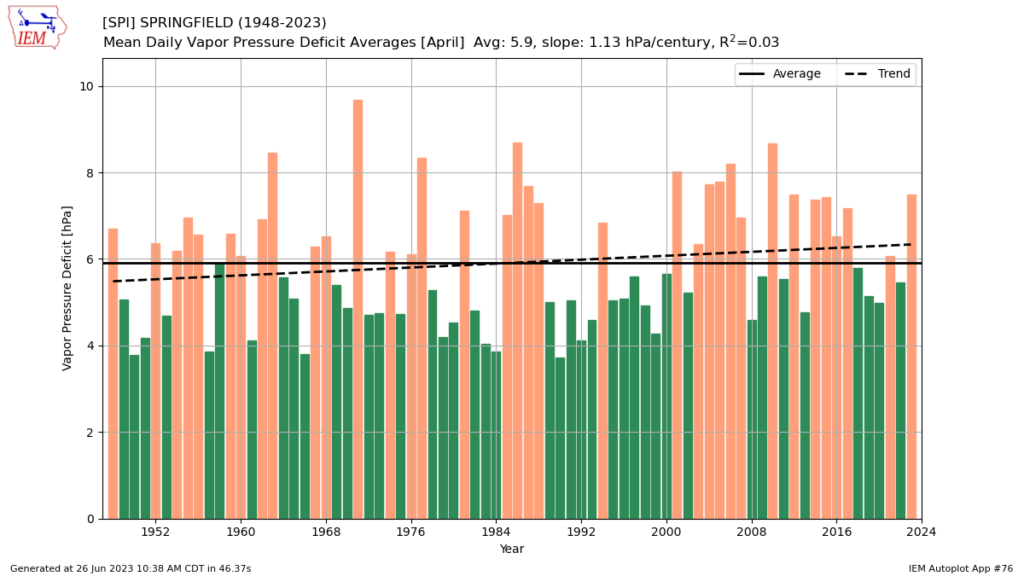
April was slightly warmer than normal in Illinois, but not extremely so. However, we frequently experienced unusually dry air across the state in a time when humidity is often prevalent. One of the best measures of the dryness of air is the vapor pressure deficit, with higher values indicating overall drier air. Springfield’s average vapor pressure deficit in April was much higher than average and the highest since 2012 (Figure 2). The dry air in April helped augment the lack of precipitation and resulted in very dry topsoil conditions across central Illinois going into May. It is likely the lack of April precipitation and dry air were two important components that contributed to the May 1 dust storm in central Illinois.
May Continues the Dryness – Drought Emerges
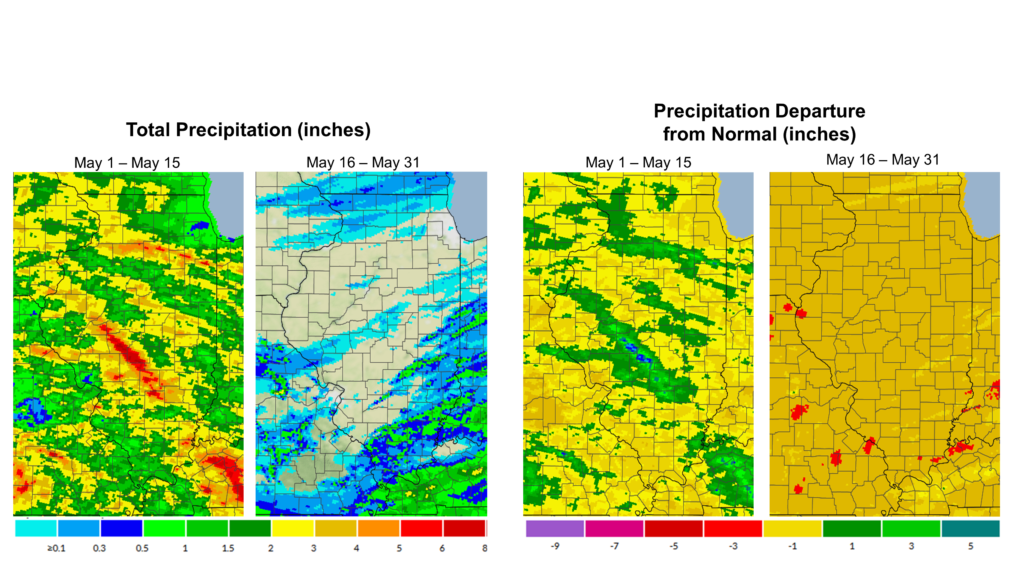
The first half of May brought uneven precipitation to Illinois, though precipitation, nonetheless. Most areas in the state picked up between 1 and 3 inches in the first half of May, while an isolated area from Sangamon to Clark counties in central Illinois caught between 4 and 8 inches, most of which fell in less than 24 hours. Outside of the inundated parts of the state, the drier start to May helped move planting along and–combined with near to slightly cooler weather–made for a very enjoyable few weeks in the Midwest. However, dryness really set in the last two weeks of May, as many parts of the state had virtually no rain between May 16 and May 31. The sheer lack of rainfall increased concerns of rapid onset drought in late May, as streamflow and soil moisture began to decrease quickly.
Overall, May ended about 2 inches drier than normal statewide, but extremely dry in some parts of the state. Chicago had its fourth driest May on record, with only 0.71 inches in what is typically a top-three wettest month in the windy city. The US Drought Monitor introduced moderate drought in northeast and central Illinois in late May in response to the persistently dry conditions.
From Awareness to Concern – Drought Intensifies in June
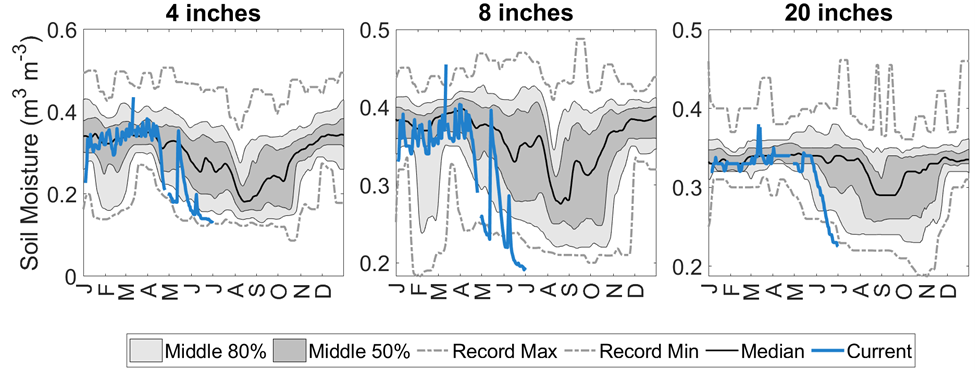
Climatologically, June is the wettest month of the year in Illinois. However, this year June followed the dry pattern of April and May and has brought much below normal rainfall across the state. In fact, the state recorded an average of just 1.13 inches of rainfall in the first 28 days of June, the third lowest on record and wetter only than 1988 and 1959. Soils were extremely dry across the state in late June. The 8-inch soil moisture at the Illinois Climate Network station in Champaign was at its lowest (driest) point on record on June 28, with a daily record back to 2004 (Figure 4).
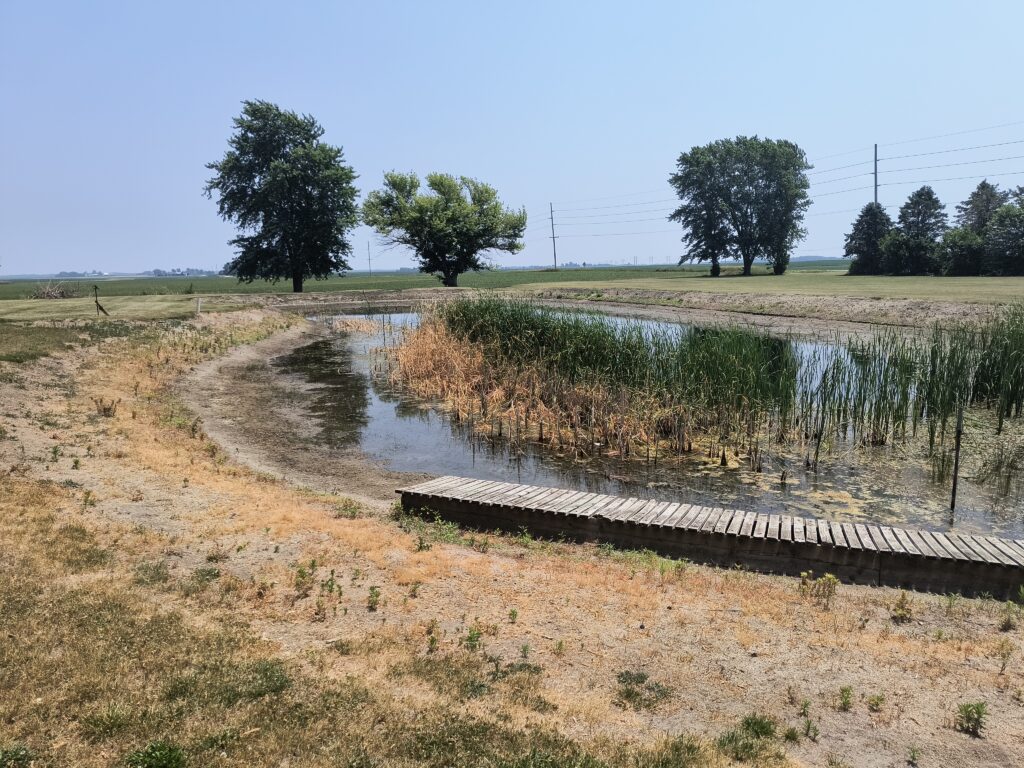
The very dry start to June pushed stream and pond levels much lower than normal as water tables dropped across the state. While conditions did not progress to affect rural wells or municipal water supply, many producers’ stock ponds dropped to unsuitably low levels, creating issues with water supply and water quality for cattle and other livestock (Figure 5). Producers were also challenged by increasingly poor pasture conditions from the drought, forcing many to supplement with hay, at a very high economic and labor cost.
A Little Drought Relief in July
Rain in the last few days of June and first week of July have helped stop deteriorating drought conditions and have improved crop and stream conditions somewhat. As is typically the case with drought recovery in July, precipitation was spotty and inconsistent. The areas that have caught more than 2-3 inches of rain since the start of July have seen dramatic improvement in soil, crop, and stream conditions. However, some parts of the state have continued to largely miss beneficial rains, creating a patchwork of haves and have nots. Moving forward, we will need consistent, near to above normal precipitation through August to really begin to improve drought conditions and avoid worse impacts to agriculture, ecology, and hydrology.
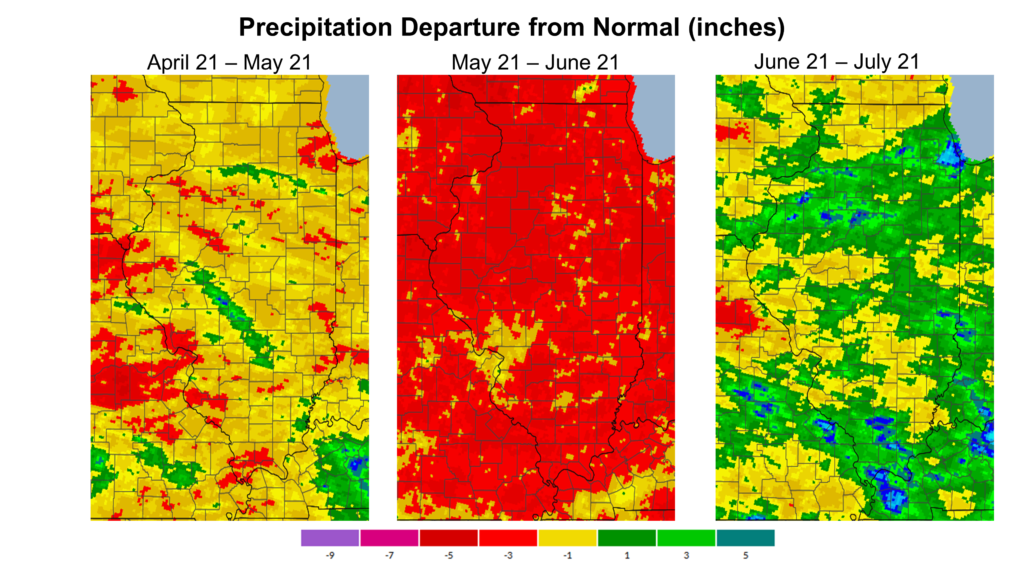
The maps in Figure 6 show precipitation departures in each month from April 21 to July 21, and the cumulative precipitation departures over that time across the state.
The latest US Drought Monitor map (Figure 7) shows some improvement across the state, relative to the heart of the drought in late June. With that said, over two-thirds of the state remains in at least moderate drought, and 13 percent of Illinois is in severe drought.
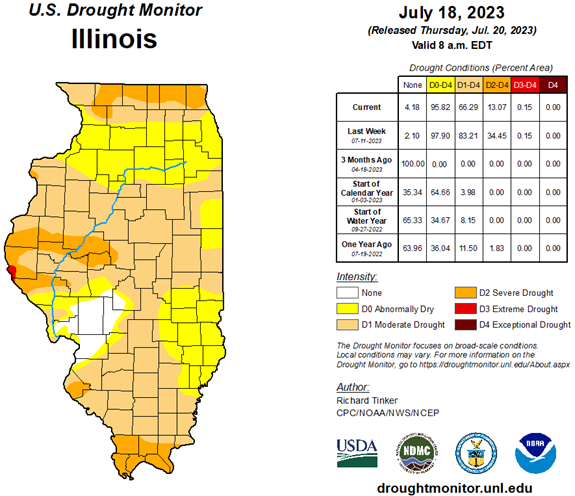
Figure 7. Map shows the US Drought Monitor condition in Illinois, current as of July 18.