The preliminary statewide average May temperature was 63.7 degrees, 0.4 degrees above the 1991–2020 average and tied for the 46th warmest on record going back to 1895. The preliminary statewide average total May precipitation was 2.71 inches, 2.06 inches below the 1991–2020 average and the 28th driest on record statewide.
Data are provisional and may change slightly over time.
Colder Start and Warmer End to May
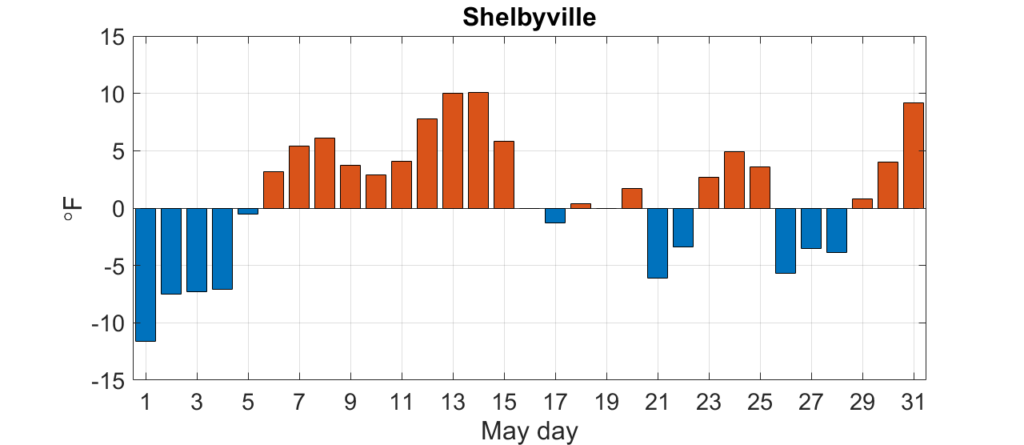
Even though June is the first month of climatological summer, we typically get our first real taste of summer weather in May. Daily May temperature departures from normal in Shelbyville (Figure 1) show extended periods of above normal temperatures last month, especially in the second and fourth weeks. Several places in the state hit the low 90s multiple times, including 94 degrees in Normal and 93 degrees in Moline on May 31.
May average temperatures ranged from the high 50s in northern Illinois to the high 60s in southern Illinois, between 1 and 3 degrees above normal (Figure 2). The cooler start to the month and dry air over Illinois allowed nighttime low temperatures to regularly dip into the 40s. Parts of central and northern Illinois even saw the low 30s on a few nights in early May, including 30 degrees in Normal and Marseilles. The warmest point in the state last month was Cahokia at 67.6 degrees, and the coolest was Waukegan at 56.9 degrees.
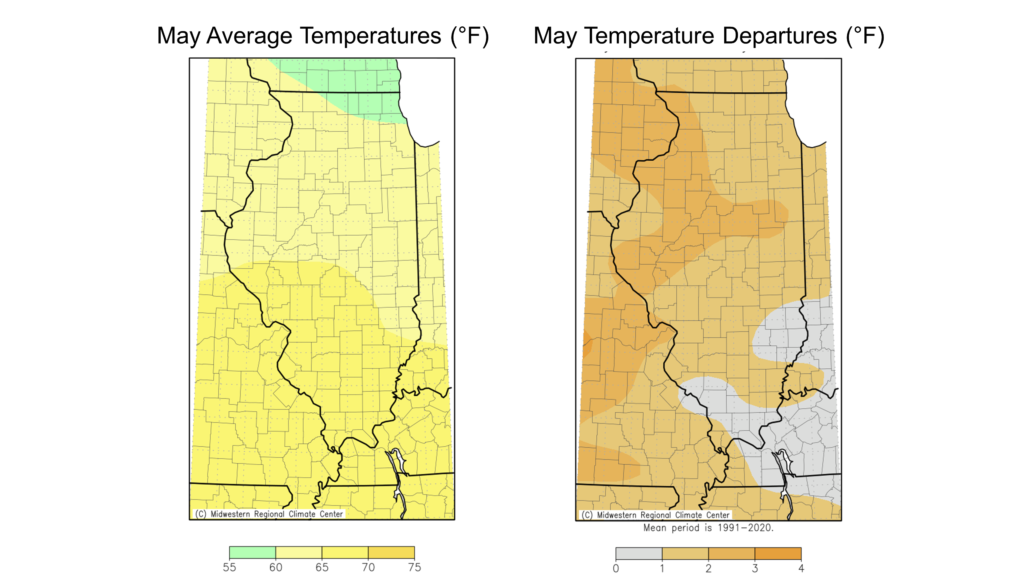
Overall, the preliminary statewide average May temperature was 63.7 degrees, 0.4 degrees above the 1991–2020 average and tied for 46th warmest on record going back to 1895.
Dry May for Most
May is the climatological third wettest month of the year for the state of Illinois, just behind June and July. Unfortunately, last month did not bring the typical May showers for most of the state, continuing a dry pattern from April. May total precipitation ranged from nearly 10 inches in isolated parts of central Illinois to less than 1 inch in northeast Illinois. While small parts of central Illinois picked up 2 to 4 inches above normal May rainfall–mainly from one or two storm systems–most of the state ended the month between 1 and 4 inches drier than normal (Figure 3).
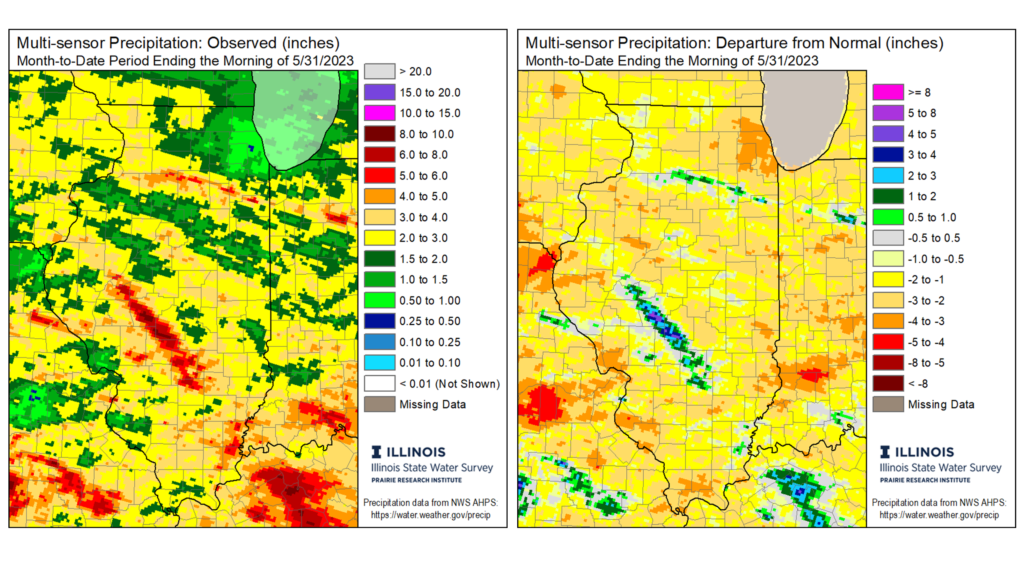
The dryness last month was most intense along the Missouri border and in northeast Illinois, where many places had less than 1 inch of total rainfall. Chicago had only 0.71 inches last month, making it the fourth driest May on record there. The combination of well below normal precipitation in April and May was also remarkable. Quincy had only 3.01 inches of rain between April 1 and May 31, which was the third lowest total on record there for that period. The months of April and May together were also the eighth driest on record in Chicago and the ninth driest on record in Champaign. Meanwhile, a series of storms produced very heavy rain across a small stretch of central Illinois, with one-day total exceeding 8 inches in Sangamon and Christian counties. The wettest point in the state last month was Morrisonville in Christian County with 12.25 inches, making it the wettest May on Morrisonville’s 40+ year record.
Overall, the preliminary statewide average total May precipitation was 2.71 inches, 2.06 inches below the 1991–2020 average and the 28th driest on record statewide.
Drought in Illinois
The combination of drier than normal conditions in April and May and warmer than normal weather throughout much of the past three weeks has taken a significant toll on our soil moisture and streamflow. Soils throughout the state are somewhat to much drier than normal down to 8 to 10 inches and drying quickly. Streamflow in many streams in northern and central Illinois is well below normal for the start of summer. Impacts so far have been isolated to drying lawns and stressed shrubs and young trees; however, there is a concern of increased or worsening impacts if dry and hot weather continues into June. The most recent U.S. Drought Monitor map shows much of central and northeast Illinois is in moderate drought, and most of the northern two-thirds of the state is at least considered abnormally dry (Figure 4).

We have received dozens of condition and impact reports over the past week in Illinois, which has helped tremendously with drought monitoring. Examples of impacts reported included some visible drought stress in soybeans in Moultrie County, corn that is struggling to emerge in Monroe County, and completely dormant grass in Marshall County. While most of these impacts so far have been on the mild side, there is increased concern because they are occurring early in the growing season. With the heat of summer approaching (or here, in some places), continued dryness in June would likely worsen impacts to ecology, agriculture, and water resources.
Please continue to report conditions and impacts using the National Drought Mitigation Center’s CMOR system: https://droughtimpacts.unl.edu/Tools/ConditionMonitoringObservations.aspx.
Spring in Illinois
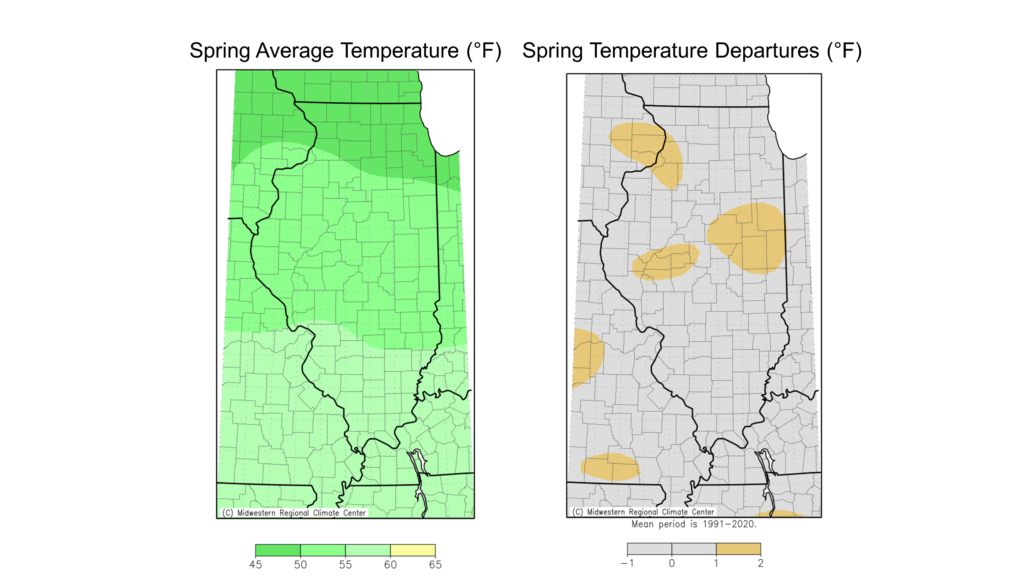
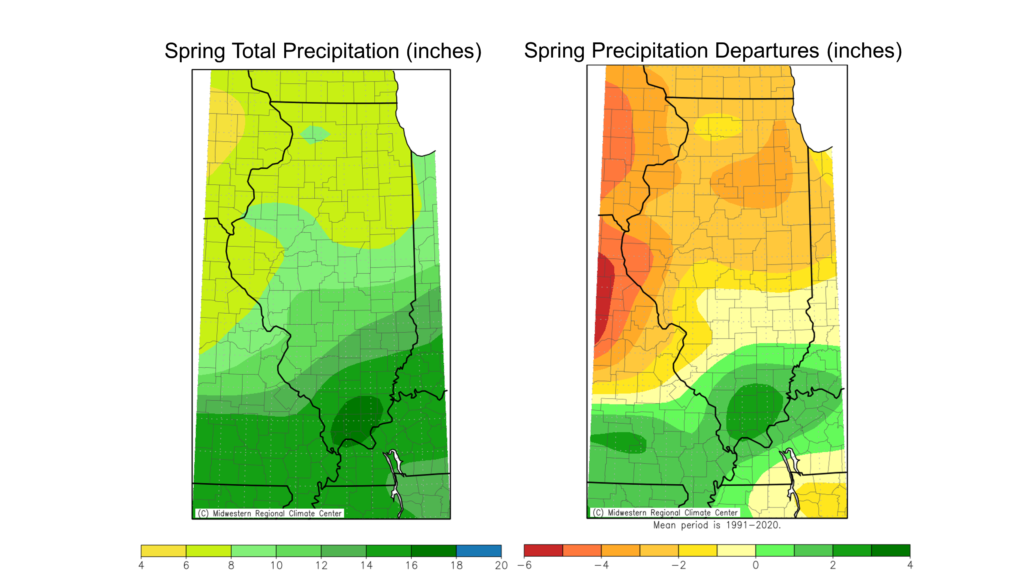
Climatological spring encompasses March, April, and May, and offers hope that the cold of winter will end with the beginning of warmer weather. Temperature-wise, this spring was very close to the 30-year normal, with average temperatures between the high 40s in northern Illinois and the mid-50s in southern Illinois (Figure 5a). However, spring precipitation varied quite a lot depending on where you were in the state. Climatological spring precipitation exceeded 16 inches in parts of southern Illinois and was 1 to 3 inches wetter than normal for virtually all places south of Interstate 65. Meanwhile, spring totals in central and northern Illinois ranged from 5 to 12 inches, between 1 and 4 inches drier than normal (Figure 5b).
Outlooks
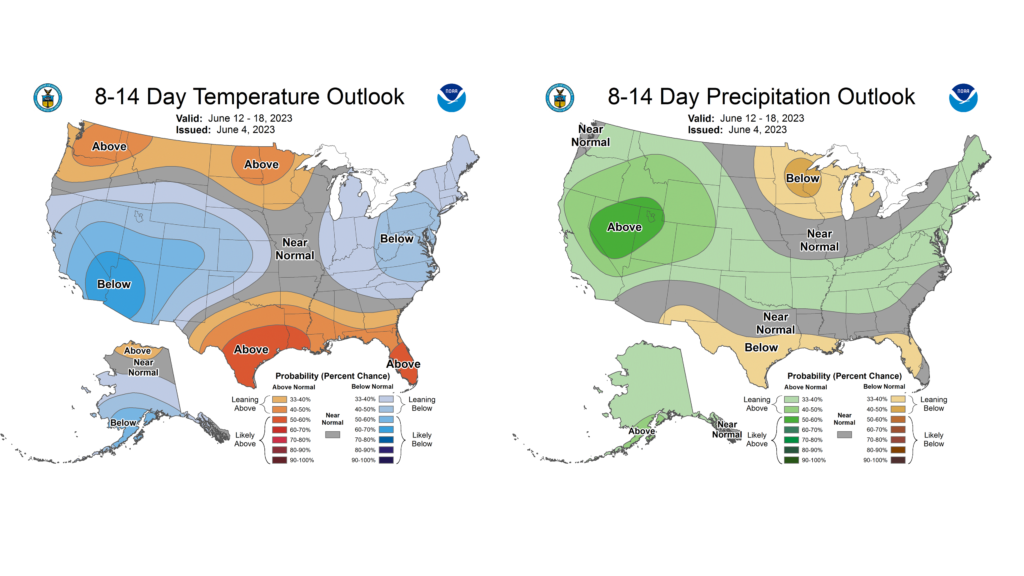
June ushers in climatological summer, and we start the month of June hoping for a little more rain. Models have been signaling a potential pattern shift around June 15–18, and outlooks for the second to third weeks of the month show the highest chances of near to below normal temperatures and near normal precipitation (Figure 6). June brings, on average, about 1 to 1.25 inches of rain each week in Illinois, so even near normal rainfall in mid-June would be much wetter than what we’ve seen lately.
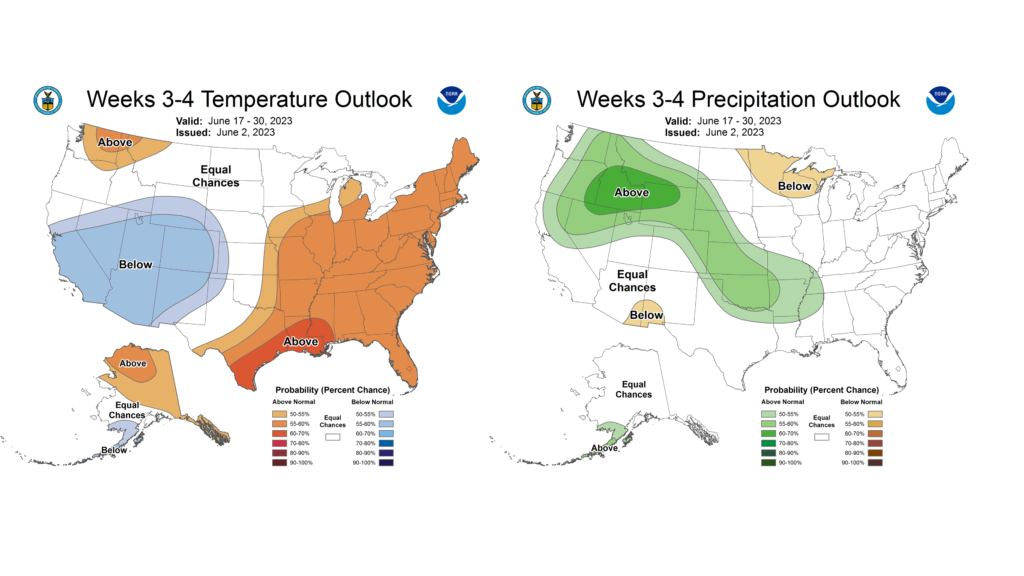
The week three and four outlooks indicate a shift back to above normal temperatures but continues near normal precipitation (Figure 7). It will take more than a few wetter-than-normal weeks to remove drought entirely in Illinois, but timely June rain will go a long way to staving off further ecological, agricultural, and water resource impacts.
