The preliminary statewide average April temperature was 53.0 degrees, 0.4 degrees above the 1991–2020 average and tied for 43rd warmest on record going back to 1895. The preliminary statewide average total April precipitation was 2.75 inches, 1.49 inches below the 1991–2020 average and 37th driest on record statewide.
Data are provisional and may change slightly over time.
Typically Mixed April Temperatures
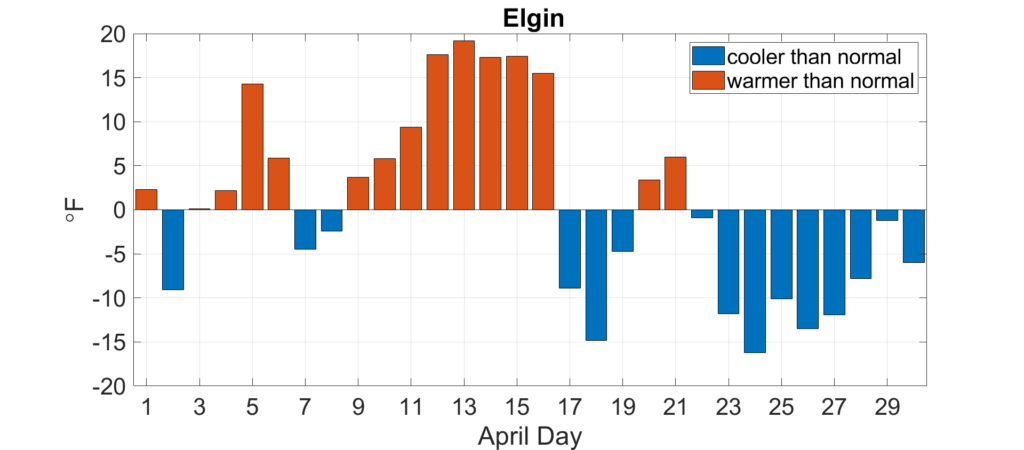
April is the definition of a transition month as we move from winter into summer, and therefore we can get a taste of either season in April. This past month gave us a look ahead to summer with temperatures that were 15 to 20 degrees above normal in the first half of the month, only to remind us what April can do in Illinois, with temperatures 10 to 15 degrees below normal in the last half of the month. Daily average temperature departures from normal in Elgin (Figure 1) show the roller coaster that was April.
April average temperatures ranged from the high 40s in northern Illinois to the high 50s in southern Illinois, less than 2 degrees above normal statewide (Figure 2). The warmer first half of the month broke 33 daily high maximum temperature records in Illinois and 15 daily high minimum temperature records. Olmstead Lock and Dam in Pulaski County in southern Illinois reached a high of 91 degrees on April 6, which broke its all-time April temperature record of 89 degrees. This record is particularly impressive because it was set in the first week of April, whereas most April high temperature records occur toward the end of the month. The cooler end to the month broke 22 daily low maximum temperature records but no daily low minimum temperature records.
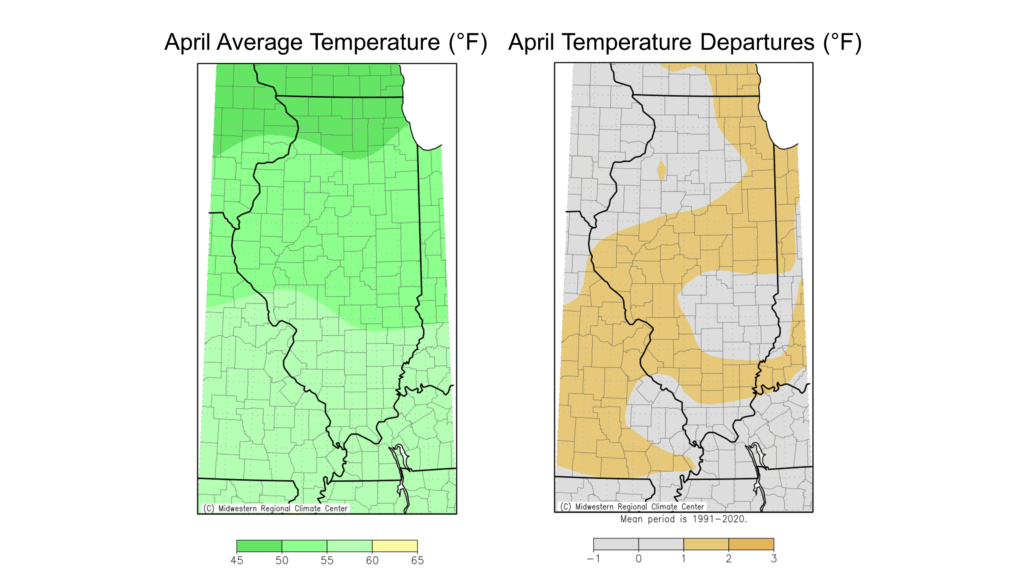
Overall, the warmer start to the month slightly outweighed the cooler end, and April ended slightly warmer than normal statewide. The preliminary statewide average April temperature was 53.0 degrees, 0.4 degrees above the 1991–2020 average and tied for the 43rd warmest on record going back to 1895.
April Showers (for some)
April is typically associated with spring showers on early blooming flowers. The flowers came last month, but the showers were harder to find in some parts of the state. In fact, the first half of the month was very dry, and the week of April 8 to 13 was completely dry across the entire state. The last time the entire state measured exactly 0 inches of precipitation for a full 7 days was November 11–17, 1999, and it looks like that week last month may be one of–if not the only–completely dry April week on record in Illinois. It is very rare to have such a dry spell in spring in Illinois. Combined with the unusually high temperatures and very low humidity, the dry weather in early April had folks summer dreaming, and had farmers clamoring to get as much work done as possible.
The latter half of the month was wetter and cooler but did not make up for the very dry start to the month. Total April precipitation ranged from nearly 8 inches in parts of southern Illinois to around 1 inch in parts of east-central Illinois (Figure 3). Although most of southern Illinois and parts of northern Illinois were near to 1 inch wetter than normal, virtually everywhere between interstates 70 and 80 were 1 to 3 inches drier than normal last month.
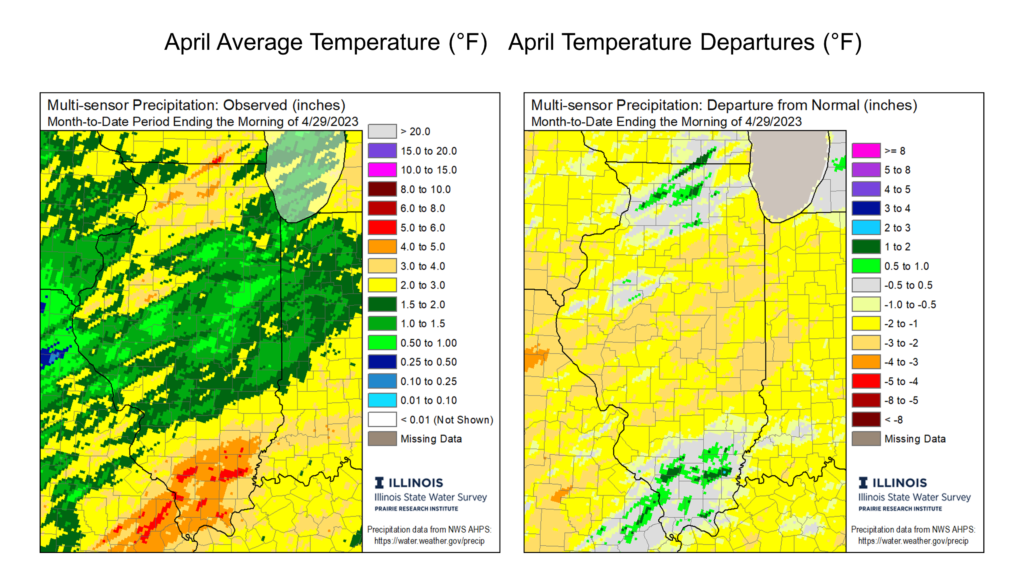
We have seen drier Aprils before, and this month was not record-breaking. However, it was the 18th driest April on record in Champaign (1.68 inches). Overall, the preliminary statewide average total April precipitation was 2.75 inches, 1.49 inches below the 1991–2020 average and the 37th driest on record statewide.
The Snow No One Wants
The wonderful diversity we enjoy here in Illinois sometimes brings about conflicting opinions and preferences, including on food, music, recreation, etc. But one thing that unites us as Illinoisans is strong disdain for April snow. By mid-April we are ready for summer, sunshine, and wearing only one layer of clothes. So, it’s less than ideal when a beautifully warm start to April–as we had last month–is followed by a dramatic cool down and snow showers in some places.
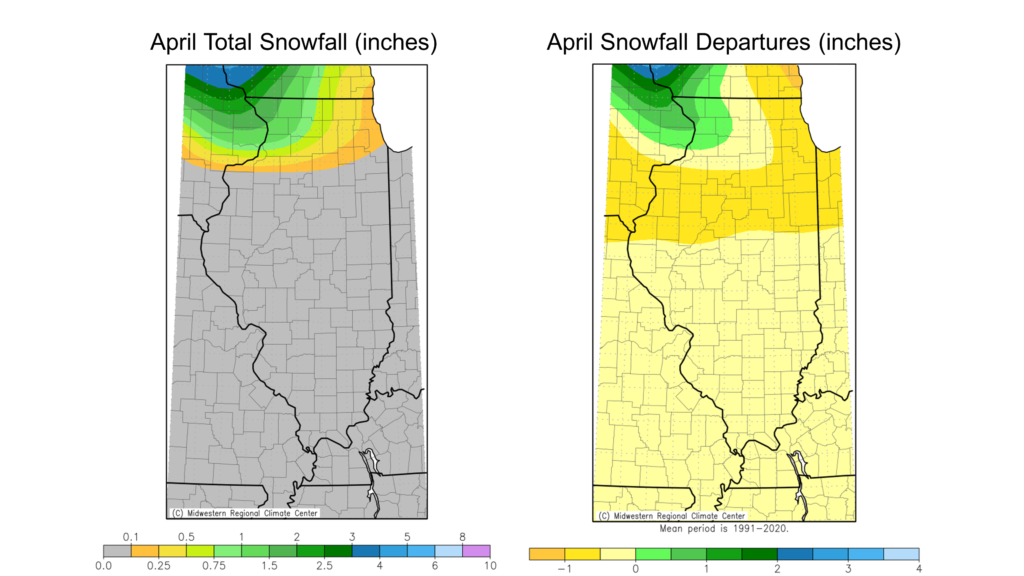
The northern third of the state picked up between 0.10 and 2 inches of snow last month, slightly more than normal in northwest Illinois and near to slightly less than normal in northeast and north-central Illinois (Figure 4). The central and southern parts of the state were spared the white stuff, although trace amounts of snowfall were reported as far south as Decatur in mid-April.
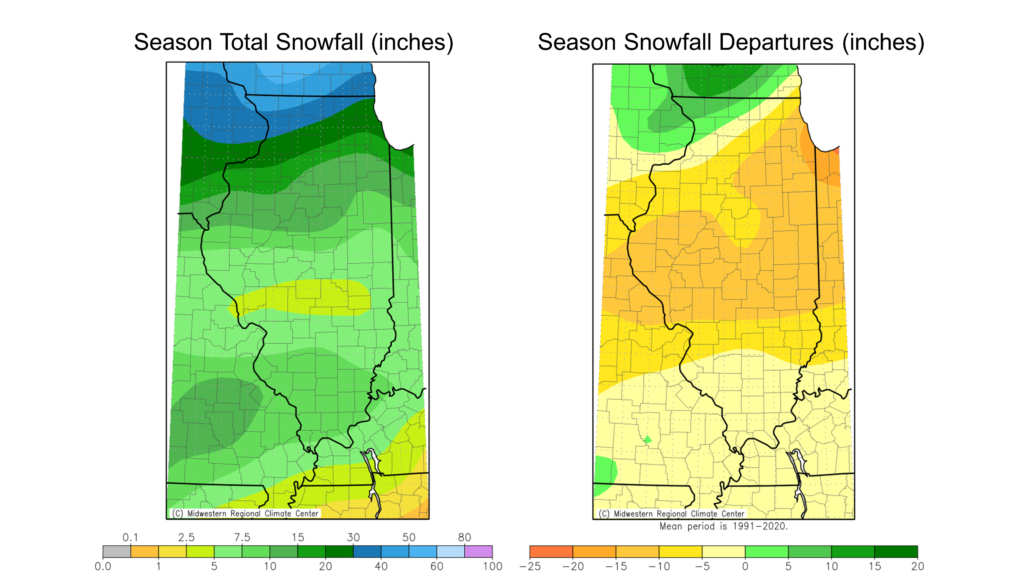
April reinforced snowfall patterns through this past snow season, namely a lot of snow for northwest Illinois and much less for everyone else. Season total snowfall (since October 1) ranged from over 50 inches in far northwest Illinois to less than 7 inches in parts of central Illinois. In fact, virtually all of southern Illinois, including the area right along the Ohio River, picked up more snow this past season than parts of central Illinois. The northwest corner of the state had 5 to 10 inches above normal snowfall, and southern Illinois was within 5 inches of normal. Meanwhile, most of the state from Chicago to St. Louis was 10 to 15 inches below normal on snowfall this season (Figure 5).
This past snowfall season, from October 1 to April 30, was the third least snowy on record in Springfield (6.3 inches) and the second least snowy on record in Champaign (7.0 inches). I will take the blame for this past season’s paltry snow totals in central Illinois, because I bought a nice, new sled last summer.
Outlooks
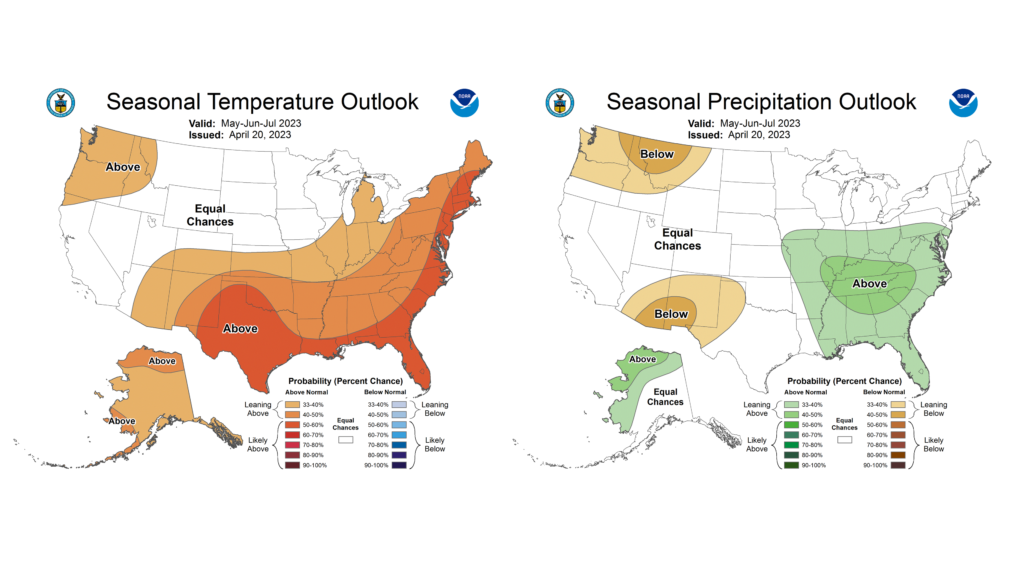
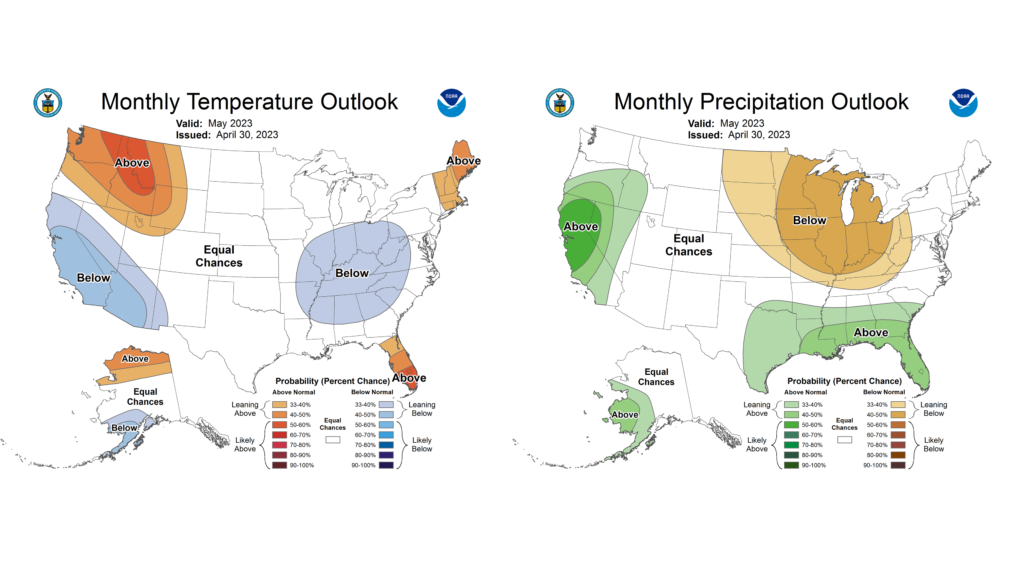
Even though April can give us a taste of summer, May is the first month when we really experience summer weather. Last year, May brought us a very early heat wave and prolonged summer-like temperatures. However, the initial outlook from the Climate Prediction Center for May shows higher chances for below normal temperatures across much of the state (Figure 6). Also interesting are the widespread higher chances for below normal precipitation.
The expected pattern flips for the three-month outlooks from May through July, with higher odds of above normal temperatures and precipitation in Illinois (Figure 7). The apparent contrast between May and May–July outlooks suggests a wetter start to summer following a possibly drier May.